The Kanban Gantt Chart is a hybrid project management tool that combines elements of both Kanban and Gantt Chart methodologies. It blends the visual simplicity and flexibility of Kanban with the timeline-based scheduling of Gantt Charts, offering a comprehensive approach to project planning, tracking, and execution.
Kanban Methodology
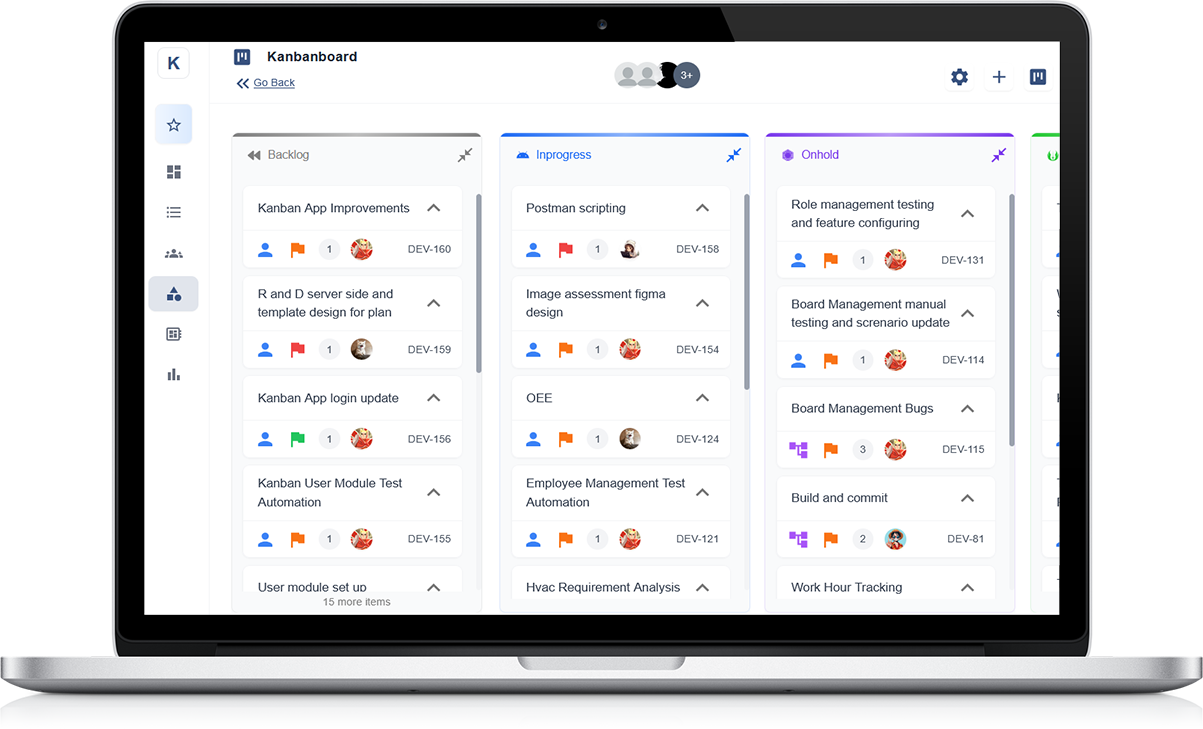
Originating from Toyota's manufacturing processes, Kanban is a visual management system focused on incremental, continuous improvement and flow efficiency.
It utilises visual boards to represent workflow stages, limits work in progress (WIP), and encourages continuous improvement through regular process reviews.
Gantt Charts:
Gantt Charts are a scheduling tool used in project management to visualise task timelines, dependencies, and resource allocation.
Tasks are represented as bars on a timeline, with their duration and dependencies clearly illustrated.
Features of the Kanban Gantt Chart:
Visual Workflow Integration:
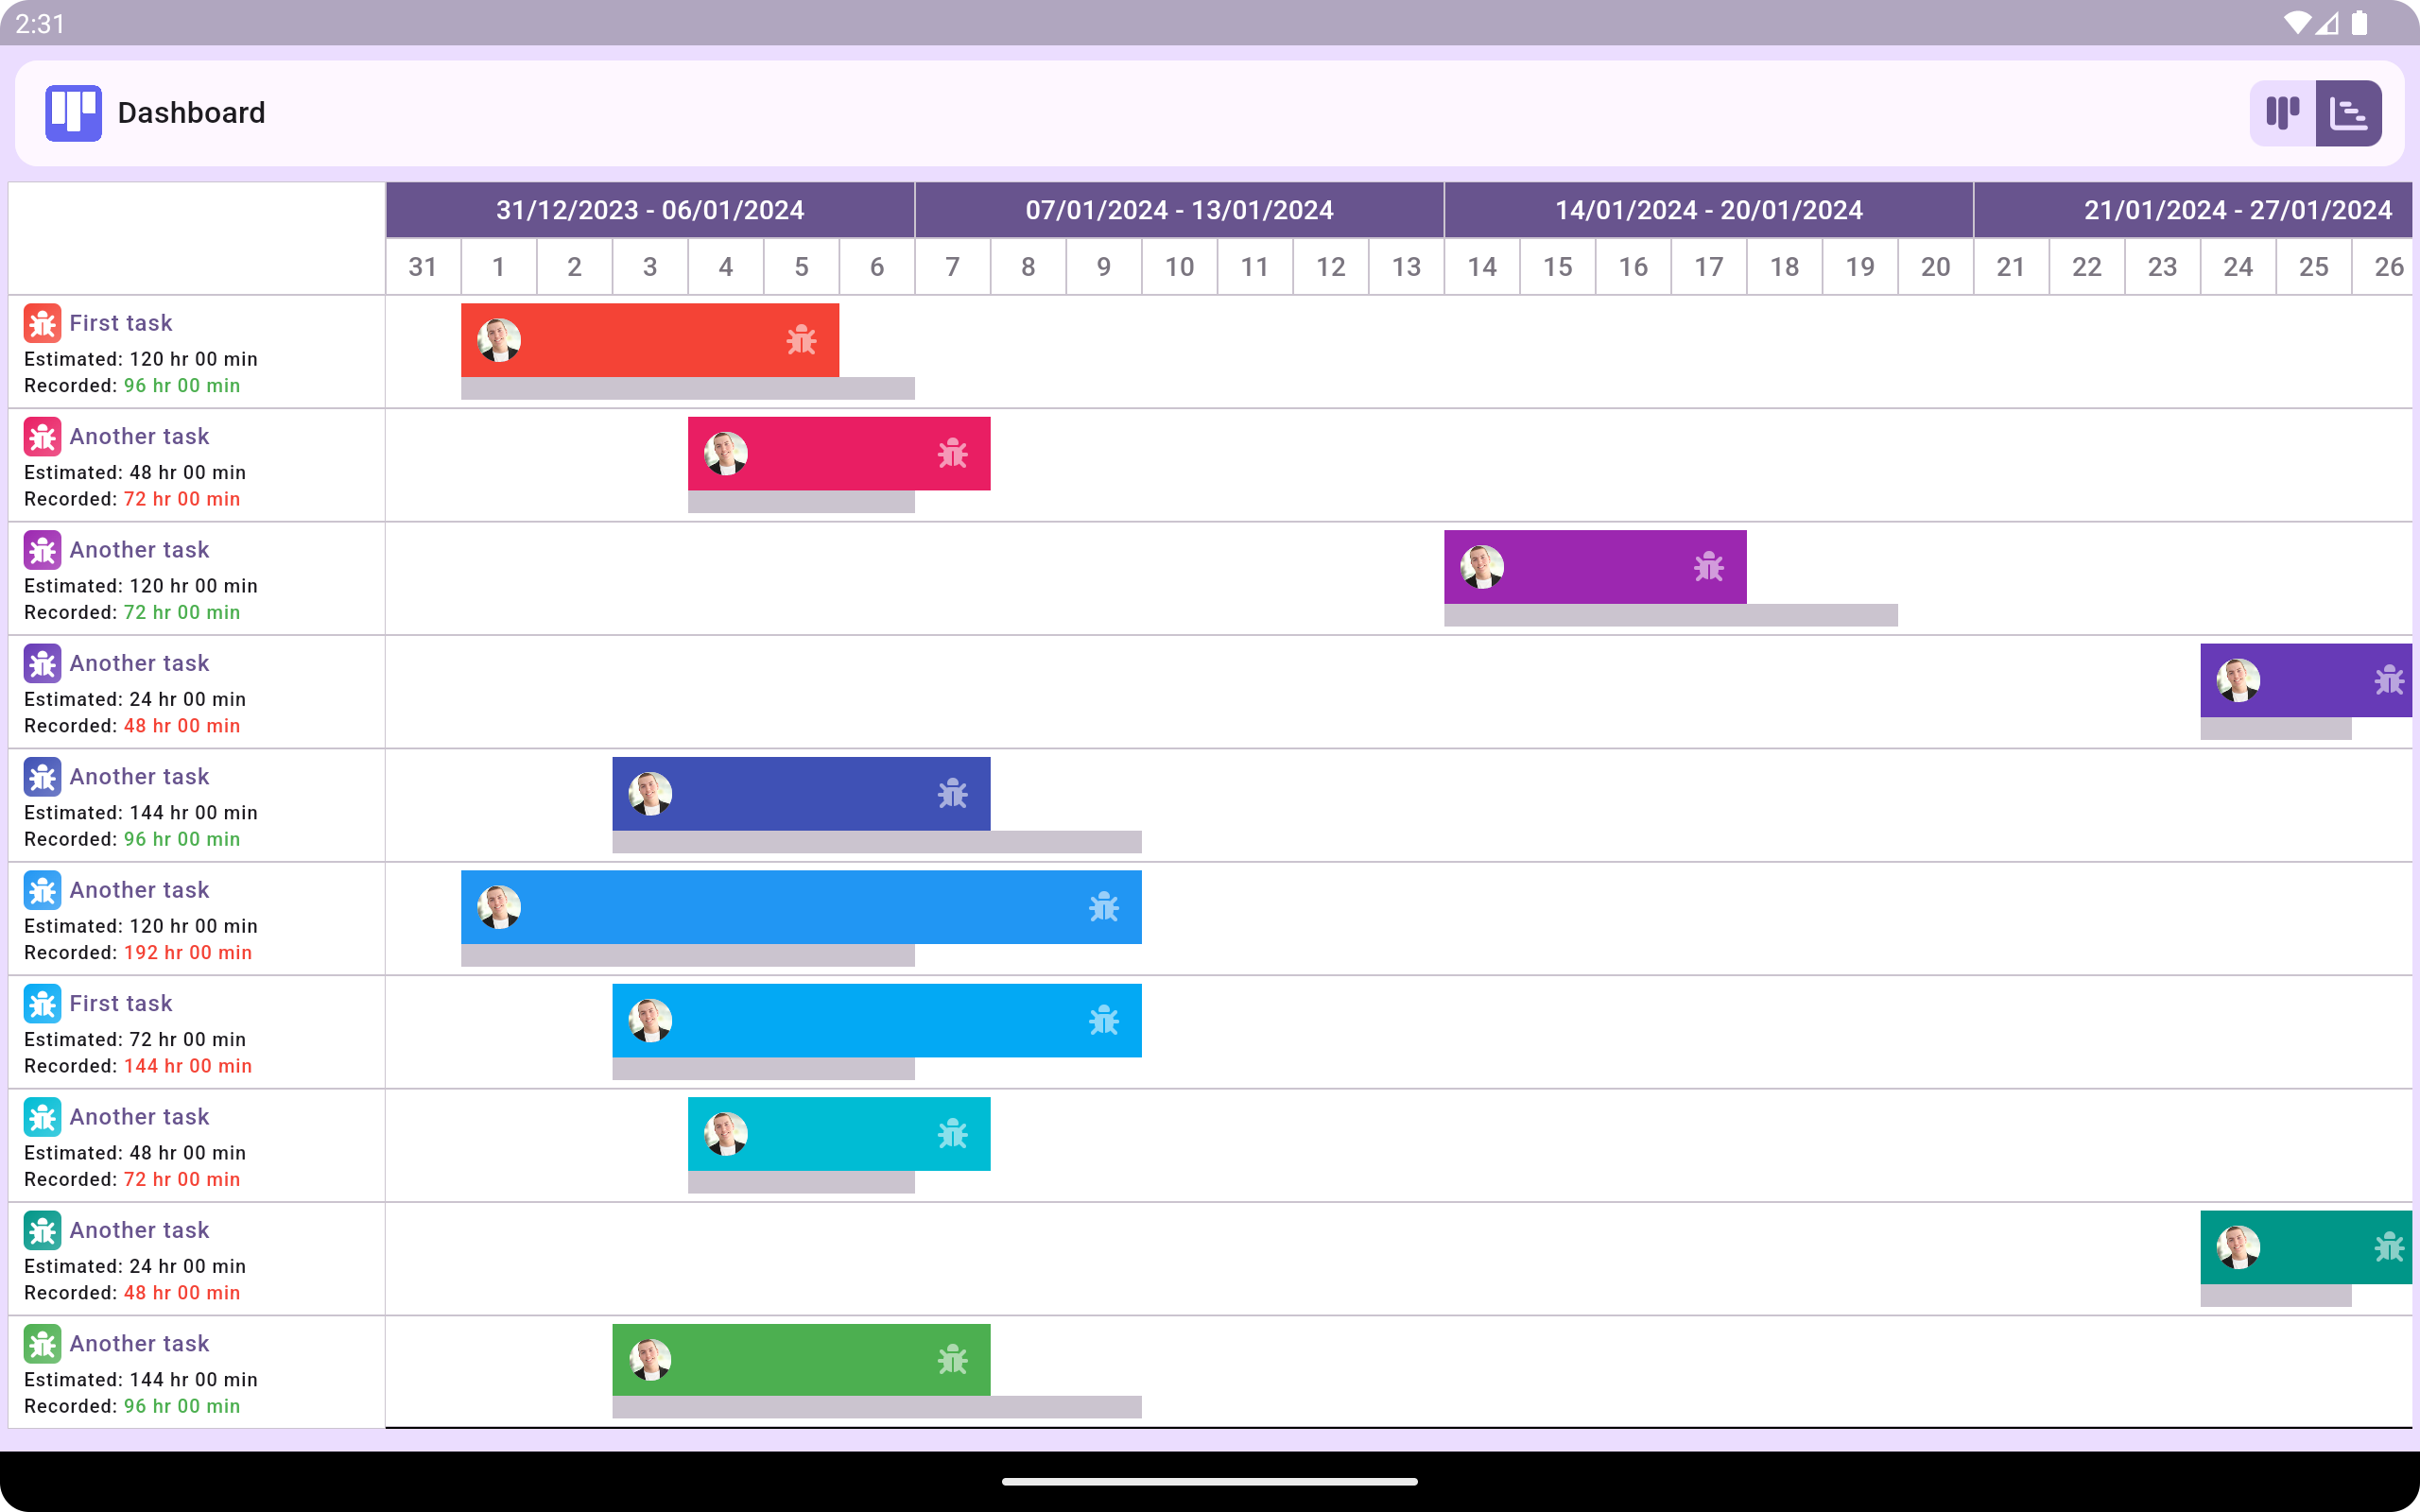
The Kanban Gantt Chart seamlessly integrates the visual simplicity of Kanban boards with the structured timeline representation of Gantt Charts.
Each task is visualised as a card on the Kanban board, with additional Gantt-like bars depicting task timelines within the workflow stages.
Task Scheduling and Dependencies:
Tasks in the Kanban Gantt Chart have defined start and end dates, allowing for precise scheduling and tracking of project timelines.
Dependencies between tasks can be visually represented, ensuring that teams understand the sequence in which tasks need to be completed.
Resource Management:
The Kanban Gantt Chart facilitates resource allocation by indicating when specific resources are needed for particular tasks.
Resource availability can be integrated into the scheduling aspect, helping teams optimise resource utilisation throughout the project lifecycle.
Continuous Improvement and Flexibility:
Teams can leverage the Kanban aspect of the chart to promote continuous improvement and adaptability by adjusting workflows and priorities as needed.
The structured scheduling provided by the Gantt Chart enhances this flexibility by offering a clear timeline for planning and tracking project progress.
Real-Time Visibility and Collaboration:
Both Kanban and Gantt elements provide real-time visibility into project status and progress, fostering collaboration and alignment among team members.
Teams can easily identify bottlenecks, monitor task progress, and make informed decisions to keep projects on track.
Kanban vs. Gantt Chart:
While Kanban and Gantt charts serve different purposes and have distinct features, they can be used together to effectively manage projects. Here are some key differences and similarities between Kanban and Gantt charts:
Visualisation: Kanban focuses on visualising the workflow and limiting work in progress, while Gantt charts visualise the project schedule and timeline.
Flexibility: Kanban is highly flexible and adaptive, making it suitable for projects with changing requirements or priorities. Gantt charts provide a more structured approach to project planning and scheduling.
Task Management: Kanban is ideal for managing ongoing tasks and continuous workflows, while Gantt charts are better suited for planning and tracking tasks with specific start and end dates.
Dependency Management: Gantt charts allow users to define task dependencies and visualise the sequence of tasks, while Kanban does not explicitly represent task dependencies.
Resource Allocation: Gantt charts provide visibility into resource allocation and help project managers schedule tasks based on resource availability. Kanban focuses on limiting work in progress to prevent resource overallocation.
Benefits of the Kanban Gantt Chart:
Enhanced Planning and Tracking: Combining Kanban's visual workflow with Gantt's structured timeline enables teams to plan and track projects with greater precision and clarity.
Improved Resource Utilisation: The integrated resource management features of the Kanban Gantt Chart help teams optimise resource allocation throughout the project lifecycle, reducing bottlenecks and overloads.
Facilitated Collaboration and Communication: Real-time visibility and collaboration features foster alignment among team members, promoting effective communication and coordination.
Adaptability: The Kanban Gantt Chart is well-suited for environments, allowing teams to maintain Agile principles while benefiting from structured scheduling and visualisation.
Real-World Applications:
Software Development: Kanban Gantt Charts to plan sprints, track task progress, and manage dependencies effectively.
Construction and Engineering: Construction projects benefit from the detailed scheduling and resource management capabilities of the Kanban Gantt Chart, ensuring timely completion of tasks and efficient resource allocation.
Marketing and Creative Projects: Marketing teams and creative agencies utilise Kanban Gantt Charts to manage campaigns, track deliverables, and coordinate activities across different departments.
Manufacturing and Production: Manufacturing companies leverage Kanban Gantt Charts to optimise production workflows, monitor inventory levels, and ensure timely delivery of goods.
The Kanban Gantt Chart represents a powerful hybrid approach to project management, combining the strengths of Kanban methodology with the structured scheduling and visualisation capabilities of Gantt Charts. By integrating these methodologies, teams can achieve enhanced planning, tracking, and execution of projects across various industries and project types. With its emphasis on continuous improvement, adaptability, and real-time collaboration, the Kanban Gantt Chart stands as a valuable tool for modern project teams striving for efficiency and success.