What is an SQDP Board?
SQDP is a framework widely applied in manufacturing and operations to evaluate four critical areas: Safety, Quality, Delivery, and Productivity. These dimensions are consistently monitored to drive continuous improvement and ensure operational excellence.
- Safety: Ensuring a safe work environment by identifying hazards, implementing risk reduction measures, and adhering to rigorous safety standards to protect employees and minimise accidents.
- Quality: Maintaining high-quality standards for products and services through ongoing monitoring, process enhancements, and defect reduction to meet or exceed customer expectations.
- Delivery: Ensuring on-time and accurate order fulfillment by streamlining workflows, reducing lead times, and overcoming bottlenecks to guarantee customers receive products as promised.
- Productivity: Maximising operational efficiency by optimising processes, promoting continuous improvement, and engaging employees in the pursuit of higher performance and value creation.
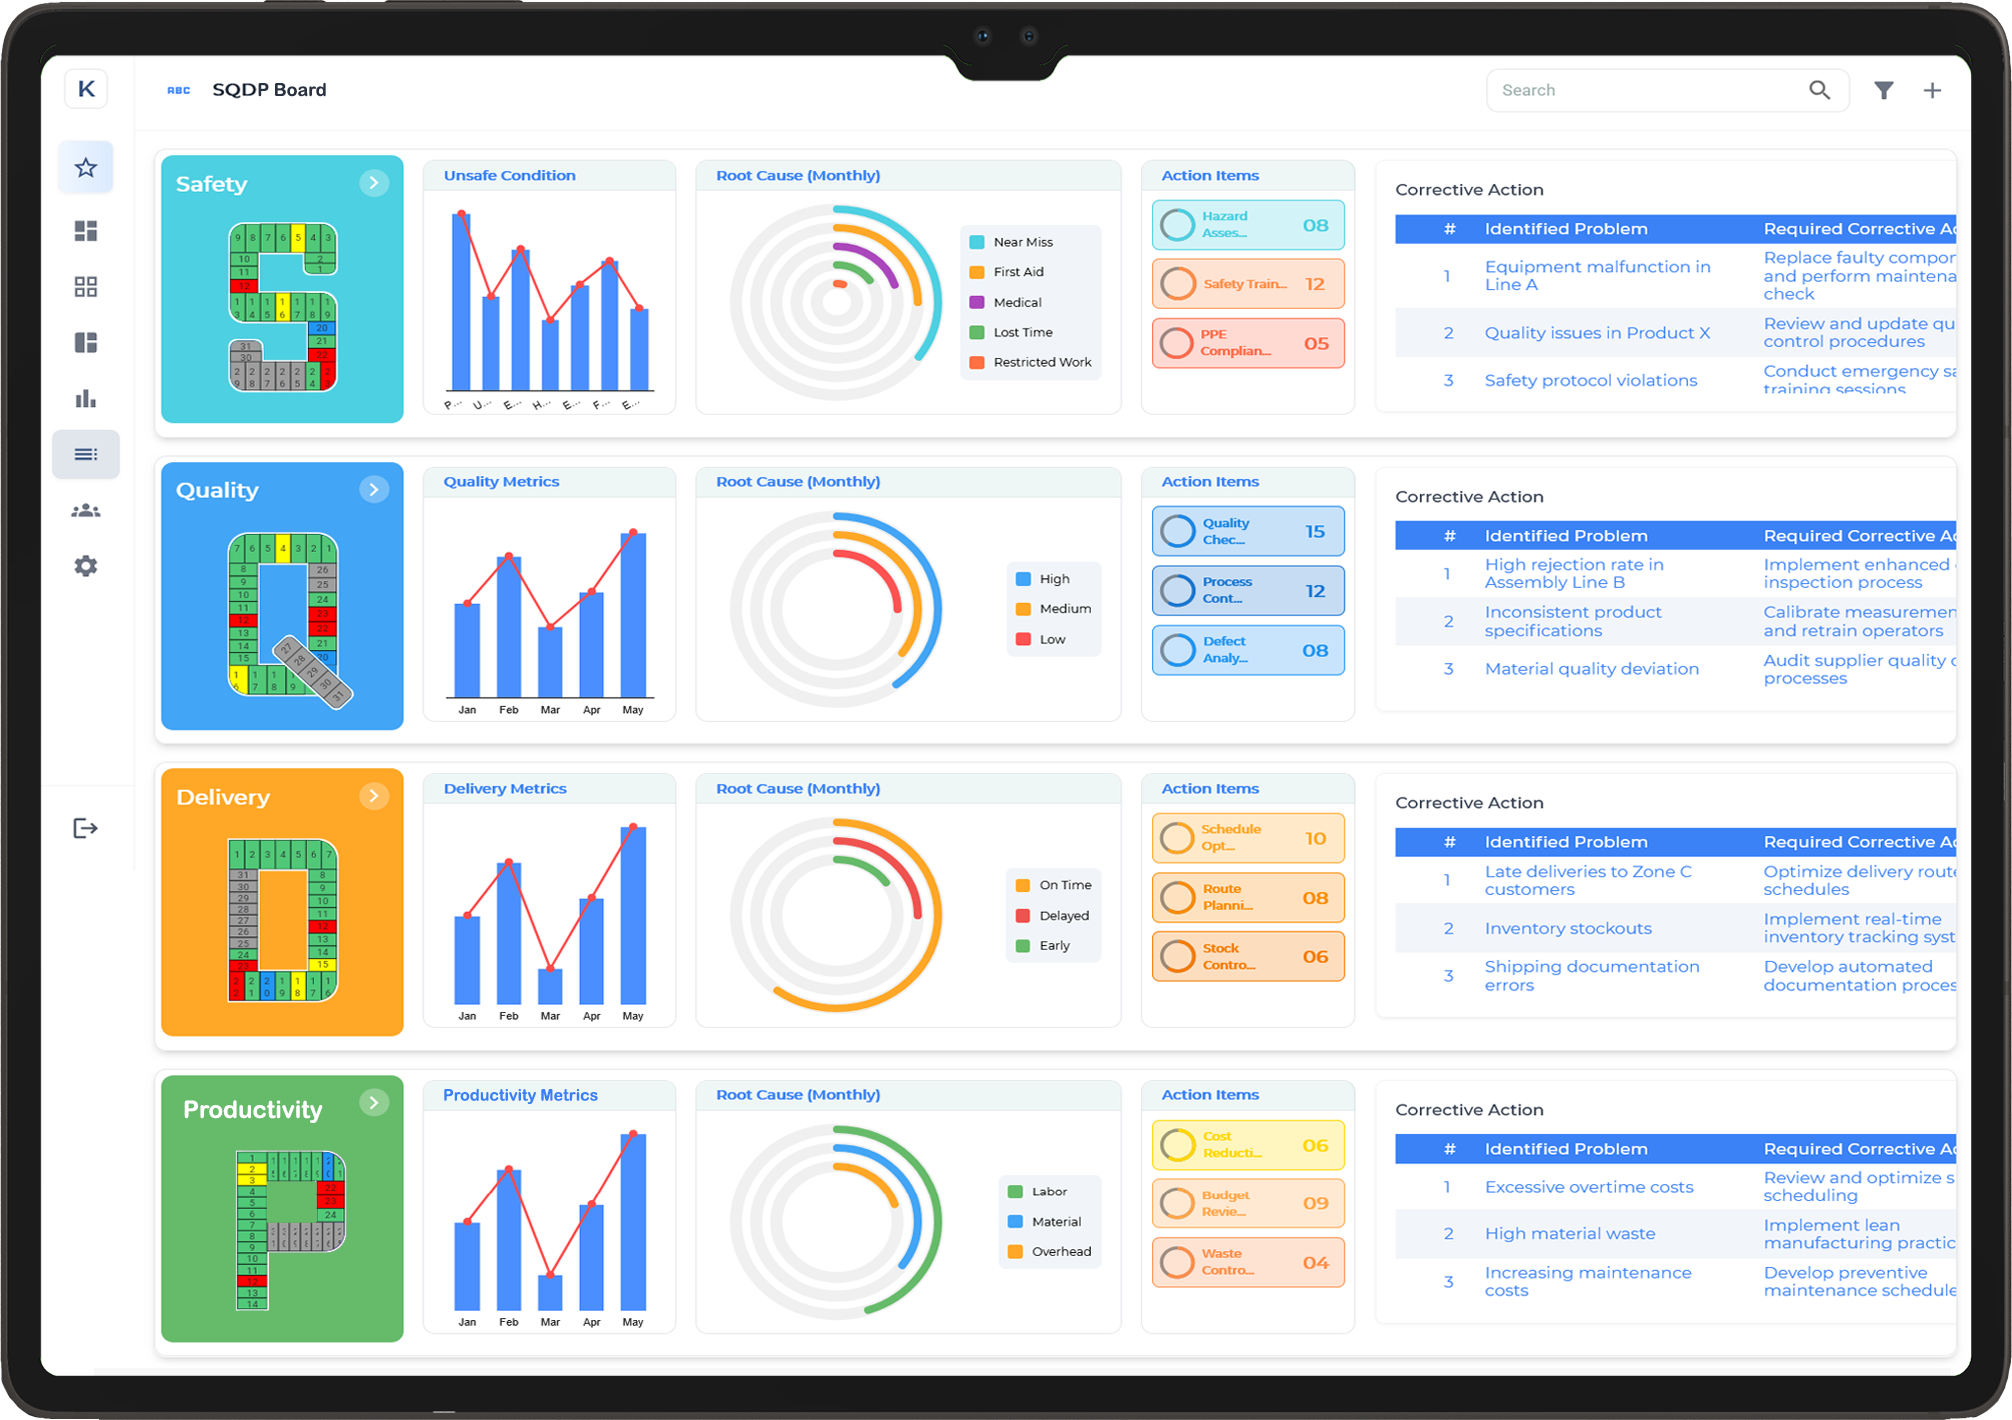
Safety
The Balanced Scorecard is essential in enhancing workplace safety by continuously monitoring safety-related incidents. By reviewing reported accidents and near-misses, it provides crucial insights into the effectiveness of safety measures and identifies areas for proactive improvement and risk reduction.
- Number of Reported Workplace Accidents
- High-Potential Near-Miss Incidents Recorded
- Completed Root Cause Analyses for Safety Incidents
- Safety Briefings and Training Sessions Conducted
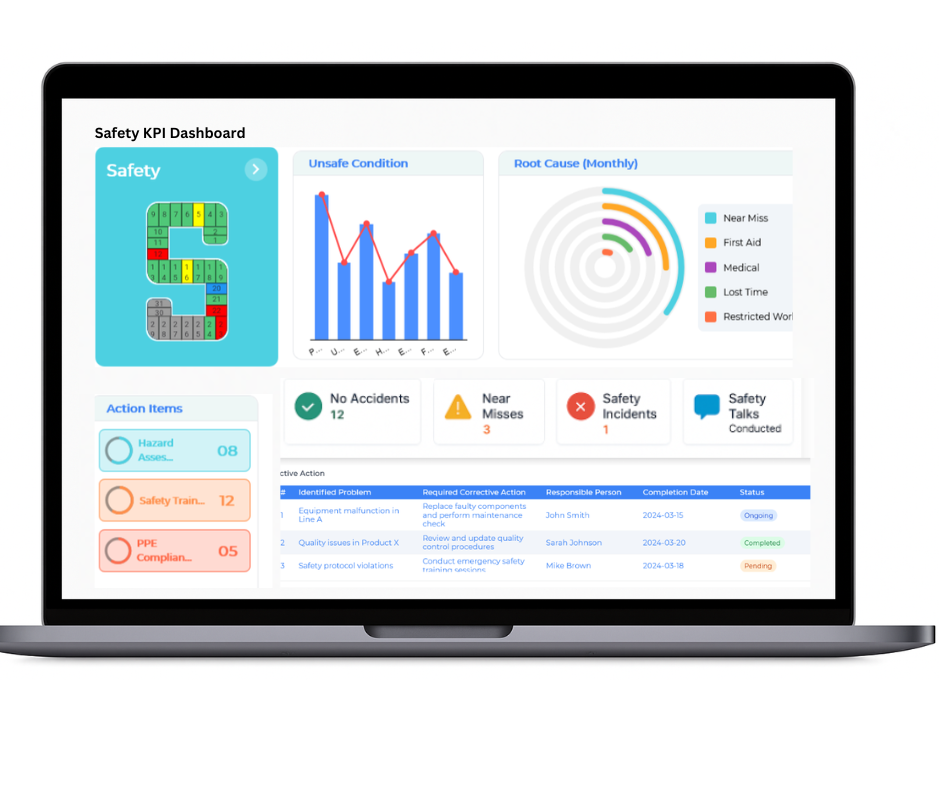
Quality
The Balanced Scorecard’s quality metrics provide a comprehensive assessment of both product quality and process effectiveness. By tracking defect rates, inspection results, rework occurrences, and non-conformance reports—along with feedback from both suppliers and customers—organisations can strengthen their quality management systems and foster a culture of continuous improvement.
- Product Defects Identified and Analysed
- Failures in Quality Inspections and Functional Tests
- Rework Instances Recorded and Corrective Actions Taken
- Non-Conformance Reports (NCRs) Filed for Compliance Issues
- Supplier Material Quality Problems Identified and Resolved
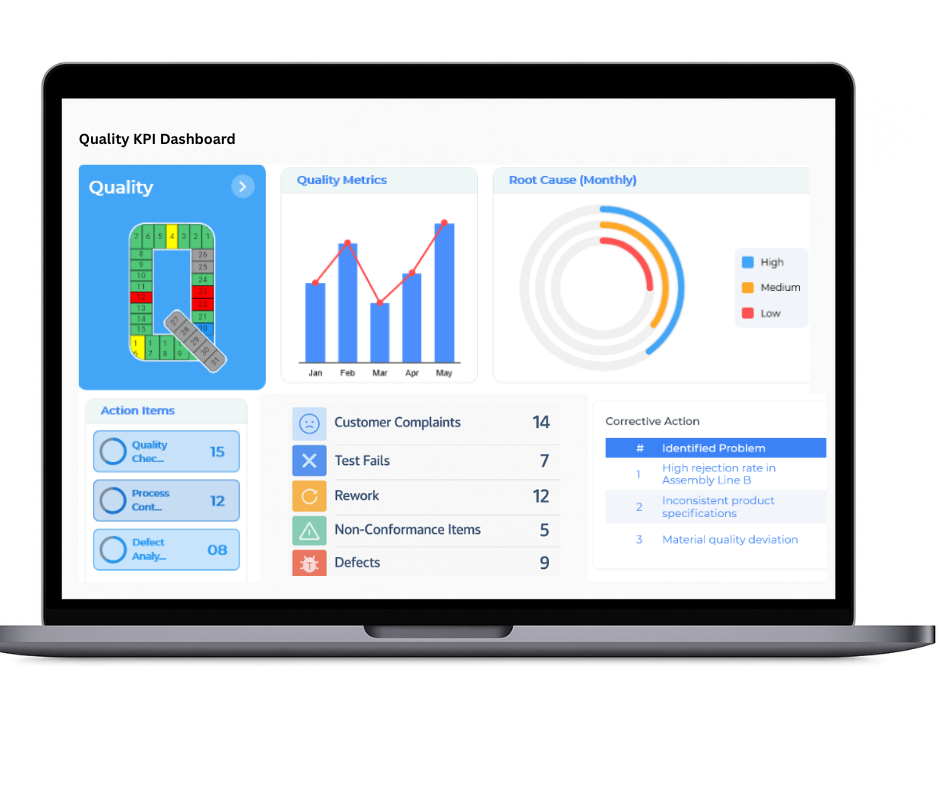
Delivery
The Balanced Scorecard offers a comprehensive view of the delivery process, ensuring consistent On Time In Full (OTIF) performance from the initial supplier shipment to final customer receipt. By evaluating logistics efficiency, order fulfillment accuracy, and inventory flow, it provides valuable insights that drive supply chain optimisation and strategic decision-making.
- Examination of Late Deliveries and Root Cause Analysis
- Tracking of On Time In Full (OTIF) Delivery Performance
- Validation of Order Accuracy and Dispatch Consistency
- Evaluation of Warehouse Efficiency and Inventory Turnover
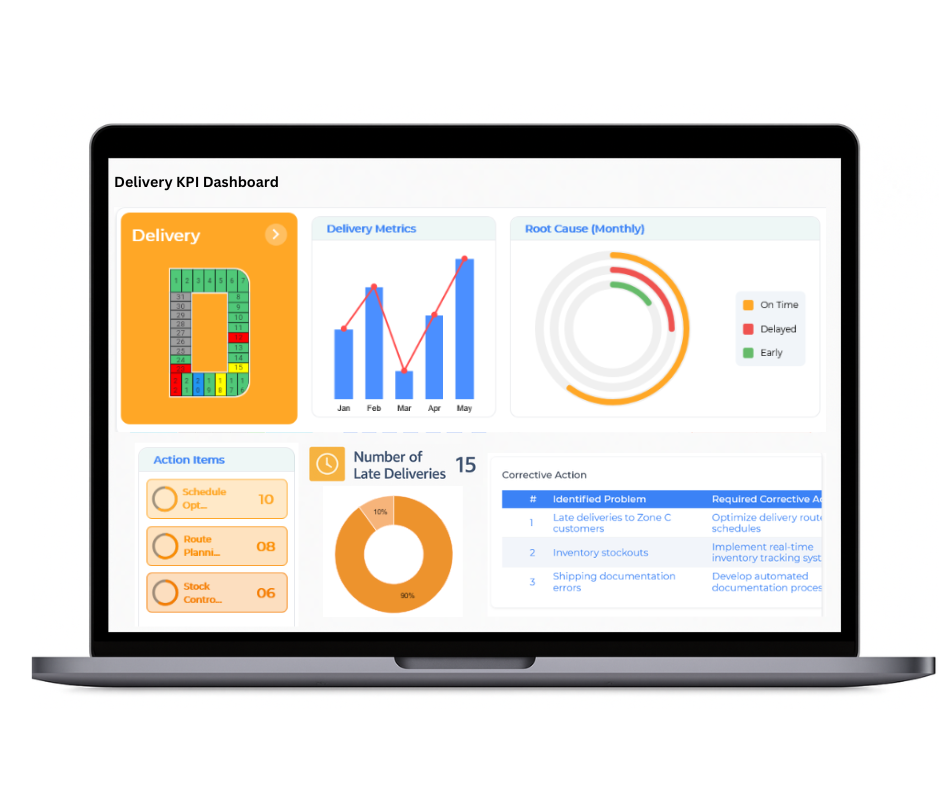
Productivity
Productivity management is crucial for optimising operations and enhancing overall efficiency. The Balanced Scorecard provides a structured approach to evaluating key productivity metrics, helping organisations identify areas for process improvement, drive resource efficiency, and ensure consistent output quality while maintaining operational effectiveness.
- Implementation of Process Optimisation Initiatives
- Comprehensive Monitoring of Operational Efficiency
- Enhancement of Resource Utilisation and Workforce Productivity
- Enforcement of Standardised Operational Procedures
- Continuous Improvement of Workflow and Task Management
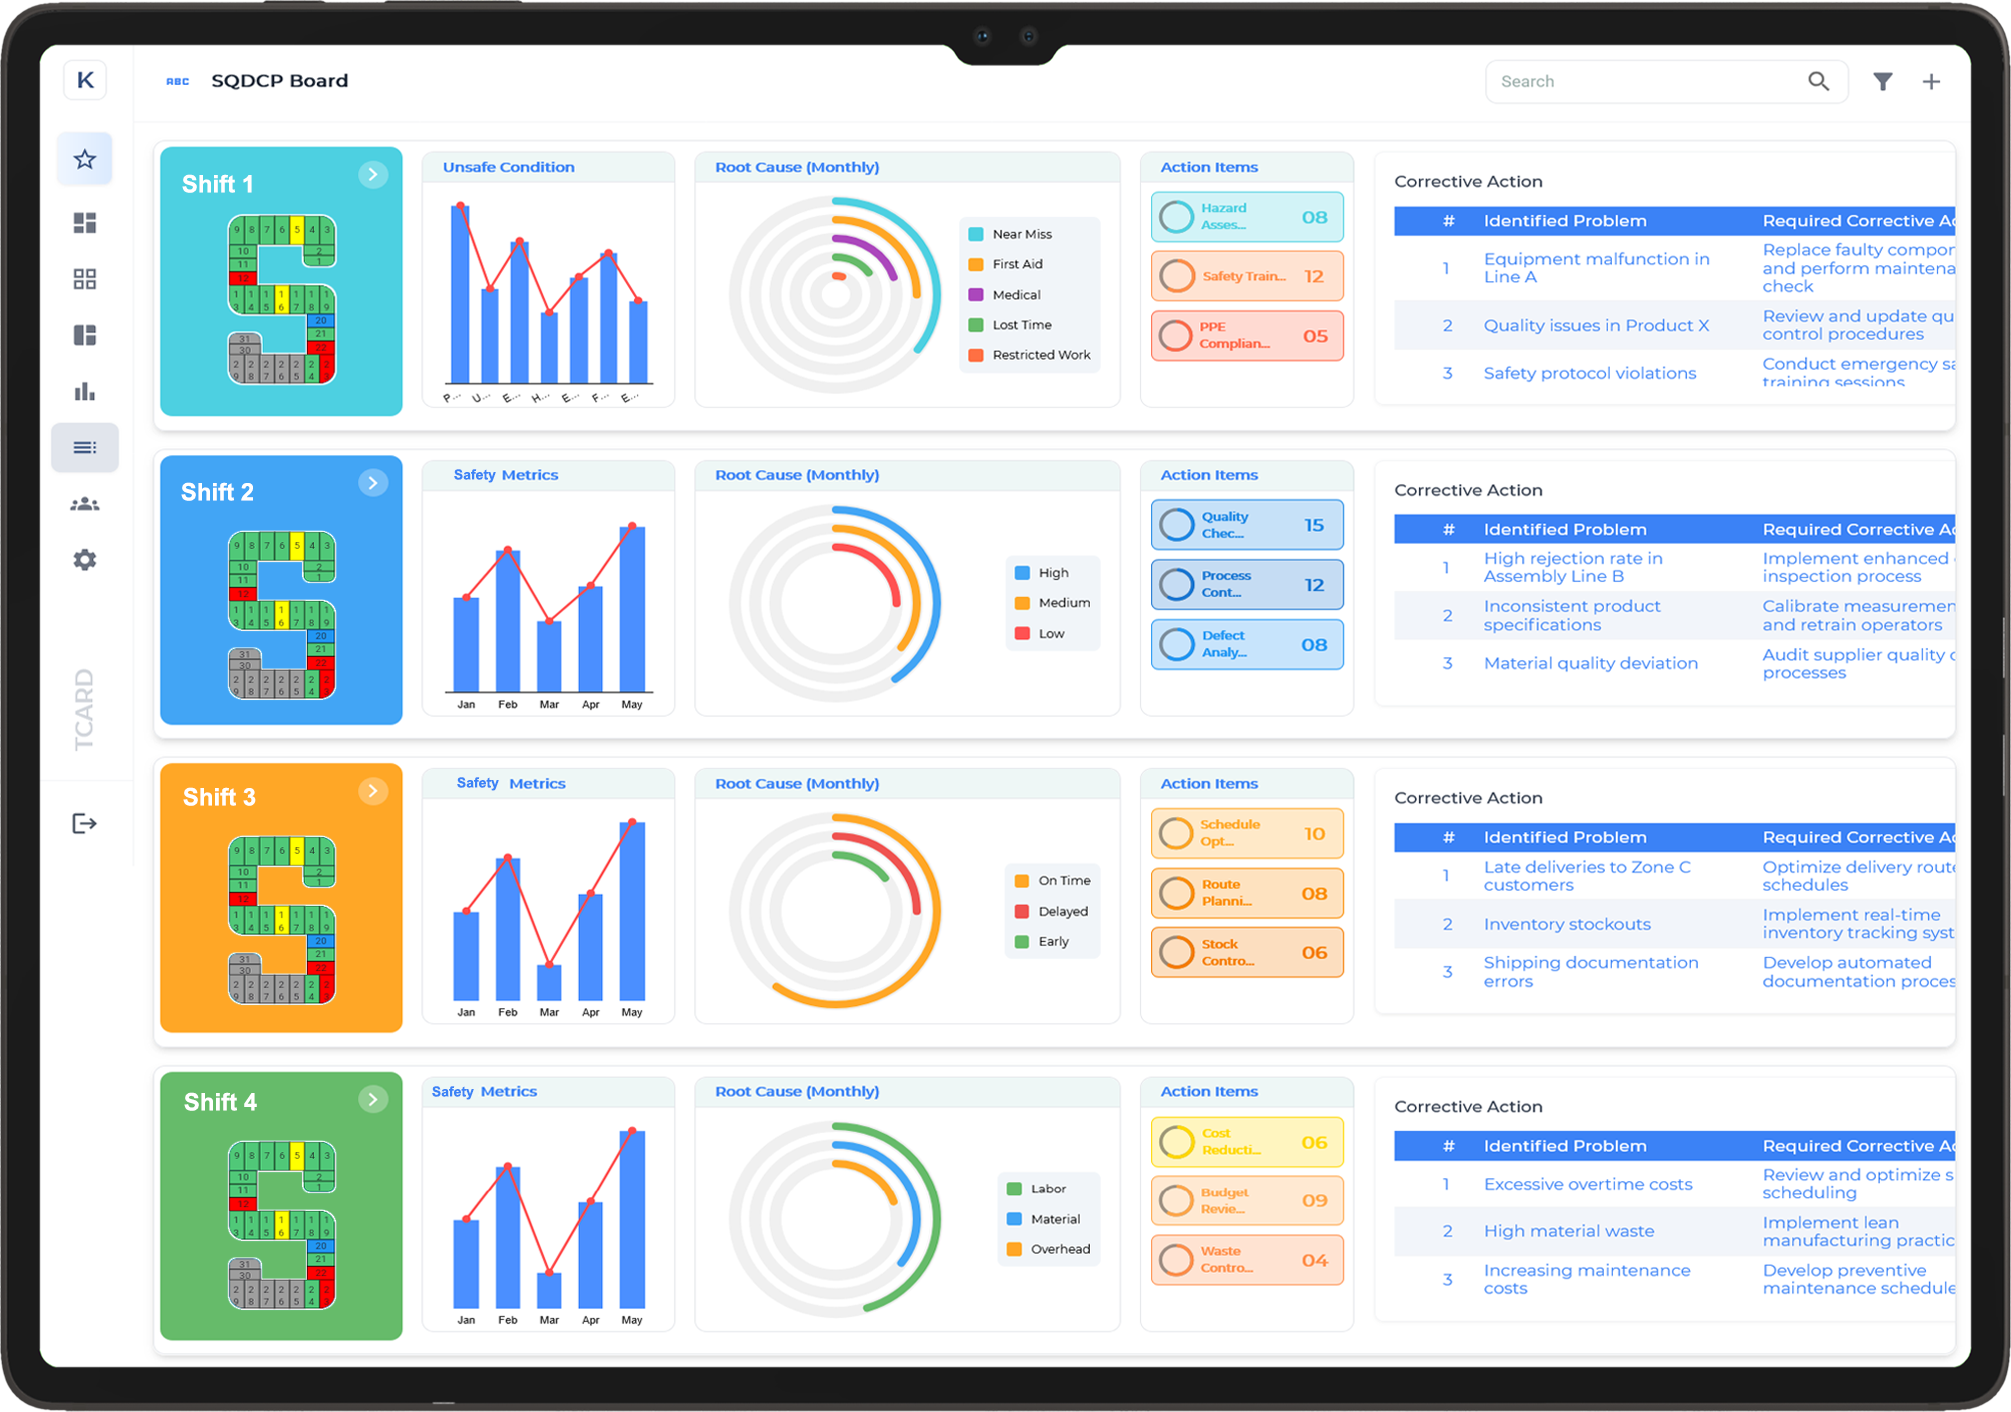
SQDP Board for Shift Management
- Continuous Performance Tracking: Monitors essential metrics across Safety, Quality, Delivery, and Productivity to ensure consistent alignment with business objectives and operational goals.
- Proactive Safety Management: Tracks workplace incidents, near-misses, and safety audits to strengthen safety protocols and reduce operational risks across all processes.
- Commitment to Quality: Evaluates defect rates, rework trends, and adherence to quality standards to foster continuous improvements in product and service delivery.
- Optimised Delivery Performance: Assesses On-Time-In-Full (OTIF) delivery metrics, identifies scheduling delays, and optimises processes to ensure reliable and timely order fulfillment.
- Productivity and Resource Efficiency: Focuses on improving operational productivity, optimising resource use, reducing waste, and enhancing overall efficiency to support business growth.
- Workforce Engagement and Satisfaction: Monitors employee morale, satisfaction, training progress, and collaboration levels to maintain a motivated and high-performing workforce.
- Environmental Sustainability: Tracks energy consumption, waste management practices, and emissions to meet sustainability objectives and comply with environmental regulations.
What Does SQDP Stand For? A Quick Guide to Each Metric
SQDP is a commonly used performance management tool across various industries, especially in manufacturing and operations. It stands for Safety, Quality, Delivery, and Productivity. Each of these metrics helps teams track and improve their day-to-day performance. Let’s take a closer look at what each one means and how it contributes to operational success.
Safety
Safety is always the top priority in any workplace. This metric helps track the number of incidents, near misses, or hazards reported. A strong focus on safety ensures a healthier work environment, reduces downtime, and shows a commitment to protecting employees. Regular safety checks and team involvement are key to maintaining a safe workplace.
Quality
Quality measures whether products or services meet expected standards. It often includes tracking defects, rework, or customer complaints. Monitoring this metric helps reduce waste and improves customer satisfaction. When quality is consistent, it builds trust with customers and reduces operational costs over time.
Delivery
Delivery refers to how well a team meets deadlines or customer requirements. It tracks on-time delivery rates, lead times, or missed commitments. Staying on schedule is critical to customer satisfaction and smooth operations. Monitoring this area helps teams identify bottlenecks and improve workflow efficiency.
Productivity
Productivity measures how efficiently resources are being used. It could involve tracking output per shift, task completion rates, or downtime. Improving productivity ensures that time and materials are used wisely, leading to better results without added cost or effort.
By regularly reviewing SQDP metrics, teams can maintain high standards, reduce risks, and support continuous improvement across all areas of work.
Why SQDP Boards Are Gaining Popularity in Lean Workplaces
Lean workplaces focus on reducing waste, improving efficiency, and creating value through continuous improvement. SQDP boards have become increasingly popular in these environments because they offer a clear and simple way to track performance across key areas: Safety, Quality, Delivery, and Productivity. Here's why more organisations are turning to SQDP boards to support their lean goals.
Clear Visual Communication
One of the biggest strengths of an SQDP board is its ability to communicate important information at a glance. Team members can see where things stand, what needs attention, and how their efforts impact the bigger picture. This visibility promotes transparency and encourages proactive problem-solving.
Focus on Daily Improvement
SQDP boards help teams focus on what matters most each day. By reviewing the four key areas daily, teams can quickly spot trends, celebrate wins, and tackle issues before they grow. This approach supports the lean principle of continuous improvement and helps maintain consistent progress.
Increased Team Ownership
When team members are involved in updating and reviewing the board, they take greater ownership of results. SQDP boards make performance visible and shared, which boosts engagement and accountability. Teams become more invested in improving their own processes and outcomes.
Flexible for Any Industry
Although widely used in manufacturing, SQDP boards can be adapted for service-based roles, logistics, healthcare, and more. Their simple format makes them a practical tool for tracking performance, regardless of the industry.
As lean thinking continues to grow, so does the use of tools like SQDP boards that support teamwork, visibility, and improvement every day.
S is for Safety: Prioritising a Risk-Free Work Environment
In any workplace, safety should always come first. The “S” in SQDP or SQDCI stands for Safety, highlighting the importance of creating an environment where employees feel protected and risks are minimised. Prioritising safety is not just about avoiding accidents — it’s about building a culture of care, awareness, and responsibility.
Making Safety Everyone’s Responsibility
When safety is part of daily discussions and visible on performance boards, it reminds every team member that their actions matter. Regular safety checks, reporting near misses, and discussing hazards during team huddles help build awareness. By encouraging everyone to take part, safety becomes a shared goal, not just a management task.
Tracking and Responding to Incidents
Safety metrics on a board might include the number of days without incidents, reports of unsafe conditions, or completion of safety training. These simple indicators help teams see progress and areas needing improvement. More importantly, they trigger timely responses to issues before they lead to bigger problems.
Creating a Safer Culture
A risk-free environment improves morale, reduces downtime, and shows employees that their well-being matters. When safety is consistently prioritised, it leads to fewer injuries and a more stable, productive workplace.
By placing safety at the forefront of daily operations, organisations not only protect their people but also build a strong foundation for long-term success and continuous improvement.
Q is for Quality: Keeping Standards High Across All Operations
Quality is a core focus in any successful organisation. The “Q” in SQDP stands for Quality, reminding teams to maintain high standards in everything they do. From product output to service delivery, quality impacts customer satisfaction, team pride, and overall business success.
What Quality Means in the Workplace
Quality is more than just meeting basic requirements. It’s about doing things right the first time, every time. This applies to all areas – whether it's assembling parts, packing goods, answering customer calls, or processing documents. When quality is consistent, fewer mistakes happen, and trust in your brand grows.
Tracking Quality with Simple Metrics
On a daily performance board, quality can be tracked using easy-to-understand indicators. These might include defect counts, rework rates, customer complaints, or first-pass yield. These simple figures help teams quickly spot trends and act before issues spread.
Encouraging a Culture of Excellence
When everyone in the team is responsible for quality, it creates a culture of care and attention. Regular discussions about quality during huddles or team meetings help keep it top of mind. Staff become more aware of how their role directly affects the end result.
Maintaining high-quality standards isn’t just about avoiding problems – it’s about taking pride in your work and continuously improving. When quality is part of the daily routine, excellence becomes a habit, not just a goal.
D is for Delivery: Improving Timelines with Clear Metrics
The “D” in SQDP stands for Delivery – a key performance area that focuses on meeting deadlines, keeping promises, and ensuring work flows smoothly through every stage. Whether it’s completing tasks, shipping goods, or providing services, delivery performance has a direct impact on customer satisfaction and business efficiency.
Why Delivery Matters Every Day
On-time delivery builds trust with customers and keeps operations running without delays. When teams hit their delivery targets consistently, it reduces stress, avoids backlogs, and creates a stable work rhythm. In fast-paced environments, clear delivery goals help everyone stay focused and organised.
Using Daily Metrics to Stay on Track
Delivery metrics are easy to track and update on an SQDP board. Common measures include orders completed on time, missed deadlines, or tasks delayed due to internal issues. These numbers give teams a quick view of how well they are meeting expectations and where improvements are needed.
Solving Issues Before They Escalate
By reviewing delivery data daily, teams can catch problems early – whether it’s a supply delay, a staffing gap, or a scheduling clash. This allows for quicker action and smarter planning, which keeps everything moving on time.
Focusing on delivery helps build a workplace that values time, responsibility, and reliability. With clear metrics and daily attention, teams can meet goals more easily and respond to customer needs with confidence.

P is for People: Putting Workforce Engagement at the Centre
The “P” in SQDP stands for People – the heart of any successful operation. While systems and processes are vital, it’s the people who drive progress, solve problems, and deliver results. Focusing on workforce engagement helps create a positive environment where individuals feel valued, motivated, and empowered to contribute their best every day.
Why People Matter in Daily Operations
Engaged team members bring energy, ideas, and commitment to their work. When people feel heard and supported, they take greater ownership of their tasks and are more likely to go the extra mile. Recognising effort, encouraging feedback, and supporting growth all play a role in building a strong and dedicated team.
Tracking Engagement in Simple Ways
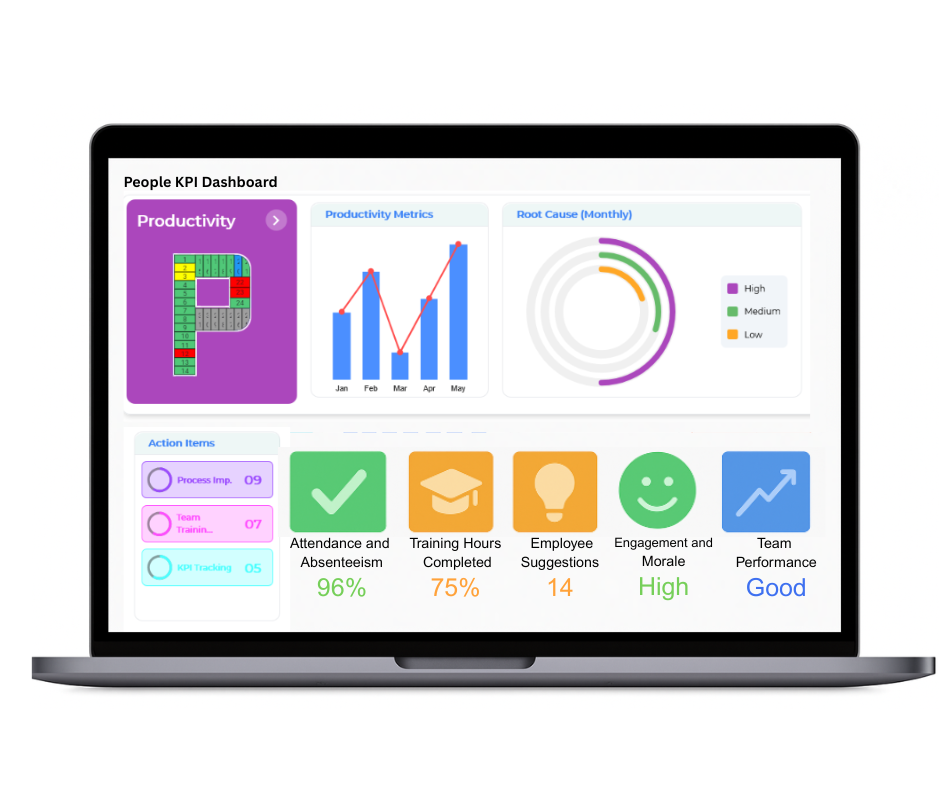
People-focused metrics can be included on an SQDP board to reflect wellbeing, morale, and participation. Examples might include attendance, training completion, or ideas shared for improvement. These indicators offer insight into team dynamics and help leaders identify areas where support may be needed.
Creating a Culture of Respect and Inclusion
Daily check-ins and regular team huddles provide a space for open communication and connection. By involving people in decisions and updates, organisations show that every voice counts. This builds trust and encourages collaboration across all levels.
Prioritising people leads to a more engaged, productive, and resilient workforce. When people thrive, performance follows – making them a key pillar of sustainable success.
The Benefits of Using SQDP Boards in Daily Stand-Up Meetings
Daily stand-up meetings are a simple yet powerful way to align teams, share updates, and keep operations running smoothly. When paired with an SQDP board, these meetings become even more effective. The SQDP board brings structure and focus, helping teams cover key performance areas such as Safety, Quality, Delivery, and People in a clear, visual format.
Keeping Teams Focused and Informed
Using an SQDP board ensures that every meeting has a clear agenda. By reviewing each section, teams can quickly understand what’s working and where attention is needed. This keeps everyone informed, reduces confusion, and promotes shared accountability.
Encouraging Team Involvement
With a visible board, team members are more likely to engage and speak up. They can see how their work impacts wider goals and feel more connected to the team’s success. It also creates a safe space to raise concerns, offer ideas, or celebrate wins together.
Driving Daily Improvement
Because the SQDP board is updated regularly, it helps teams track changes and spot trends over time. Small issues can be addressed before they grow, and continuous improvement becomes part of the daily routine.
Incorporating an SQDP board into stand-up meetings strengthens communication, builds a culture of ownership, and keeps performance on track. It’s a practical tool that supports teamwork and drives results across all levels of the organisation.
How to Set Up an SQDP Board That Actually Drives Results
An SQDP board is a simple yet powerful tool for tracking daily performance across key areas – Safety, Quality, Delivery, and People. But to truly get results, it needs to be set up with purpose and used consistently. A well-designed board helps teams focus, spot problems early, and improve performance together.
Start with Clear Categories
Begin by dividing your board into the four SQDP pillars. Use simple headings and make sure there’s space to write daily updates. Each section should reflect real issues and progress in your workplace, not just generic targets.
Use Simple and Visible Metrics
Choose easy-to-understand indicators that can be updated daily. For example, track the number of safety incidents, product defects, late deliveries, or absences. Colour coding (such as green for good, red for attention needed) can help highlight performance at a glance.
Make It a Team Tool
The board works best when everyone contributes. Use it during daily stand-ups to guide conversation and involve the whole team. Encourage input and updates from staff who do the work – their insights are key to spotting and solving problems.
A good SQDP board should reflect real performance, not just be a display. When set up with care and used actively, it becomes a valuable tool for daily improvement, teamwork, and long-term success.
From Paper to Digital: Modernising Your SQDP Board Workflow
Many teams start their SQDP journey with paper boards. They’re simple, low-cost, and effective for building daily habits. But as teams grow or look to improve speed and accuracy, digital SQDP boards offer a smart upgrade. Moving to a digital format can streamline communication, boost data tracking, and make continuous improvement easier to manage.
Why Go Digital?
Digital boards make it easier to update information in real time, especially for teams working across shifts or locations. Data is saved automatically, making it easier to review trends and spot repeating issues. You can also add helpful features like charts, task tracking, or notifications without cluttering your board.
What to Keep from the Paper Method
The visual structure of SQDP boards is what makes them effective. A good digital board should still include the four main sections: Safety, Quality, Delivery, and People. It should remain easy to read and quick to update – even with added features.
Keeping Teams Engaged
Digital tools should support team discussions, not replace them. Daily meetings and check-ins remain just as important. Make sure everyone can access and interact with the board, whether on a screen in the workspace or remotely through a shared platform.
By going digital with the right setup, you can bring greater visibility, flexibility, and insight to your SQDP process – helping teams stay aligned and focused on results.
Using Colour Coding and Visual Cues on Your SQDP Board
Colour coding and visual cues are powerful tools to enhance the effectiveness of your SQDP board. They help teams quickly assess performance, identify issues, and focus on areas that need attention. By incorporating these elements, your board becomes not just a tracker, but a proactive tool for daily improvements.
Simple and Clear Colour Coding
Colour coding is a simple yet effective way to convey information at a glance. For example, you can use green for areas that are performing well, yellow for those that need attention, and red for those that require immediate action. This system helps team members quickly identify where to focus their efforts during daily meetings.
Adding Visual Cues for Quick Insights
In addition to colours, visual cues like icons, charts, and arrows can further enhance clarity. Use icons to represent common issues such as safety hazards or quality defects. Arrows can indicate trends, such as increasing defects or improving safety. These visual cues allow teams to spot patterns or problems without needing to read through every detail.
Consistency is Key
For colour coding and visual cues to be truly effective, consistency is crucial. Establish a clear set of rules for how colours and symbols are used across all SQDP boards. This consistency ensures that everyone interprets the information in the same way, improving communication and reducing confusion.
By using colour coding and visual cues, you transform your SQDP board into an engaging, easy-to-read tool that keeps your team aligned and focused on continuous improvement.
Boosting Team Accountability with Clear SQDP Metrics
Clear and measurable metrics are at the heart of any successful team. When applied to an SQDP board, these metrics not only track performance but also boost team accountability. By setting and displaying specific targets for Safety, Quality, Delivery, and People, teams can easily see how their actions contribute to the overall success of the organisation.
Defining Clear and Achievable Metrics
To enhance accountability, it’s important to establish clear, specific, and achievable metrics for each of the four SQDP areas. For instance, in Safety, a metric might be the number of safety incidents per week, while in Quality, it could be the percentage of products passing inspection. These measurable indicators make it easy for teams to track their progress and stay focused on key goals.
Making Metrics Visible and Accessible
Once defined, these metrics need to be displayed prominently on the SQDP board so that they’re accessible to all team members. This constant visibility encourages ownership and responsibility, as everyone can see where they are excelling and where improvements are needed. Visual cues like colour coding or progress bars can make these metrics even more engaging.
Regular Reviews and Updates
To maximise accountability, it’s essential to review the metrics regularly. This can be done during daily stand-ups or weekly reviews, where teams discuss performance and any challenges faced. Regular updates keep the team aligned and help adjust strategies where necessary, ensuring that everyone remains accountable to the goals they set.
By setting clear SQDP metrics and regularly tracking progress, teams stay focused on their objectives, encourage collaboration, and take collective responsibility for results.
Real-World Success Stories: SQDP in Action
Implementing SQDP boards has led to significant improvements in many organisations across various industries. These real-world success stories highlight how the use of Safety, Quality, Delivery, and People metrics on SQDP boards can drive meaningful change, enhance team performance, and support continuous improvement.
Improving Safety with Proactive Monitoring
In one manufacturing plant, the introduction of an SQDP board focused on safety metrics helped drastically reduce workplace accidents. By clearly tracking safety incidents and highlighting them on the board, teams became more aware of potential risks and acted proactively to prevent accidents. The result was a significant drop in injuries, creating a safer work environment for everyone.
Enhancing Quality Control and Reducing Defects
In the electronics industry, a company used their SQDP board to track quality control metrics, specifically focusing on product defects. By consistently reviewing quality data in real-time, the team was able to identify issues early and make adjustments before products left the production line. This improved quality and reduced costly defects, leading to higher customer satisfaction and fewer returns.
Boosting Delivery and Meeting Deadlines
A service-based company adopted the SQDP framework to manage delivery metrics. By tracking project timelines and delivery schedules, teams could spot delays early and adjust workloads accordingly. This shift helped the company meet client expectations consistently, improve project completion times, and enhance their overall reputation for reliability.
These success stories demonstrate how SQDP boards not only provide clarity and visibility but also drive tangible improvements. By focusing on key performance areas, organisations can enhance efficiency, reduce costs, and ensure continuous progress in all aspects of their operations.
How SQDP Boards Support Continuous Improvement Initiatives
Continuous improvement is essential for businesses aiming to remain competitive, efficient, and adaptable. SQDP boards provide a powerful framework to support these initiatives by offering a clear visual representation of key metrics, allowing teams to identify opportunities for improvement in real time.
Tracking Performance Metrics for Better Insights
SQDP boards focus on four critical areas: Safety, Quality, Delivery, and People. By regularly reviewing these metrics, organisations can gain insights into where improvements are needed. For example, monitoring safety incidents can highlight potential hazards, while tracking delivery timelines can uncover inefficiencies in the process. These insights empower teams to address issues promptly, rather than waiting for problems to escalate.
Driving Accountability Across Teams
The visibility of key metrics on an SQDP board holds teams accountable for their performance. With everyone able to see the results in real time, there is a collective drive to improve. By setting clear, measurable goals for each metric, teams can focus on continuous improvement, whether that’s reducing defects, improving safety standards, or enhancing delivery speeds. Regular reviews ensure that teams stay on track and adjust strategies as needed.
Encouraging Collaboration and Problem-Solving
SQDP boards encourage collaboration by making performance data accessible to all team members. When problems arise, teams can come together to brainstorm solutions, track progress, and implement corrective actions. This collaborative approach fosters a culture of continuous improvement, where everyone is engaged in the process of making incremental, yet impactful, changes.
Overall, SQDP boards are invaluable tools in driving continuous improvement initiatives. They provide the clarity, accountability, and collaboration needed to enhance processes, improve performance, and achieve long-term success.
Aligning Leadership and Frontline Teams with SQDP Boards
For organisations to thrive, it is crucial that leadership and frontline teams are aligned and working towards the same objectives. SQDP boards provide an effective way to bridge this gap, ensuring that both management and employees have a shared understanding of goals, performance metrics, and improvement priorities.
Clear Communication of Goals and Metrics
One of the key benefits of SQDP boards is their ability to clearly communicate critical performance metrics across all levels of the organisation. By displaying key data on Safety, Quality, Delivery, and People, both leadership and frontline teams can easily see where they stand in terms of progress. This transparency fosters a sense of unity, as everyone is working towards common goals, which improves alignment between teams.
Empowering Frontline Teams with Actionable Data
Frontline teams are often the first to identify potential issues in operations. By using an SQDP board, they have access to real-time performance data that allows them to take immediate action. Whether it’s addressing safety concerns, quality issues, or delivery delays, frontline employees can quickly respond to challenges, which helps them feel more empowered and accountable for their contributions.
Enabling Leadership to Drive Strategic Decisions
For leadership, the SQDP board provides a comprehensive overview of performance, allowing them to make informed decisions. Leaders can identify trends, recognise areas for improvement, and allocate resources more effectively. The real-time data also facilitates more productive discussions during meetings, helping to align strategy with operational realities.
In summary, SQDP boards play a pivotal role in aligning leadership and frontline teams by providing transparency, empowering employees, and enabling better decision-making. This alignment leads to more efficient operations, improved performance, and a stronger organisational culture.
Measuring What Matters: Choosing the Right KPIs for Each SQDP Area
To successfully implement an SQDP board, it’s essential to choose the right Key Performance Indicators (KPIs) for each of the four areas: Safety, Quality, Delivery, and People. The right KPIs provide clear, actionable insights that help teams focus on what truly matters and drive continuous improvement across the organisation.
Safety: Prioritising Risk Management
In the Safety area, KPIs should focus on reducing risks and maintaining a safe working environment. Key metrics could include the number of safety incidents, near misses, and time lost due to injuries. Tracking these indicators helps identify hazards, evaluate safety protocols, and ensure that all employees are working in a risk-free environment.
Quality: Maintaining High Standards
Quality KPIs are vital for measuring how well products or services meet established standards. Important metrics could include defect rates, customer complaints, and first-pass yield (the percentage of products made correctly the first time). These KPIs help identify areas for quality improvement and ensure customer satisfaction remains high.
Delivery: Ensuring Timely Performance
Delivery KPIs are crucial for tracking performance in meeting deadlines and satisfying customer expectations. Metrics such as on-time delivery rate, lead times, and order fulfilment accuracy are key indicators. These KPIs ensure that teams stay focused on meeting timelines and improve efficiency in production or service delivery.
People: Fostering Employee Engagement
People-focused KPIs measure employee performance, engagement, and satisfaction. Metrics such as employee turnover rates, absenteeism, and training completion rates can highlight areas where improvements in workforce management are needed. Focusing on these KPIs helps create a motivated, productive, and well-trained team.
In conclusion, selecting the right KPIs for each area of the SQDP board ensures that your organisation is measuring what truly matters. This data-driven approach empowers teams to make informed decisions, enhance performance, and drive sustainable improvements.
How the SQDP Board Works
Visual Representation
The core of the SQDP board lies in its visual nature. Key metrics related to each category are displayed using charts, graphs, color-coded indicators, and other visual aids. This makes it easy for team members to quickly grasp the current performance status at a glance.
Daily Monitoring
The board is typically updated daily, allowing teams to track progress in real-time. This regular monitoring helps to identify potential issues early on and enables prompt corrective actions.
Problem Solving
The SQDP board serves as a central hub for problem-solving discussions. When deviations from targets or unexpected issues arise, team members use the board to analyse the situation, identify root causes, and brainstorm solutions.
Continuous Improvement
The data displayed on the board provides valuable insights for continuous improvement. By analysing trends, identifying patterns, and tracking the effectiveness of implemented solutions, teams can continually refine their processes and enhance overall performance.
Key Benefits of Utilising an SQDP Board
Enhanced Safety: By prominently displaying safety metrics and tracking safety incidents, the board fosters a strong safety culture. It encourages proactive measures to prevent accidents and ensures employee well-being.
Improved Quality: The focus on quality metrics helps teams identify and address quality issues promptly. This leads to reduced defects, improved customer satisfaction, and enhanced product or service quality.
Reduced Costs: By identifying and eliminating waste, inefficiencies, and unnecessary expenses, the SQDP board contributes to significant cost savings.
Increased Productivity: By tracking key performance indicators related to productivity, teams can identify bottlenecks, optimise workflows, and improve overall efficiency.
Improved Delivery: The board helps ensure timely delivery of products or services, meeting customer expectations and maintaining a competitive advantage.
Empowered Workforce: By involving employees in the data collection, analysis, and problem-solving processes, the SQDP board empowers them to take ownership of their work and contribute to continuous improvement.
Enhanced Communication: The visual nature of the board facilitates clear and concise communication within the team. It provides a shared understanding of performance, goals, and challenges.
Beyond the Basics: Customisation and Best Practices
Customisation: The SQDP framework is adaptable. Teams can customise the specific metrics and categories to align with their unique needs and priorities. For example, a customer service team might prioritise "Customer Satisfaction" and "Response Time" under the "Quality" category.
Data Visualisation: Effective data visualisation is crucial for maximising the impact of the SQDP board. Utilise charts, graphs, and color-coding to make the data easily understandable and visually appealing.
Root Cause Analysis: Encourage the use of root cause analysis techniques (e.g., 5 Whys, Fishbone diagram) to delve deeper into the underlying reasons for deviations from targets and implement sustainable corrective actions.
Employee Engagement: Actively involve all team members in the creation, maintenance, and utilisation of the SQDP board. Encourage their input and feedback to ensure that the board remains relevant and effective.
Continuous Improvement Cycles: Regularly review and refine the SQDP board to ensure that it continues to meet the evolving needs of the team and support ongoing improvement efforts.