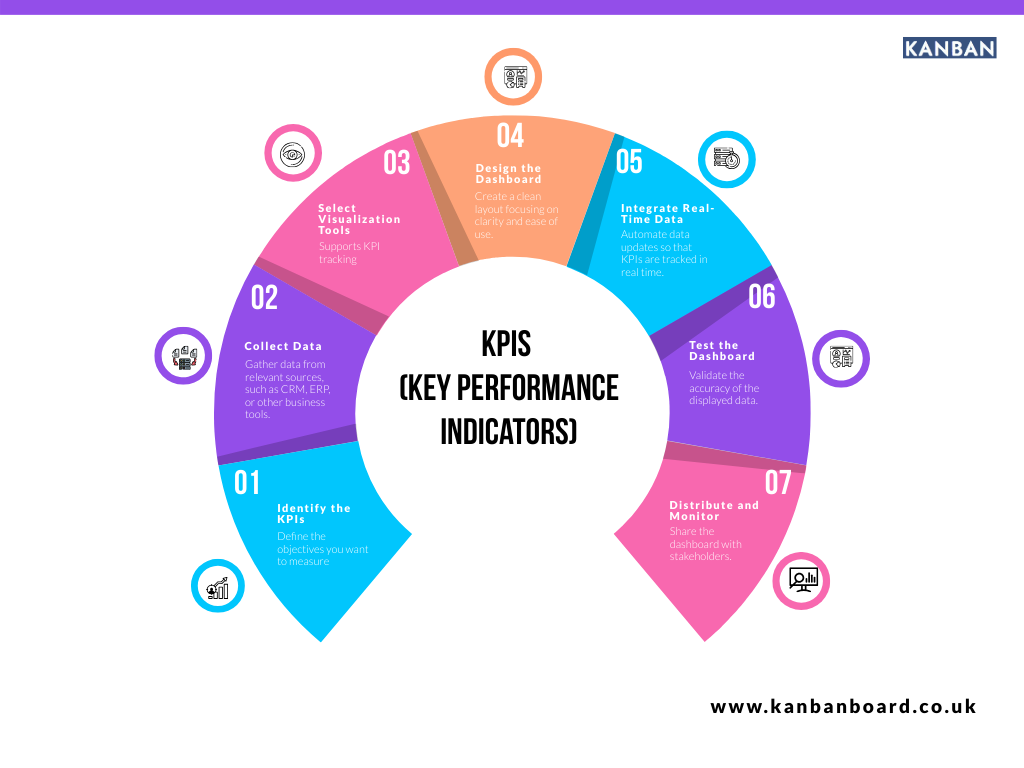
Key Performance Indicators (KPIs) are vital in measuring and monitoring the performance of any business. In the manufacturing sector, where precision, productivity, and efficiency are paramount, having real-time access to critical data is essential. This is where Manufacturing KPI Dashboards come into play. These dashboards provide an overview of the operational health of the manufacturing process, helping organizations to visualize and analyze performance metrics, pinpoint inefficiencies, and make data-driven decisions.

Importance of Manufacturing KPI Dashboards
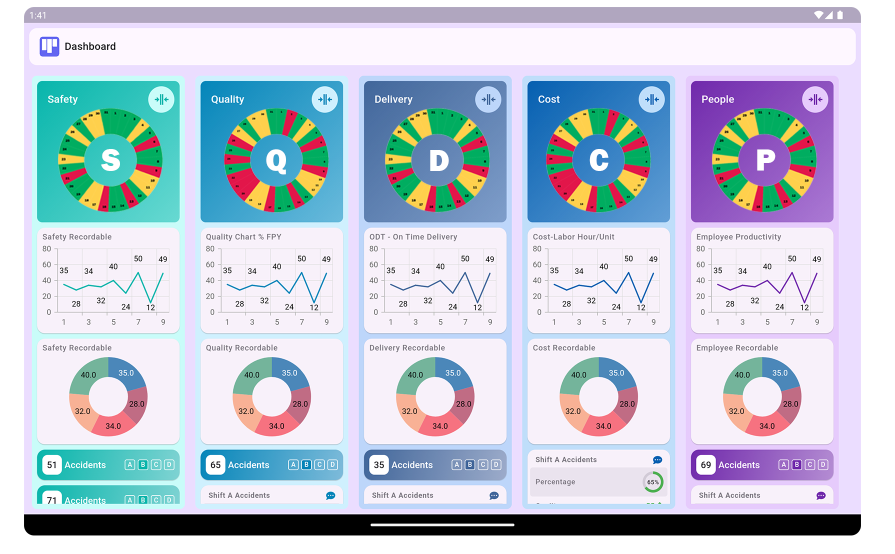
In the highly competitive and complex world of manufacturing, decision-makers require actionable insights to remain agile and responsive. Manufacturing KPI dashboards act as a central hub of information, offering real-time data visualization, historical trend analysis, and predictive analytics capabilities. They allow companies to:
- Enhance Visibility: With a clear, at-a-glance view of production processes, managers can quickly identify areas that need attention, track progress towards goals, and ensure alignment with business objectives.
- Improve Decision-Making: Real-time data enables faster and more accurate decision-making, allowing manufacturers to respond swiftly to changes in production, quality, or inventory levels.
- Boost Efficiency: By identifying bottlenecks, inefficiencies, or deviations from the norm, KPI dashboards allow for timely interventions that can optimize workflows and increase productivity.
- Enhance Quality Control: Quality is a top priority in manufacturing. KPI dashboards help track and manage quality-related metrics such as defect rates, scrap rates, and rework levels to maintain high standards.
- Monitor Financial Performance: Monitoring cost-related metrics, including cost per unit, labor costs, and material wastage, helps manufacturers control their budgets and avoid overruns.
Key Metrics to Track in Manufacturing KPI Dashboards
To maximize the value of a KPI dashboard, manufacturers should carefully select the KPIs that are most relevant to their operational goals. While the specific metrics may vary depending on the industry and type of manufacturing, there are several key areas that are universally important for most manufacturers:

1. Productivity KPIs
Productivity is the backbone of manufacturing performance. It refers to how efficiently resources are being used to produce goods. Common productivity KPIs include:
- Overall Equipment Effectiveness (OEE): OEE measures the efficiency of manufacturing processes by evaluating three key factors—availability, performance, and quality. It is one of the most comprehensive and widely used productivity metrics in the industry.
- Cycle Time: This is the time taken to complete one production cycle, from start to finish. Reducing cycle time leads to greater efficiency and higher output.
- Downtime: Monitoring unplanned downtime helps manufacturers understand how much time equipment is idle due to breakdowns or other disruptions.
2. Quality KPIs
Maintaining high-quality standards is crucial for customer satisfaction and brand reputation. Some of the most critical quality KPIs include:
- Defect Rate: This measures the percentage of products that do not meet quality standards. Lowering the defect rate ensures that fewer products need to be reworked or scrapped.
- First Pass Yield (FPY): FPY measures the percentage of products that pass quality inspections the first time without needing rework. A high FPY indicates effective quality control and production processes.
- Scrap Rate: The scrap rate refers to the percentage of raw materials that are wasted during production. Reducing scrap leads to cost savings and increased profitability.
3. Cost KPIs
Cost control is a critical factor in maintaining profitability in manufacturing. Some key cost-related KPIs include:
- Cost Per Unit: This KPI measures the total cost involved in producing a single unit of a product. It includes raw materials, labor, overhead, and other related costs.
- Material Usage Variance: This metric tracks the difference between the expected and actual usage of materials. High variance can indicate inefficiencies or waste in the production process.
- Labor Utilization: This measures how effectively labor resources are being used. Poor labor utilization can lead to higher costs and lower productivity.
4. Delivery KPIs
Timely delivery is essential for maintaining customer satisfaction and meeting contractual obligations. Delivery KPIs help manufacturers track performance in this area, including:
- On-Time Delivery Rate: This KPI measures the percentage of orders that are delivered on or before the promised date. A high on-time delivery rate reflects efficient production and logistics processes.
- Lead Time: Lead time refers to the total time taken from the moment a customer places an order until the product is delivered. Shorter lead times indicate a more responsive manufacturing process.
5. Safety KPIs
Safety is paramount in manufacturing, not only for protecting workers but also for avoiding costly accidents and downtime. Key safety KPIs include:
- Accident Frequency Rate: This measures the number of accidents that occur over a specified period. A lower accident frequency rate reflects a safer work environment.
- Lost-Time Injury Rate: This tracks the number of injuries that result in workers missing time from work. Reducing this rate can help manufacturers avoid disruptions and maintain productivity.
6. Inventory KPIs
Effective inventory management is critical to minimizing costs and ensuring that production runs smoothly. Important inventory KPIs include:
- Inventory Turnover: This KPI measures how quickly inventory is used up and replenished. Higher turnover rates indicate efficient inventory management.
- Days of Inventory: This tracks the number of days' worth of inventory a manufacturer has on hand. Keeping this number in balance ensures that there is enough stock to meet production demands without overstocking.
How to Choose the Best Manufacturing KPIs for Your Business?
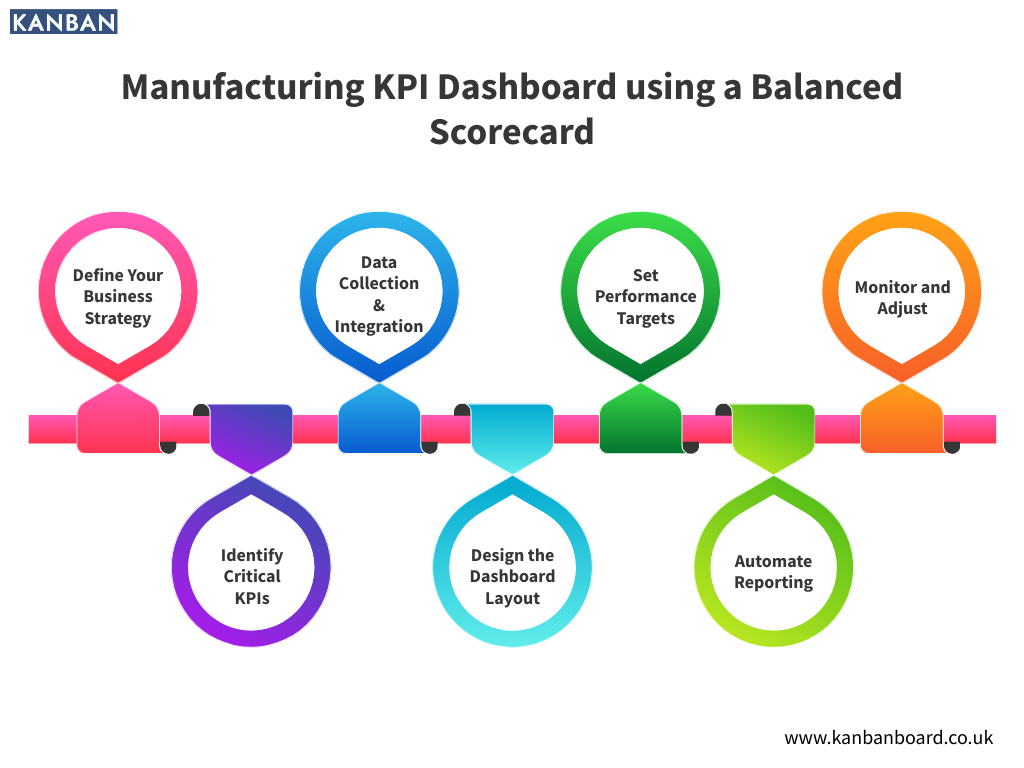
Choosing the best manufacturing KPIs for your business involves identifying the metrics that align with your specific goals and operational challenges. Focus on key areas like productivity, quality, cost, delivery, and safety. Consider factors such as overall equipment effectiveness, defect rates, cost per unit, on-time delivery, and accident frequency rates. Tailor KPIs to your unique processes and priorities, ensuring they provide actionable insights that drive efficiency, reduce waste, and improve overall performance in your manufacturing operations.
Benefits of Integrating Manufacturing KPI Dashboards
1. Real-Time Monitoring and Control
By providing real-time data, dashboards help manufacturers stay on top of their operations, react swiftly to emerging issues, and keep processes running smoothly. Immediate access to critical information allows for quicker decision-making and intervention when needed.
2. Data-Driven Insights
KPI dashboards provide manufacturers with data-driven insights that can be used to optimize processes, reduce waste, and increase overall efficiency. The ability to analyze historical trends also enables predictive maintenance and proactive problem-solving.
3. Enhanced Collaboration
Manufacturing involves collaboration across multiple departments, including production, quality control, finance, and logistics. KPI dashboards help align teams by ensuring that everyone has access to the same data and can work towards common goals.
4. Continuous Improvement
One of the key principles in manufacturing is the concept of continuous improvement, often guided by methodologies such as Lean and Six Sigma. KPI dashboards enable manufacturers to monitor progress toward improvement goals, identify areas for further optimization, and track the success of implemented changes.
Manufacturing KPI Dashboards
1. What is a manufacturing KPI dashboard?
A manufacturing KPI dashboard is a tool that visualizes key performance indicators (KPIs) to monitor and optimize manufacturing operations in real time.

2. Why are KPI dashboards important in manufacturing?
KPI dashboards provide real-time insights, helping manufacturers track performance, identify inefficiencies, and make data-driven decisions to improve productivity and quality.
3. What are the key metrics tracked in a manufacturing KPI dashboard?
Common metrics include overall equipment effectiveness (OEE), cycle time, defect rate, cost per unit, and on-time delivery.
4. How do KPI dashboards improve manufacturing efficiency?
By providing real-time data, dashboards help identify bottlenecks, downtime, and inefficiencies, allowing managers to address issues quickly and enhance workflow efficiency.
5. Can KPI dashboards be customized?
Yes, KPI dashboards can be customized to track metrics specific to your business needs, goals, and industry standards.
6. What is Overall Equipment Effectiveness (OEE) in a KPI dashboard?
OEE is a comprehensive metric that measures equipment efficiency by assessing availability, performance, and quality.
7. How do KPI dashboards support quality control?
They track metrics like defect rates, scrap rates, and first pass yield, allowing for continuous monitoring and improvement of product quality.
8. How do KPI dashboards help in cost management?
Dashboards monitor cost-related KPIs like cost per unit, material usage variance, and labor utilization, helping manufacturers control expenses and avoid overruns.
9. What is the role of safety KPIs in manufacturing dashboards?
Safety KPIs, such as accident frequency and lost-time injury rates, help manufacturers ensure a safe working environment and minimize disruptions.
10. How does a KPI dashboard improve decision-making?
Real-time data enables faster, more informed decisions, allowing manufacturers to respond promptly to production challenges or changes in demand.
11. What types of delivery KPIs are included in a manufacturing dashboard?
Delivery KPIs include on-time delivery rate and lead time, which help manufacturers track and improve the timeliness of their order fulfillment.
12. How do manufacturing dashboards enhance collaboration?
By providing centralized data accessible to all teams, dashboards ensure that production, quality control, and logistics departments are aligned with shared goals.
13. Can historical data be analyzed in a manufacturing KPI dashboard?
Yes, dashboards can store and display historical data, allowing manufacturers to analyze trends and forecast future performance.
14. How do KPI dashboards support continuous improvement in manufacturing?
By tracking performance trends and identifying areas for improvement, KPI dashboards enable manufacturers to implement continuous improvement practices like Lean or Six Sigma.
15. How frequently should a manufacturing KPI dashboard be updated?
Ideally, dashboards should be updated in real time or at least daily to ensure timely and accurate monitoring of operations.