Best Digital Balanced Scorecard Software
Discover powerful Balanced Scorecard Software to align business goals, track KPIs, and drive strategic execution. Easy Integration, Real-time Dashboards, and Performance Insights.


Reach your strategic goals with Balanced Scorecard software
Used by top organisations Global, Balanced Scorecard software enables you to automate your balanced scorecard, track and manage performance metrics across your organisation, use strategy maps to communicate your strategic goals and objectives, link your strategy with strategic initiatives and KPIs, promote a culture of performance, and drive strategy execution with measurable business outcomes.
Book Free Demo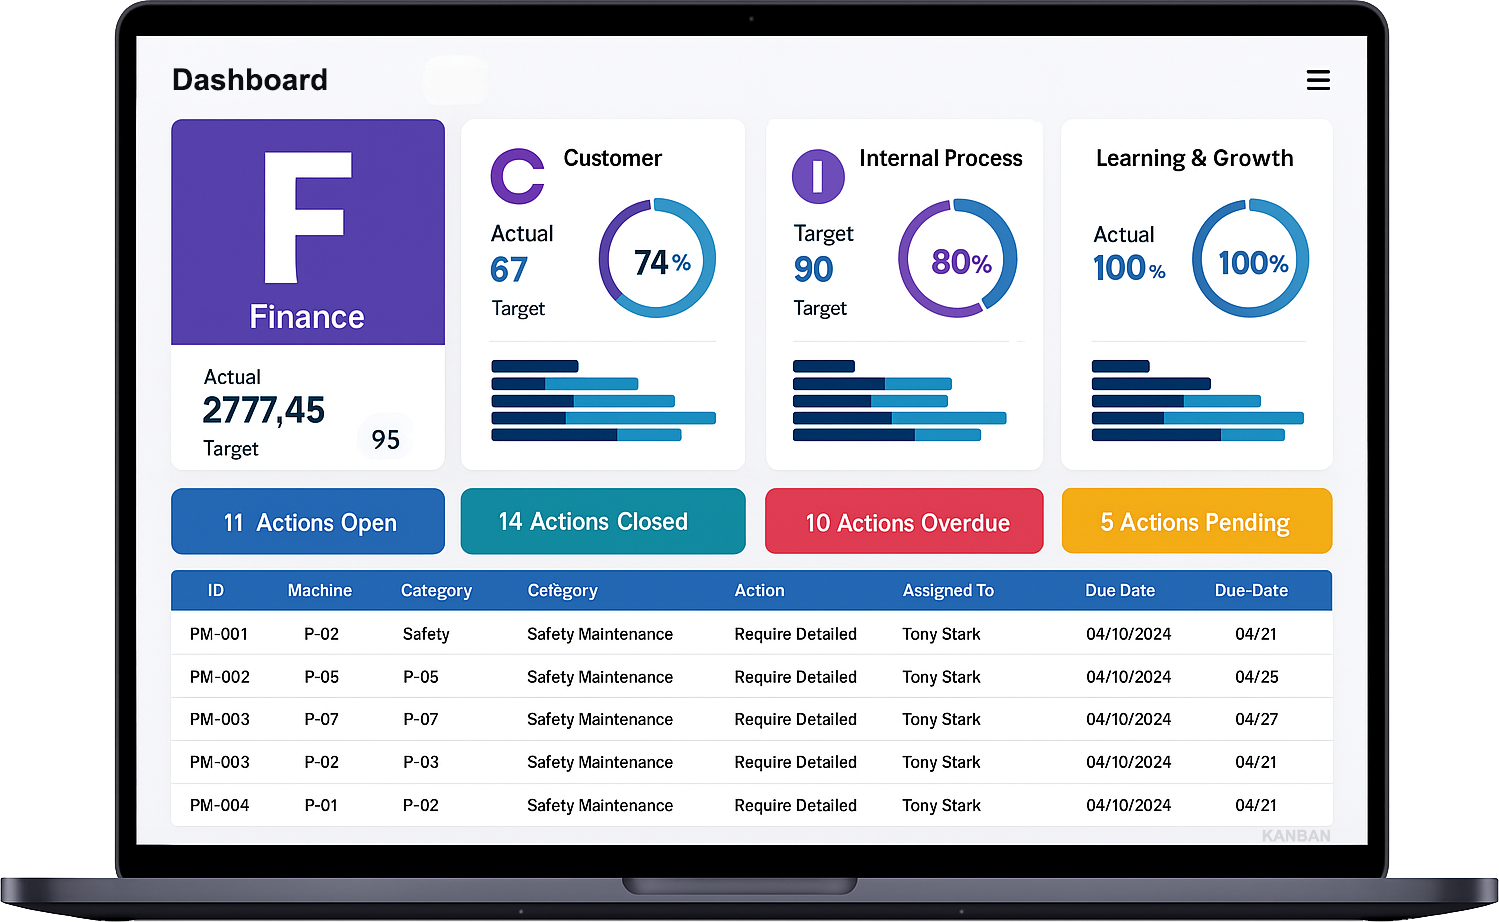
Strategy Map
What is a Strategy Map?
A strategy map is a visual diagram that illustrates the logical, cause-and-effect relationships between strategic objectives, represented as ovals. As a core component of the Balanced Scorecard methodology, it serves as a powerful tool for effectively communicating how an organisation creates value.
How Does Strategy Mapping Help an Organisation?
Strategy mapping helps organisations by visually illustrating their strategic objectives, initiatives, and targets, along with the measures used to assess performance and the linkages between them, fostering a shared understanding and alignment across the organisation.
Book Free Demo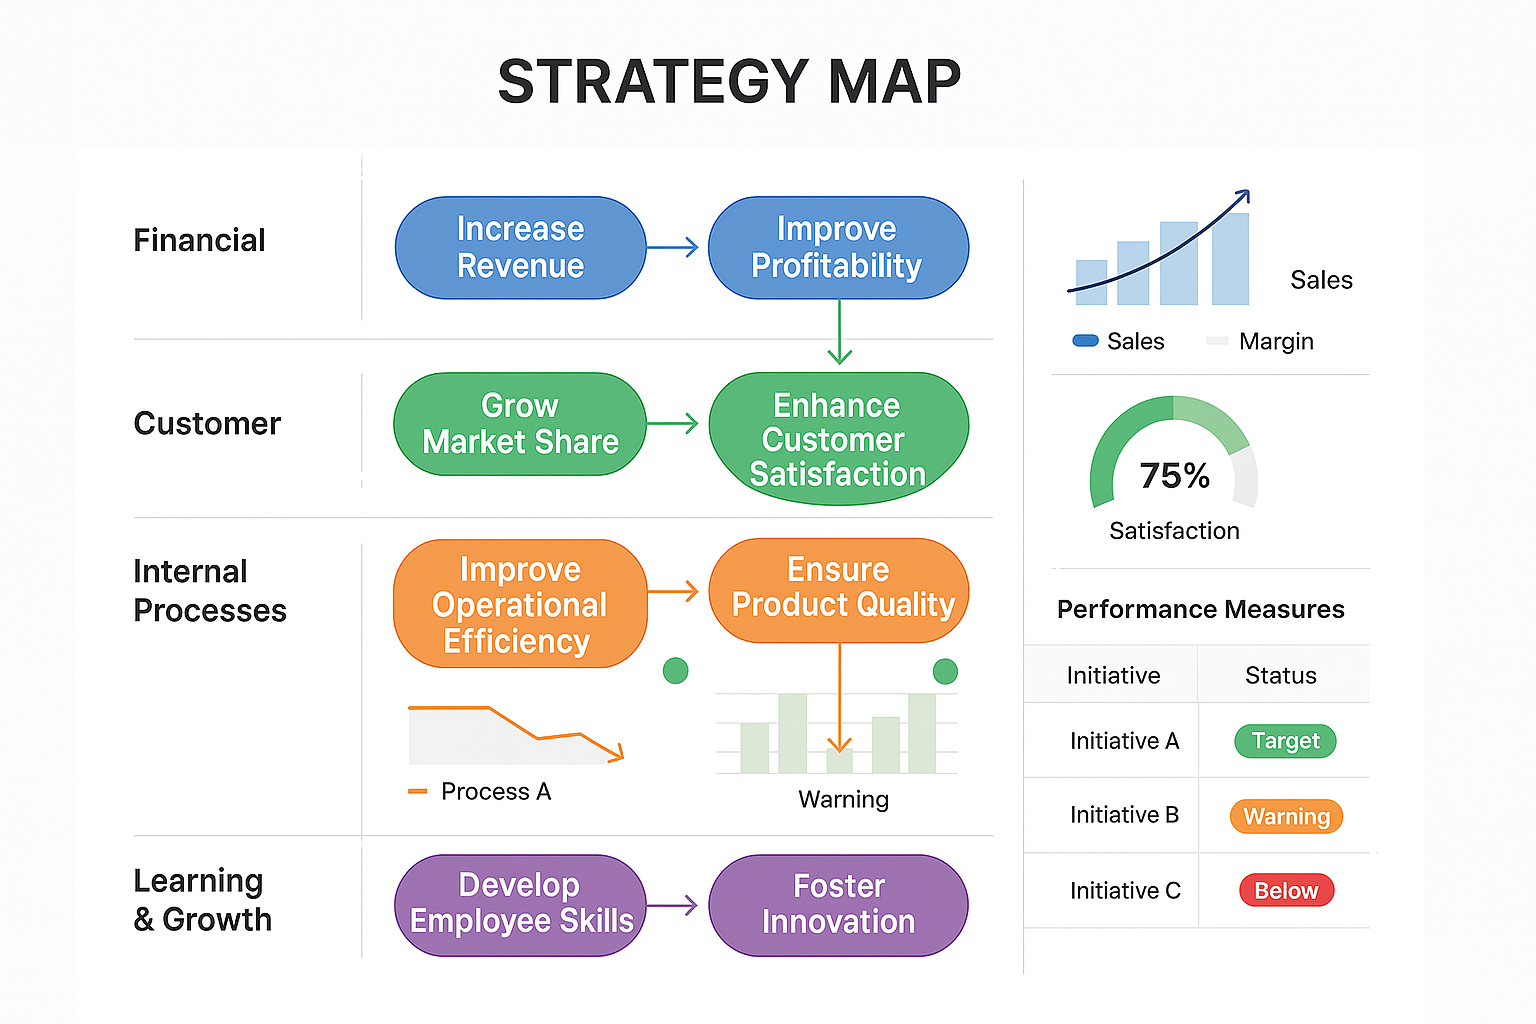
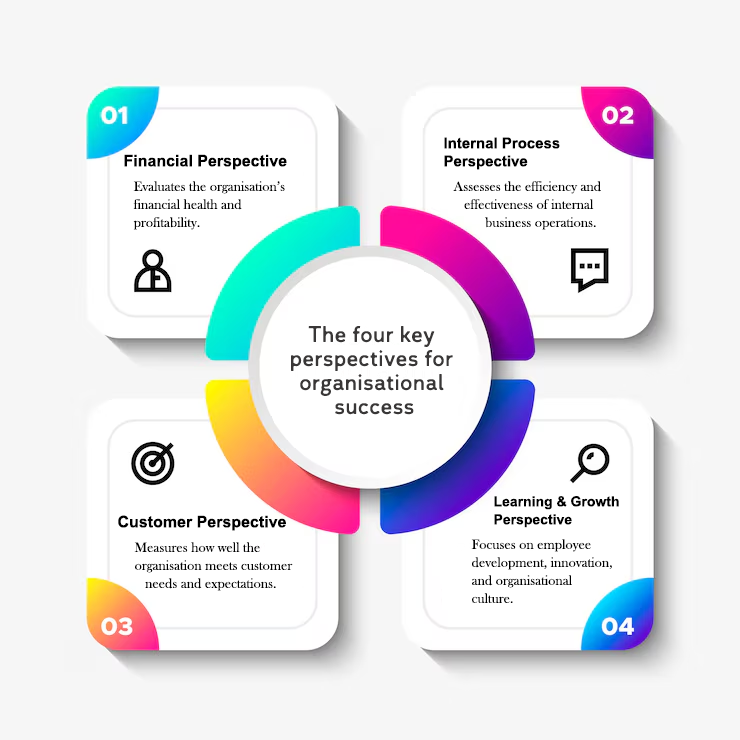
Balanced Scorecard: The Four Key Perspectives for Organisational Success
- Financial: Balanced Scorecard evaluates financial objectives that influence the organisation's overall performance.
- Customer: Analyses key metrics that matter most to customers, enhancing satisfaction and loyalty.
- Internal Process: Assesses business operations to ensure efficiency, effectiveness, and continuous improvement.
- Learning and Growth: Focuses on developing employee skills and capabilities to drive organisational success.
How to Benefit from the Balanced Scorecard (BSC) in Organisations
The Digital Balanced Scorecard provides a comprehensive view of organisational strategies, visually tracking progress and identifying the current status of strategy execution.
- Better Strategic Planning: Aligns business goals with actionable strategies.
- Improved Strategy Communication & Execution: Ensures clarity and accountability across teams.
- KPIs Analysis: Tracks performance using measurable indicators for informed decision-making.
- Better Organisational Alignment: Connects departments to overarching business objectives.
- Better Process Alignment: Streamlines operations for greater efficiency and effectiveness.
Digital Balanced Scorecard Features
- Real-Time Performance Monitoring: Track key metrics and strategic goals in real time.
- Customisable Dashboards: Visualise data with tailored reports and insights.
- Automated KPI Tracking: Streamline performance measurement with automated updates.
- Strategic Goal Alignment: Ensure objectives are aligned across teams and departments.
- Seamless Data Integration: Connect with ERP, CRM, and other business systems.
- Collaboration & Accessibility: Enable cloud-based access for teamwork and transparency.
- Advanced Analytics & Reporting: Leverage AI-driven insights for better decision-making.
SQCDP Visual Management Boards
SQCDP Visual Management Boards are powerful tools used to enhance operational efficiency and drive continuous improvement in organisations. SQCDP stands for Safety, Quality, Cost, Delivery, and People, and visual management boards focused on this framework help teams monitor and manage these critical aspects in a clear and organised manner. By displaying key metrics, targets, and progress visually, these boards provide a real-time snapshot of performance, making it easier for teams to identify issues, track progress, and align their efforts with strategic goals.
These boards typically feature sections dedicated to each SQCDP element, such as safety incidents, quality metrics, cost analysis, delivery schedules, and employee engagement. The visual format enables quick updates and reviews, fostering transparency and accountability across the team. Regular use of SQCDP visual management boards promotes a proactive approach to problem-solving and decision-making, ensuring that all team members are informed and engaged in achieving operational excellence and continuous improvement.
Book Free Demo
Action Plan Status: Balanced Scorecard
An action plan is a step-by-step strategy for achieving a specific goal or objective. It outlines the actions to be taken, the resources needed, the timeline, and who is responsible for each task.
Action plans can be used for companies to manage initiatives and outline the steps needed to achieve larger goals.
Book Free Demo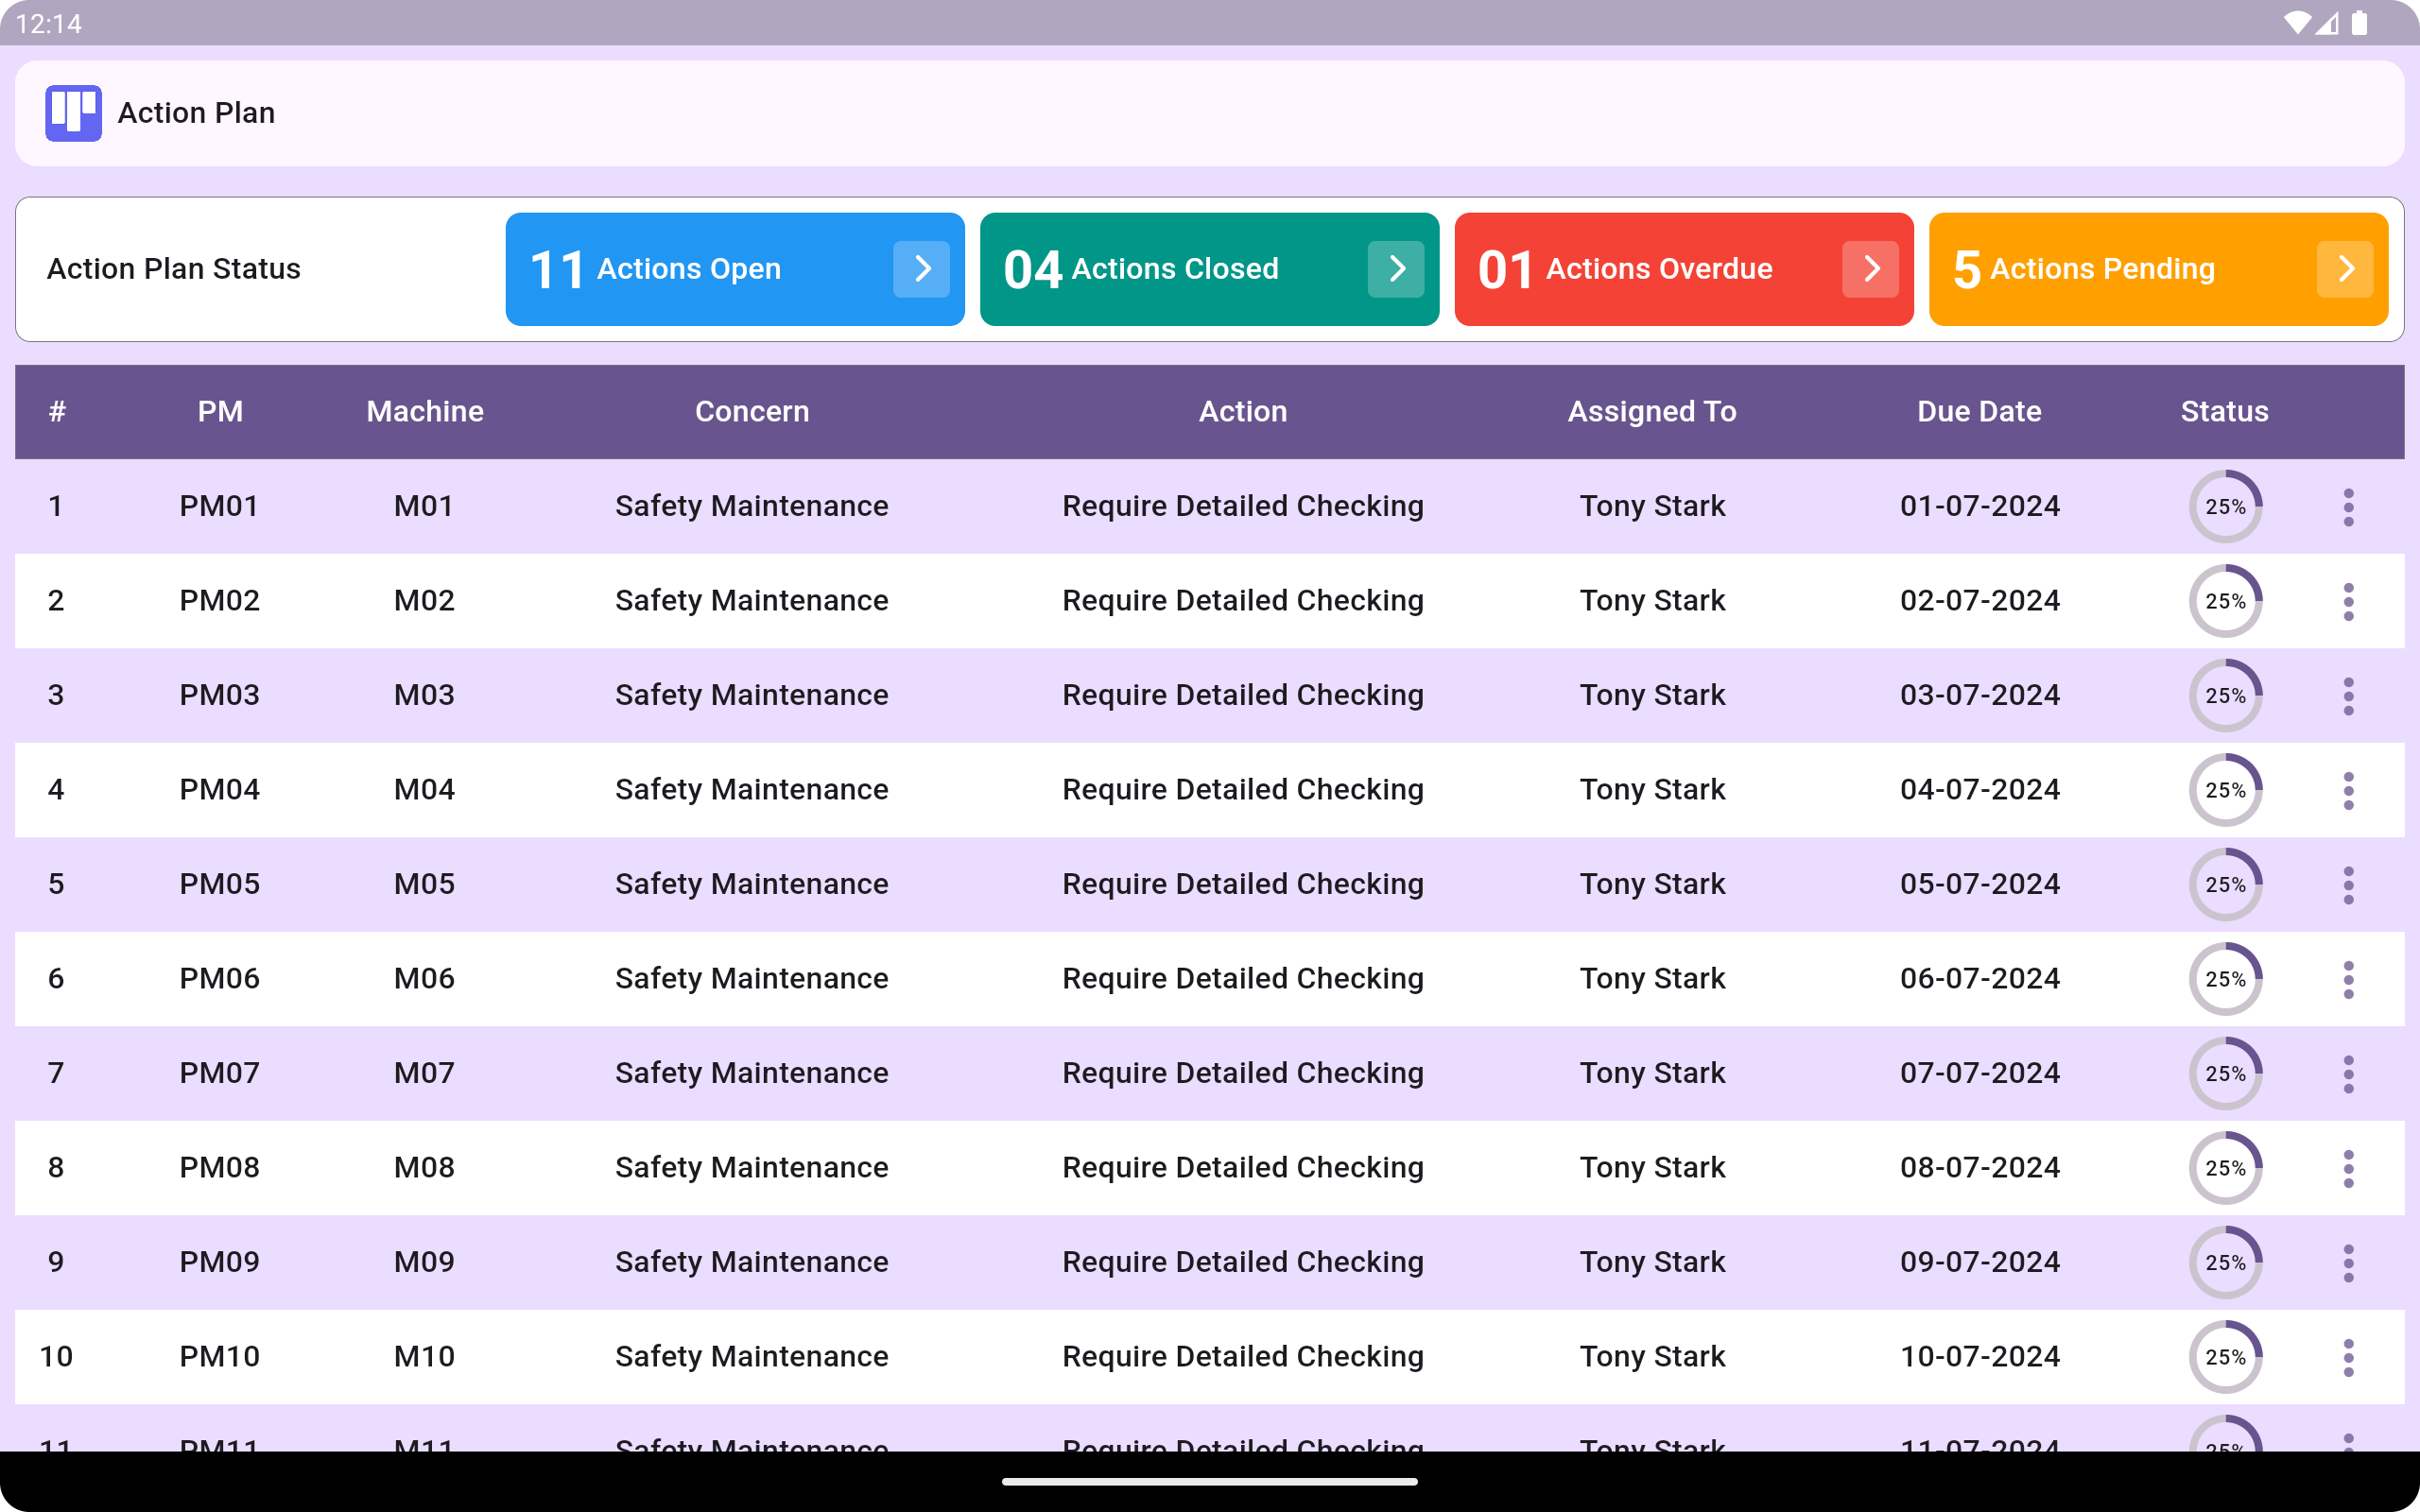
Gantt chart
A Gantt chart is a bar chart that shows a project's schedule, including the start and end dates, duration, and task descriptions. It can also show the relationships between activities and the current schedule status.
They illustrate the start and end dates of projects, key milestones, and dependencies. By integrating Gantt charts with Balanced Scorecard, organisations can better track progress toward strategic goals and ensure timely execution.
Book Free Demo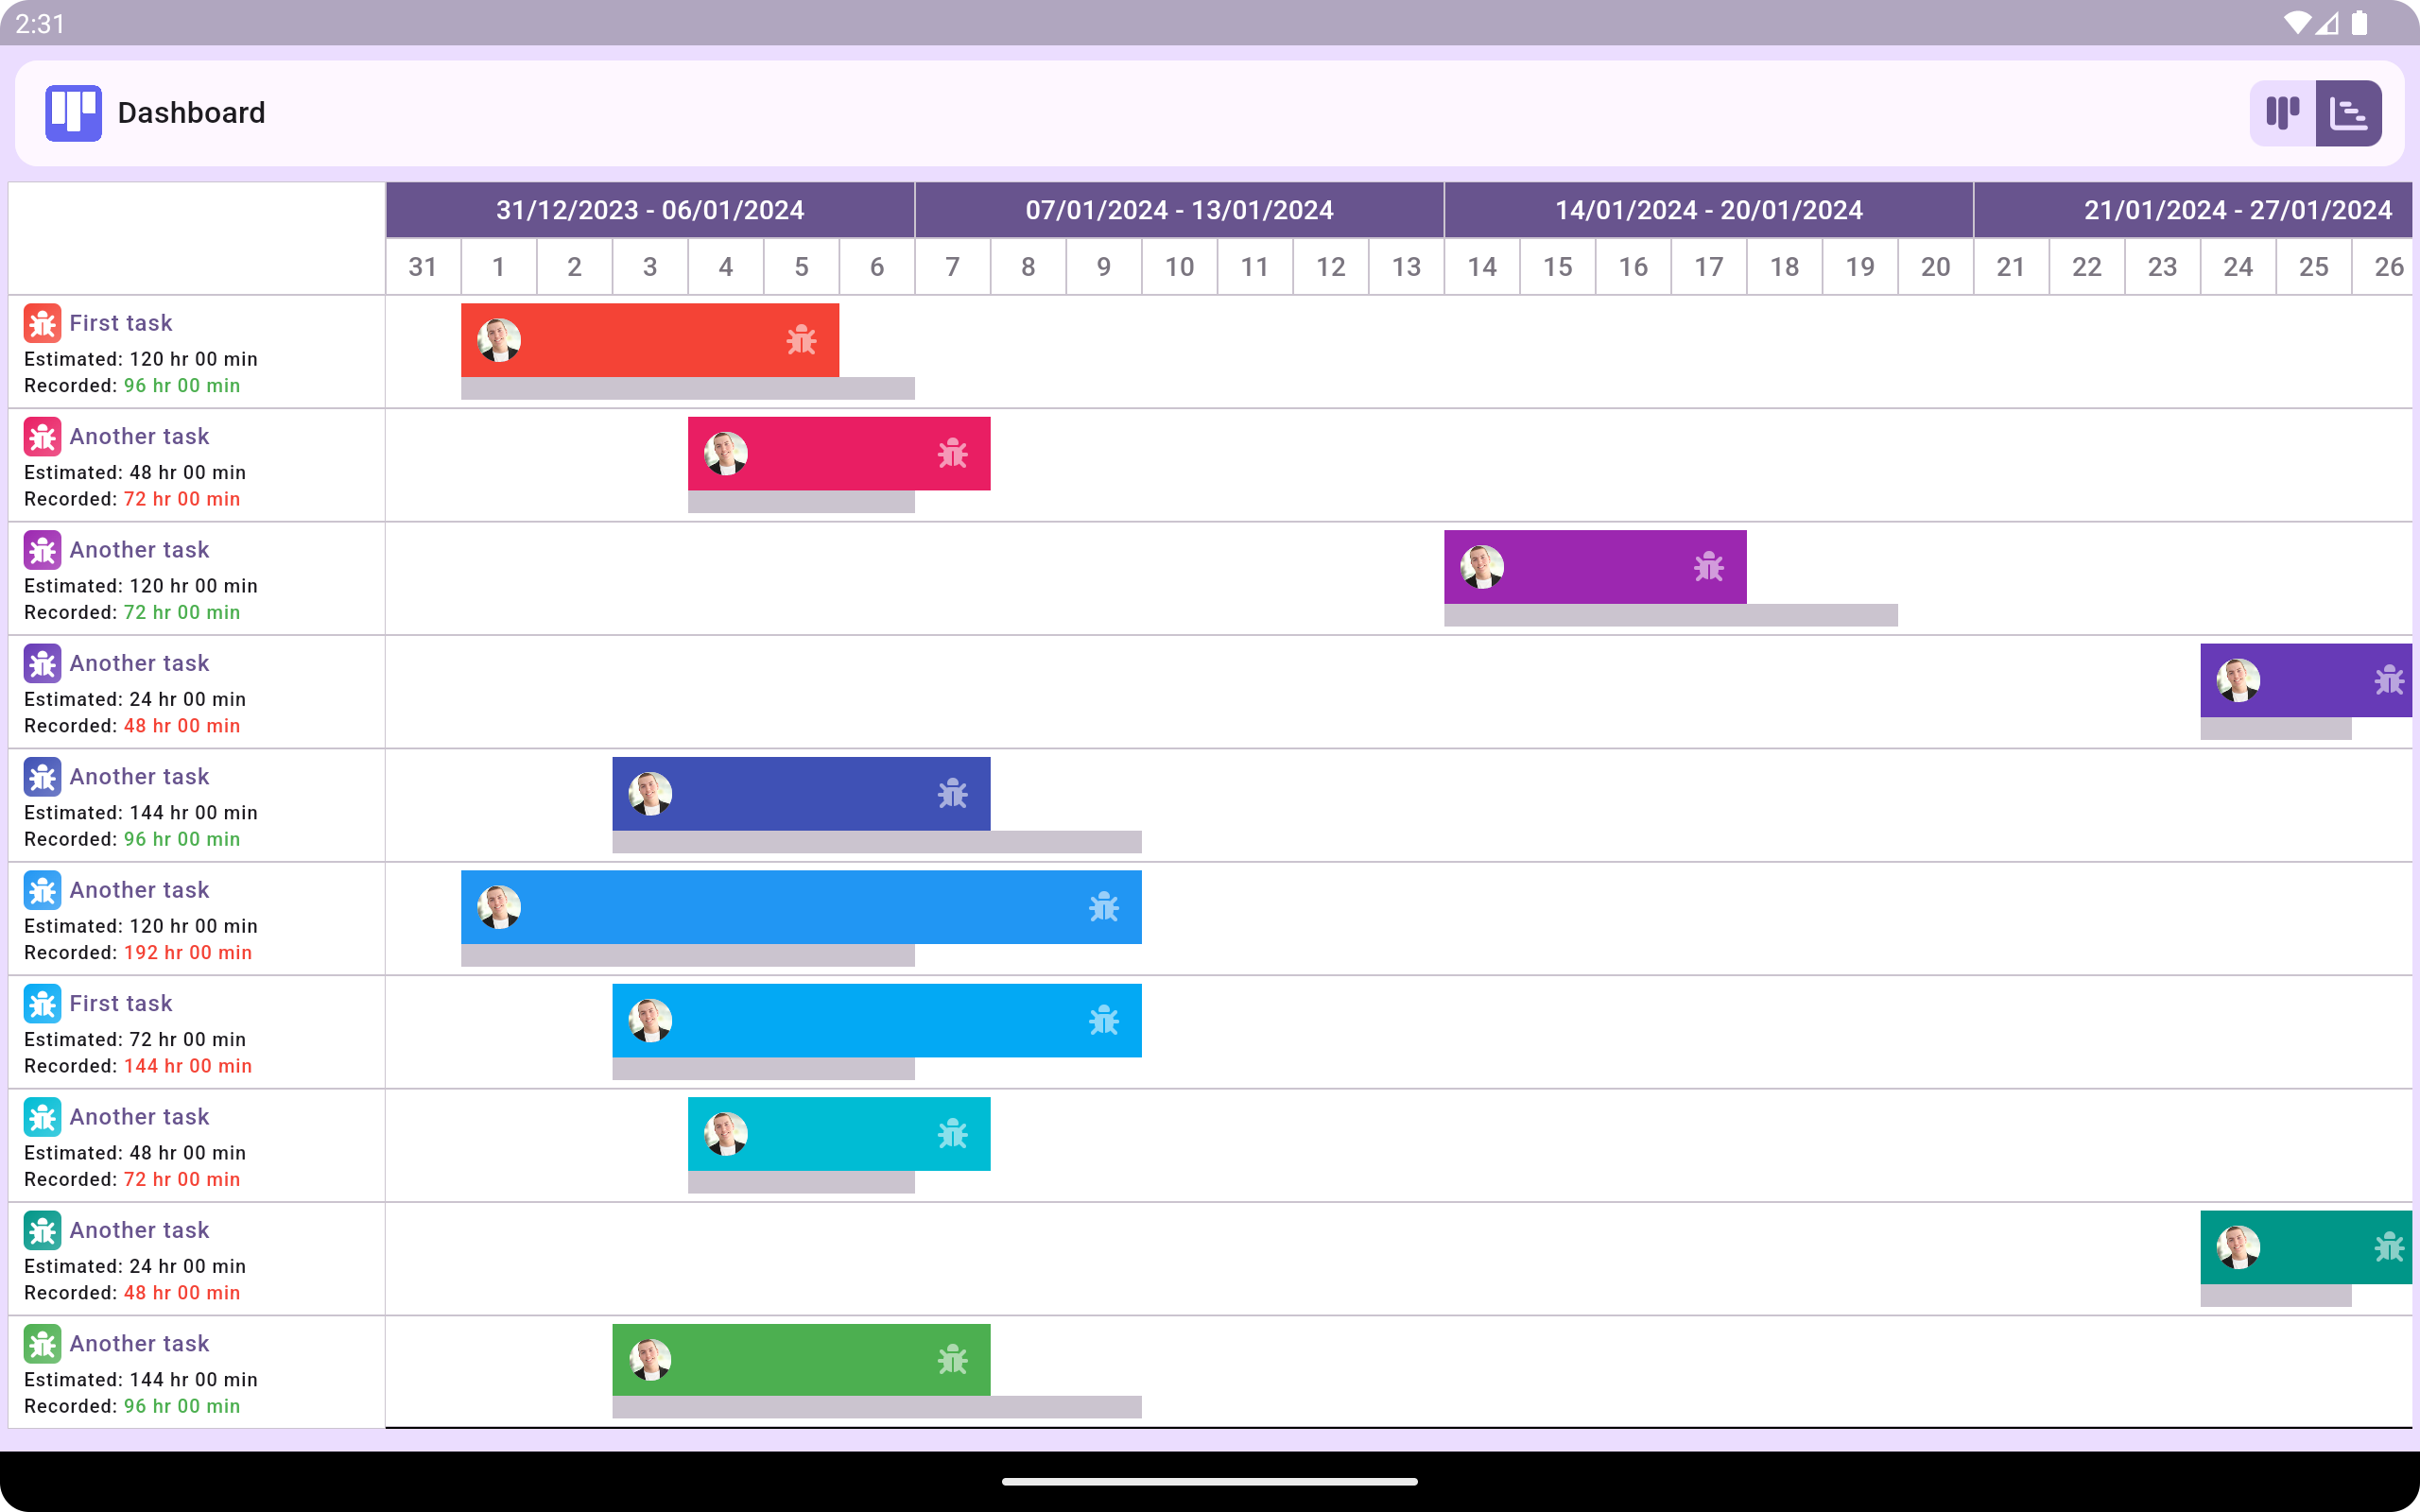
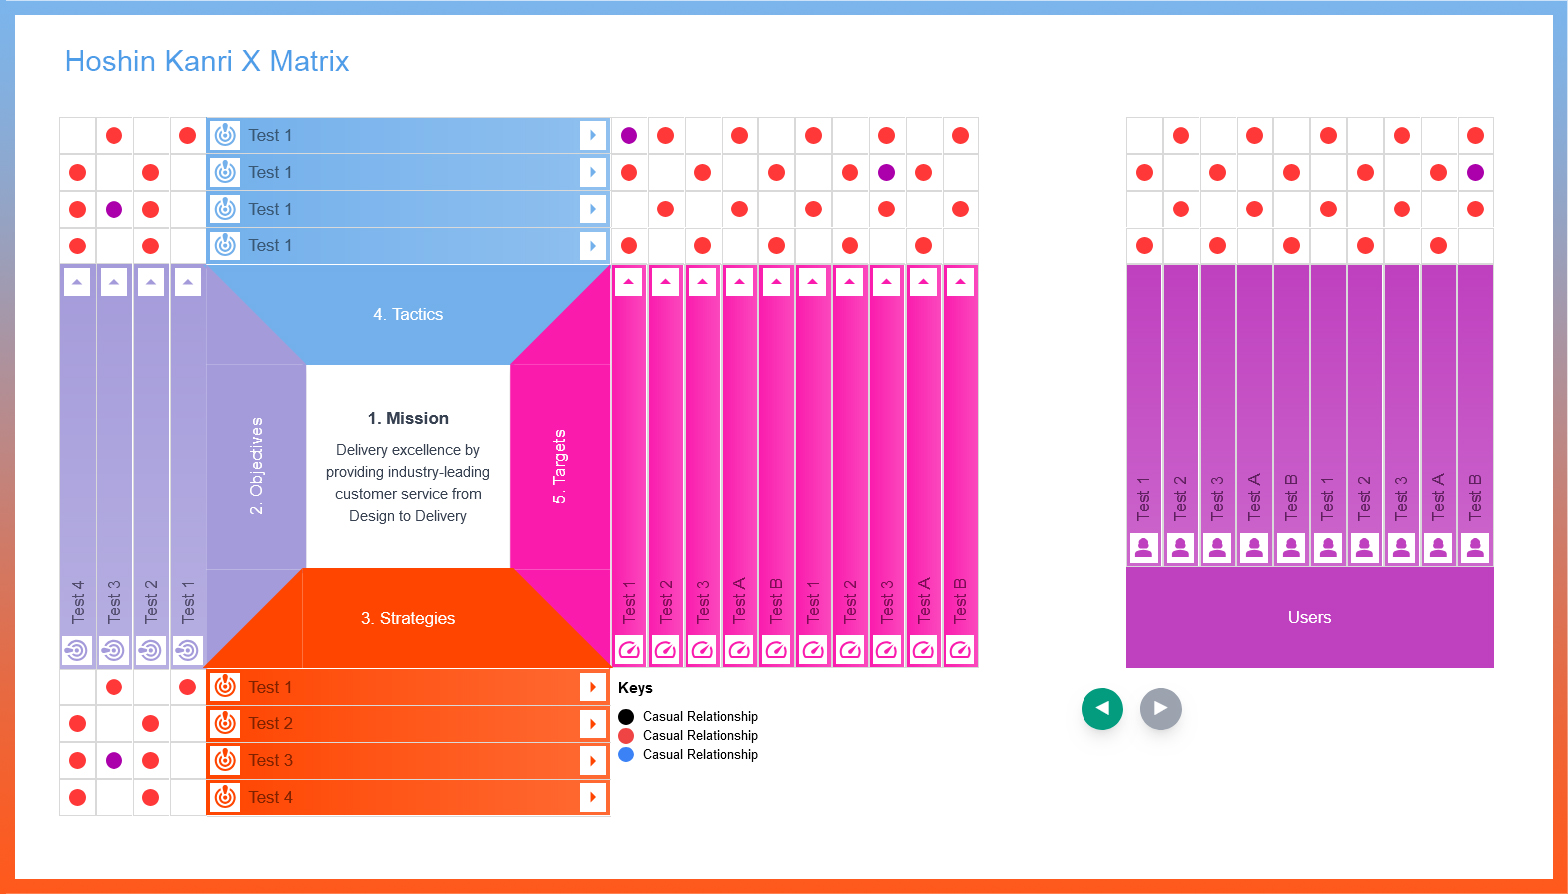
Hoshin Kanri X Matrix for Strategic Planning
The Hoshin Kanri X matrix is a strategic planning tool designed to help organisations align their long-term goals with day-to-day operations. It effectively visualises the relationship between strategic objectives, necessary breakthroughs, annual objectives, and improvement priorities.The X-matrix has four quadrants that represent the organisation's business strategy:
- Top-level priorities: Located in the north quadrant
- Metrics to improve: Located in the east quadrant
- Breakthrough goals: Located in the south quadrant
- Annual objectives: Located in the west quadrant
Components of the Hoshin Kanri X Matrix for Strategic Planning
- Strategic Objectives (Top Side of the X): These represent the high-level, long-term goals of the organisation. They are derived from the company's vision and mission statements and guide overall strategic direction.
- Annual Objectives (Left Side of the X): These are specific, measurable goals set for the current year that support the broader strategic objectives. They are more actionable and provide a clear focus for what needs to be achieved in the short term.
- Key Performance Indicators (Right Side of the X): KPIs are quantifiable metrics used to track the progress of the annual objectives. They help in measuring the success of the strategies and provide insight into performance gaps that may need attention.
- Action Plans (Bottom Side of the X): These outline the specific projects, initiatives, or tasks required to achieve the annual objectives. Each action plan includes deadlines, resources, and the people responsible for execution.
- Interrelationships (Center of the X): The center of the matrix shows the connections between strategic objectives, annual objectives, KPIs, and action plans. This helps to ensure that all actions and measurements are aligned with the long-term goals of the organisation.
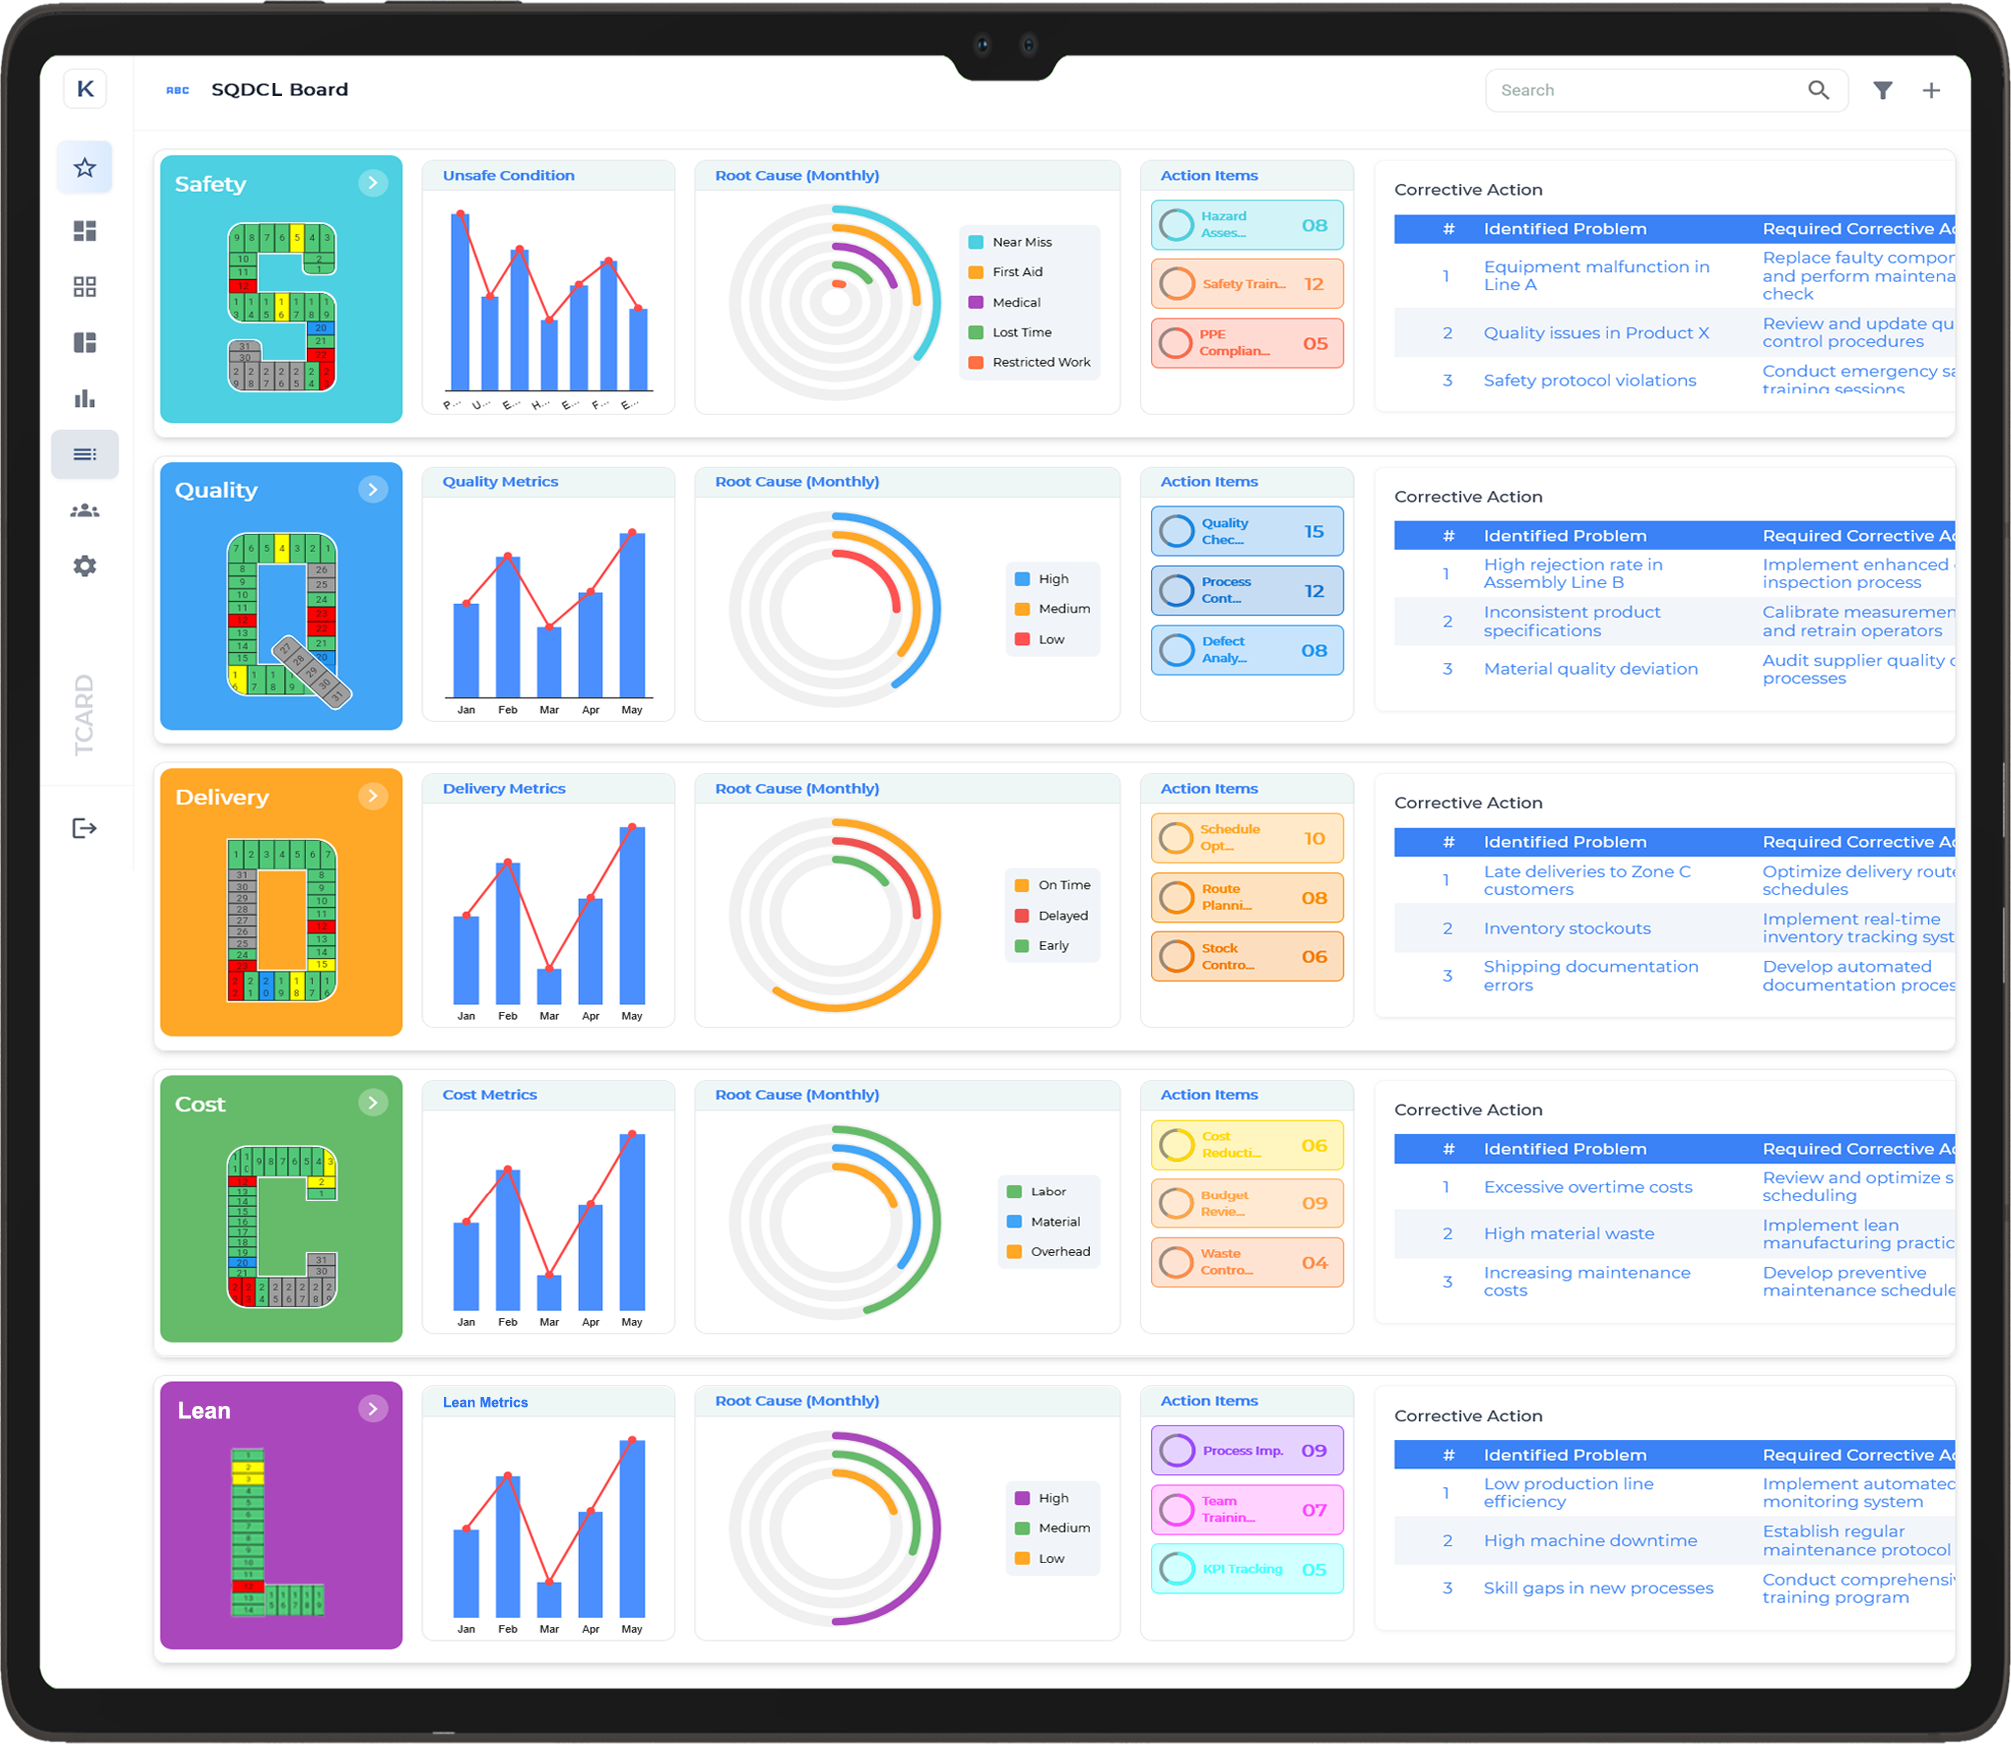
SQCDL Visual Management Boards
SQCDL (Safety, Quality, Cost, Delivery, and Logistics) Visual Management Boards are structured tools used in lean manufacturing and operational excellence initiatives to monitor and improve key performance areas. These boards provide real-time visibility into critical metrics, helping teams track progress, identify bottlenecks, and drive continuous improvement.
Key Features of SQCDL Visual Management Boards:
- Safety (S): Tracks workplace safety incidents, near misses, and compliance with safety protocols.
- Quality (Q): Monitors defect rates, customer complaints, and process deviations.
- Cost (C): Displays cost-related metrics such as waste reduction, budget adherence, and efficiency gains.
- Delivery (D): Focuses on on-time delivery performance, lead times, and production flow.
- Logistics (L): Oversees inventory levels, material flow, and supply chain efficiency.
Benefits:
- Enhances transparency across teams.
- Encourages data-driven decision-making.
- Supports quick issue resolution through visual indicators.
- Fosters a culture of accountability and continuous improvement.
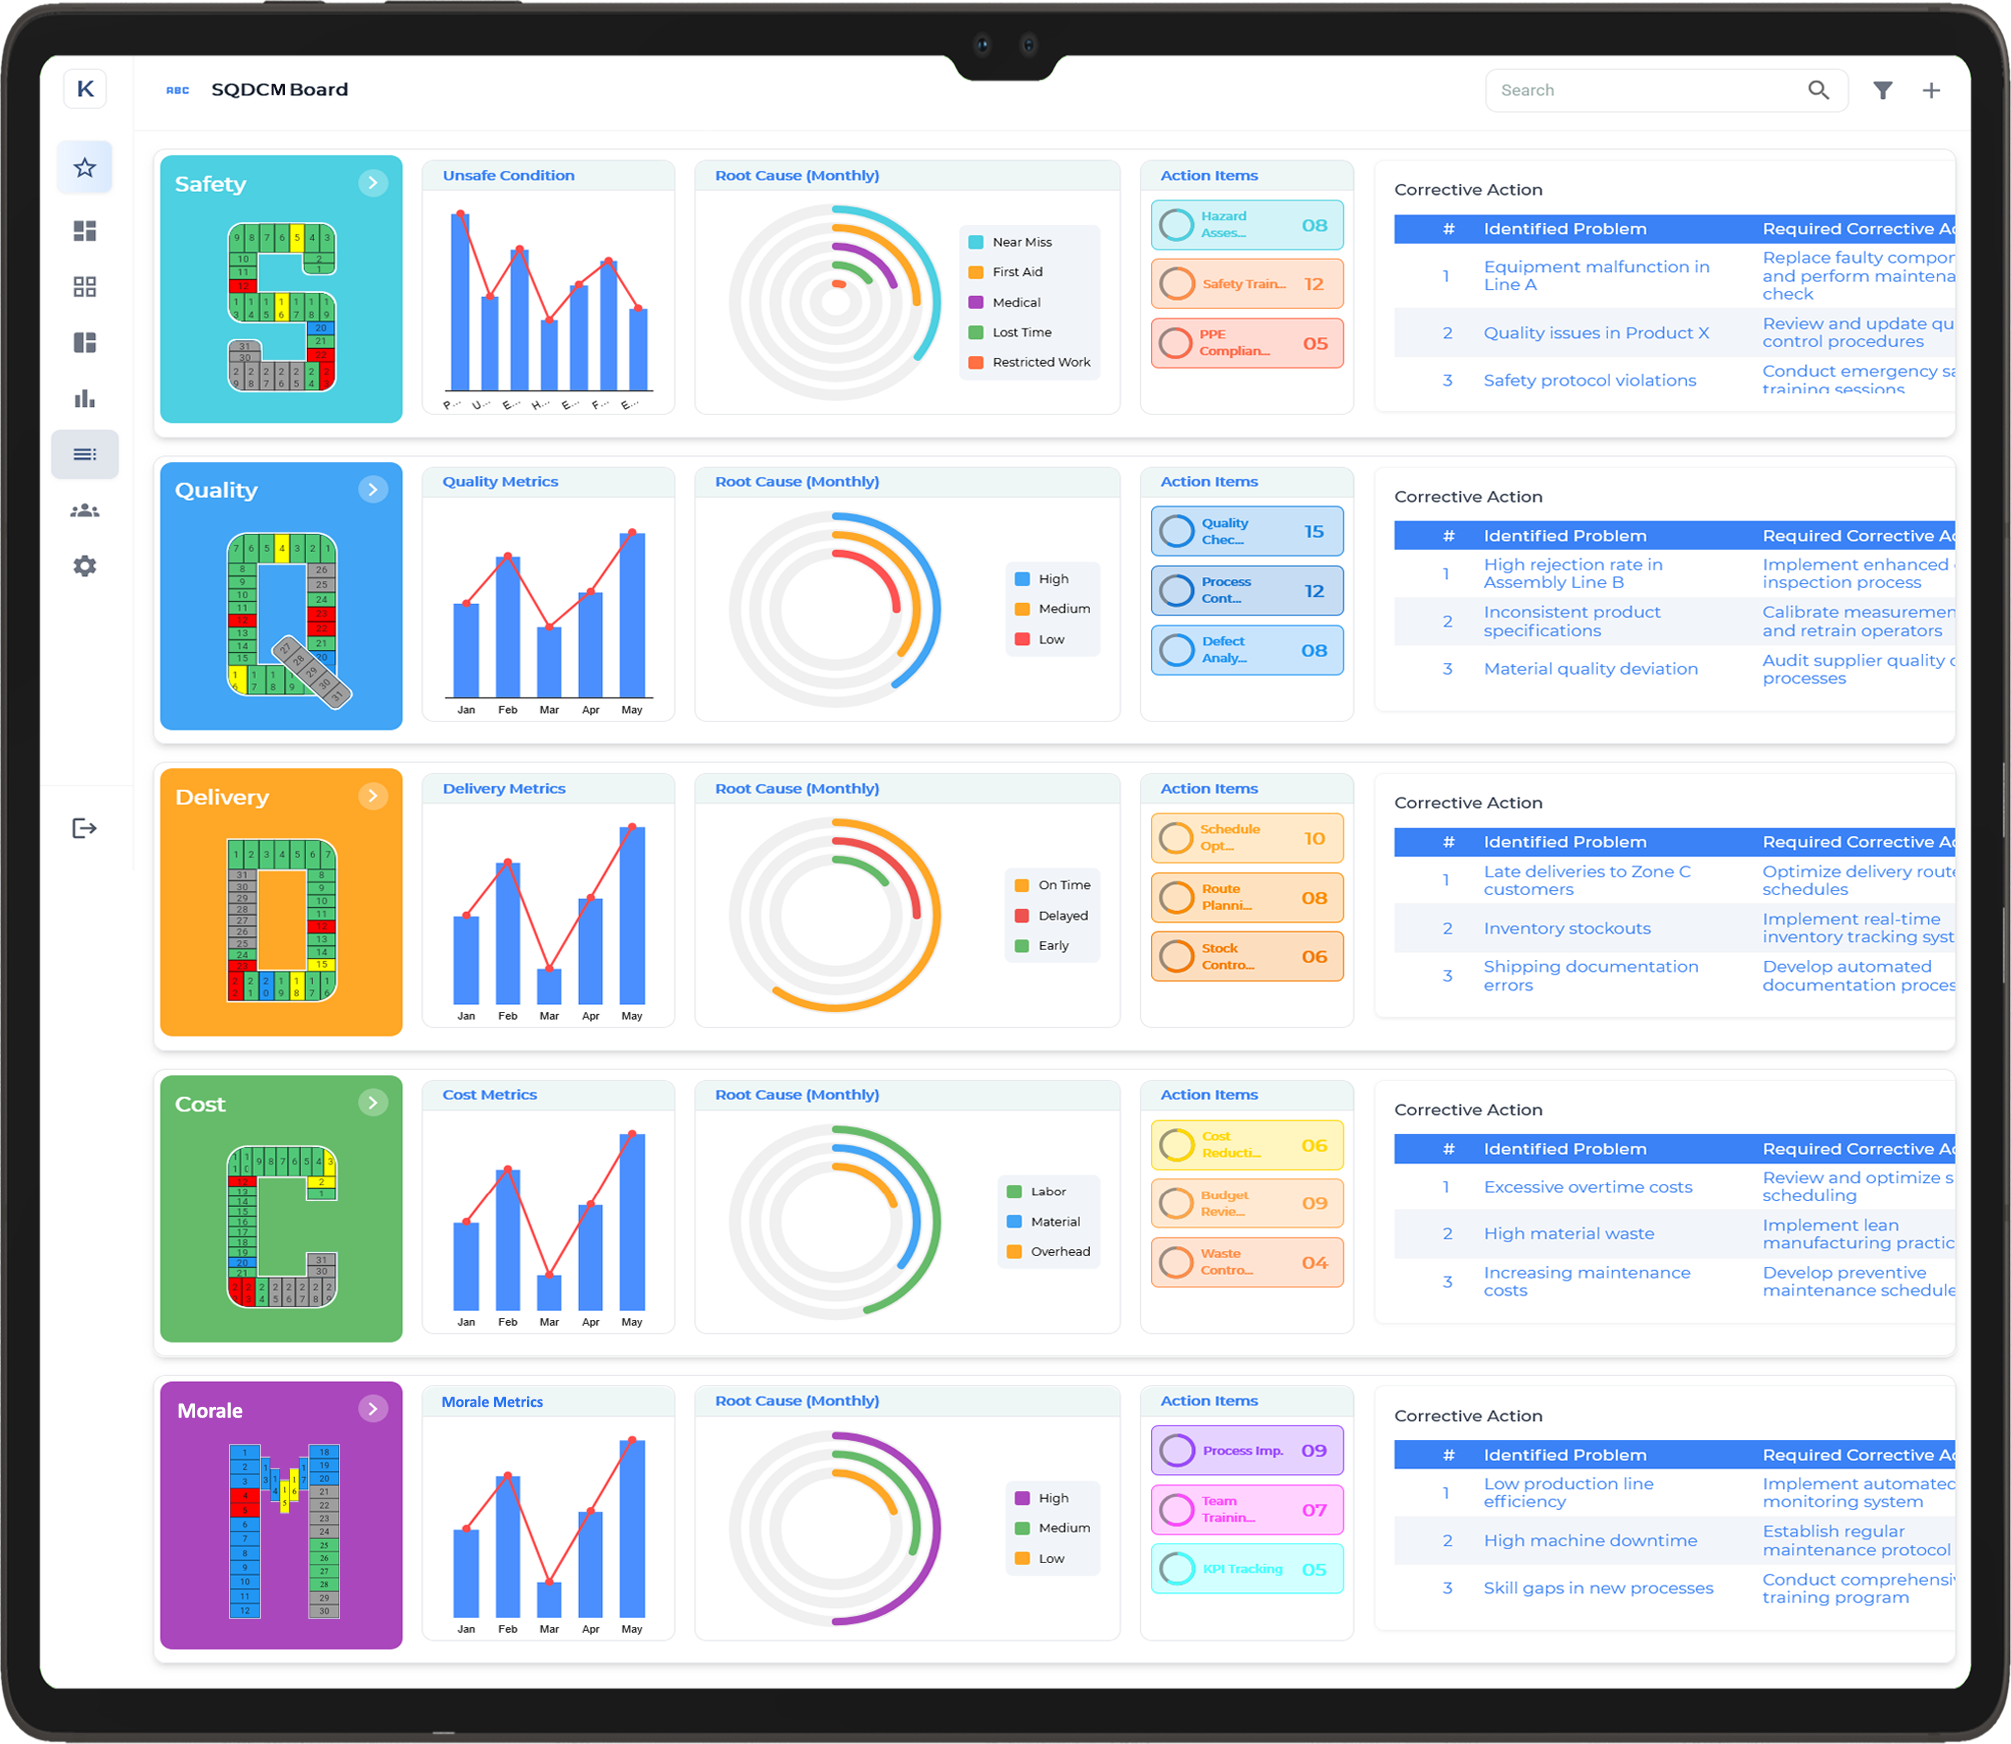
SQDCM Visual Management Boards
SQDCM (Safety, Quality, Delivery, Cost, and Morale) Visual Management Boards are structured tools designed to monitor and improve key performance areas in lean manufacturing and operational processes. These boards provide real-time visibility into critical metrics, allowing teams to track performance, identify issues, and drive continuous improvement.
Key Features of SQDCM Visual Management Boards:
- Safety (S): Tracks workplace safety incidents, near misses, and adherence to safety protocols.
- Quality (Q): Monitors defect rates, customer complaints, and process consistency.
- Delivery (D): Focuses on on-time delivery, production schedules, and workflow efficiency.
- Cost (C): Displays cost-related metrics, including budget adherence, waste reduction, and resource utilisation.
- Morale (M): Measures employee engagement, absenteeism, and overall workplace satisfaction.
Benefits:
- Provides clear, real-time visibility into performance metrics.
- Promotes data-driven decision-making.
- Enhances accountability and continuous improvement culture.
- Supports quick identification and resolution of operational issues.
SQDIP Visual Management Boards
SQDIP (Safety, Quality, Delivery, Inventory, and Productivity) Visual Management Boards help organisations monitor key performance metrics to drive operational excellence and continuous improvement.
Key Features of SQDIP Visual Management Boards:
- Safety (S): Tracks workplace safety incidents, near misses, and adherence to safety protocols.
- Quality (Q): Monitors defect rates, customer complaints, and process consistency.
- Delivery (D): Focuses on on-time delivery, production schedules, and workflow efficiency.
- Inventory (I): Manages stock levels, material availability, and supply chain performance.
- Productivity (P): Measures output efficiency, resource utilisation, and operational performance.
Benefits:
- Enhances real-time visibility into key performance indicators.
- Supports data-driven decision-making and problem-solving.
- Improves team collaboration and accountability.
- Promotes continuous improvement and operational efficiency.

KPIs, Dashboards, and Analytics
Key Performance Indicators (KPIs)
KPIs are measurable values that help businesses track progress toward their strategic goals. By defining clear KPIs, organisations can monitor performance, identify trends, and make informed decisions.
- Financial KPIs: Revenue growth, profit margins, cost reduction.
- Operational KPIs: Production efficiency, downtime, quality metrics.
- Customer KPIs: Customer satisfaction, retention rate, response time.
- Employee KPIs: Productivity, engagement, training effectiveness.
Dashboards
Dashboards provide a visual representation of performance metrics in real-time. With interactive dashboards, businesses can:
- Monitor KPIs in a single view.
- Customise reports based on business needs.
- Gain actionable insights with real-time data visualisation.
Analytics
Advanced analytics help organisations go beyond tracking to forecast trends, identify risks, and optimise decision-making. AI-powered insights enable:
- Predictive analysis for proactive planning.
- Performance benchmarking against industry standards.
- Automated reporting for efficient data management.
.png)
Employee Performance & Productivity Tracker
An Employee Performance & Productivity Tracker monitors and evaluates individual and team performance, efficiency, skill development, collaboration, and motivation to optimise productivity and growth.
Key Features of the Employee Performance & Productivity Tracker:
- Performance (P): Tracks individual and team performance, goal completion, and key achievements.
- Skill Development (S): Monitors employee growth, training progress, and skill enhancements.
- Efficiency (E): Focuses on task completion rates, time management, and productivity benchmarks.
- Collaboration (C): Measures team collaboration, communication effectiveness, and project outcomes.
- Motivation (M): Evaluates employee engagement, satisfaction, and overall morale.
Benefits:
- Provides real-time insights into employee performance and productivity.
- Enables data-driven decisions to optimise team performance and growth.
- Enhances collaboration and accountability across teams.
- Supports continuous improvement through actionable feedback and progress tracking.
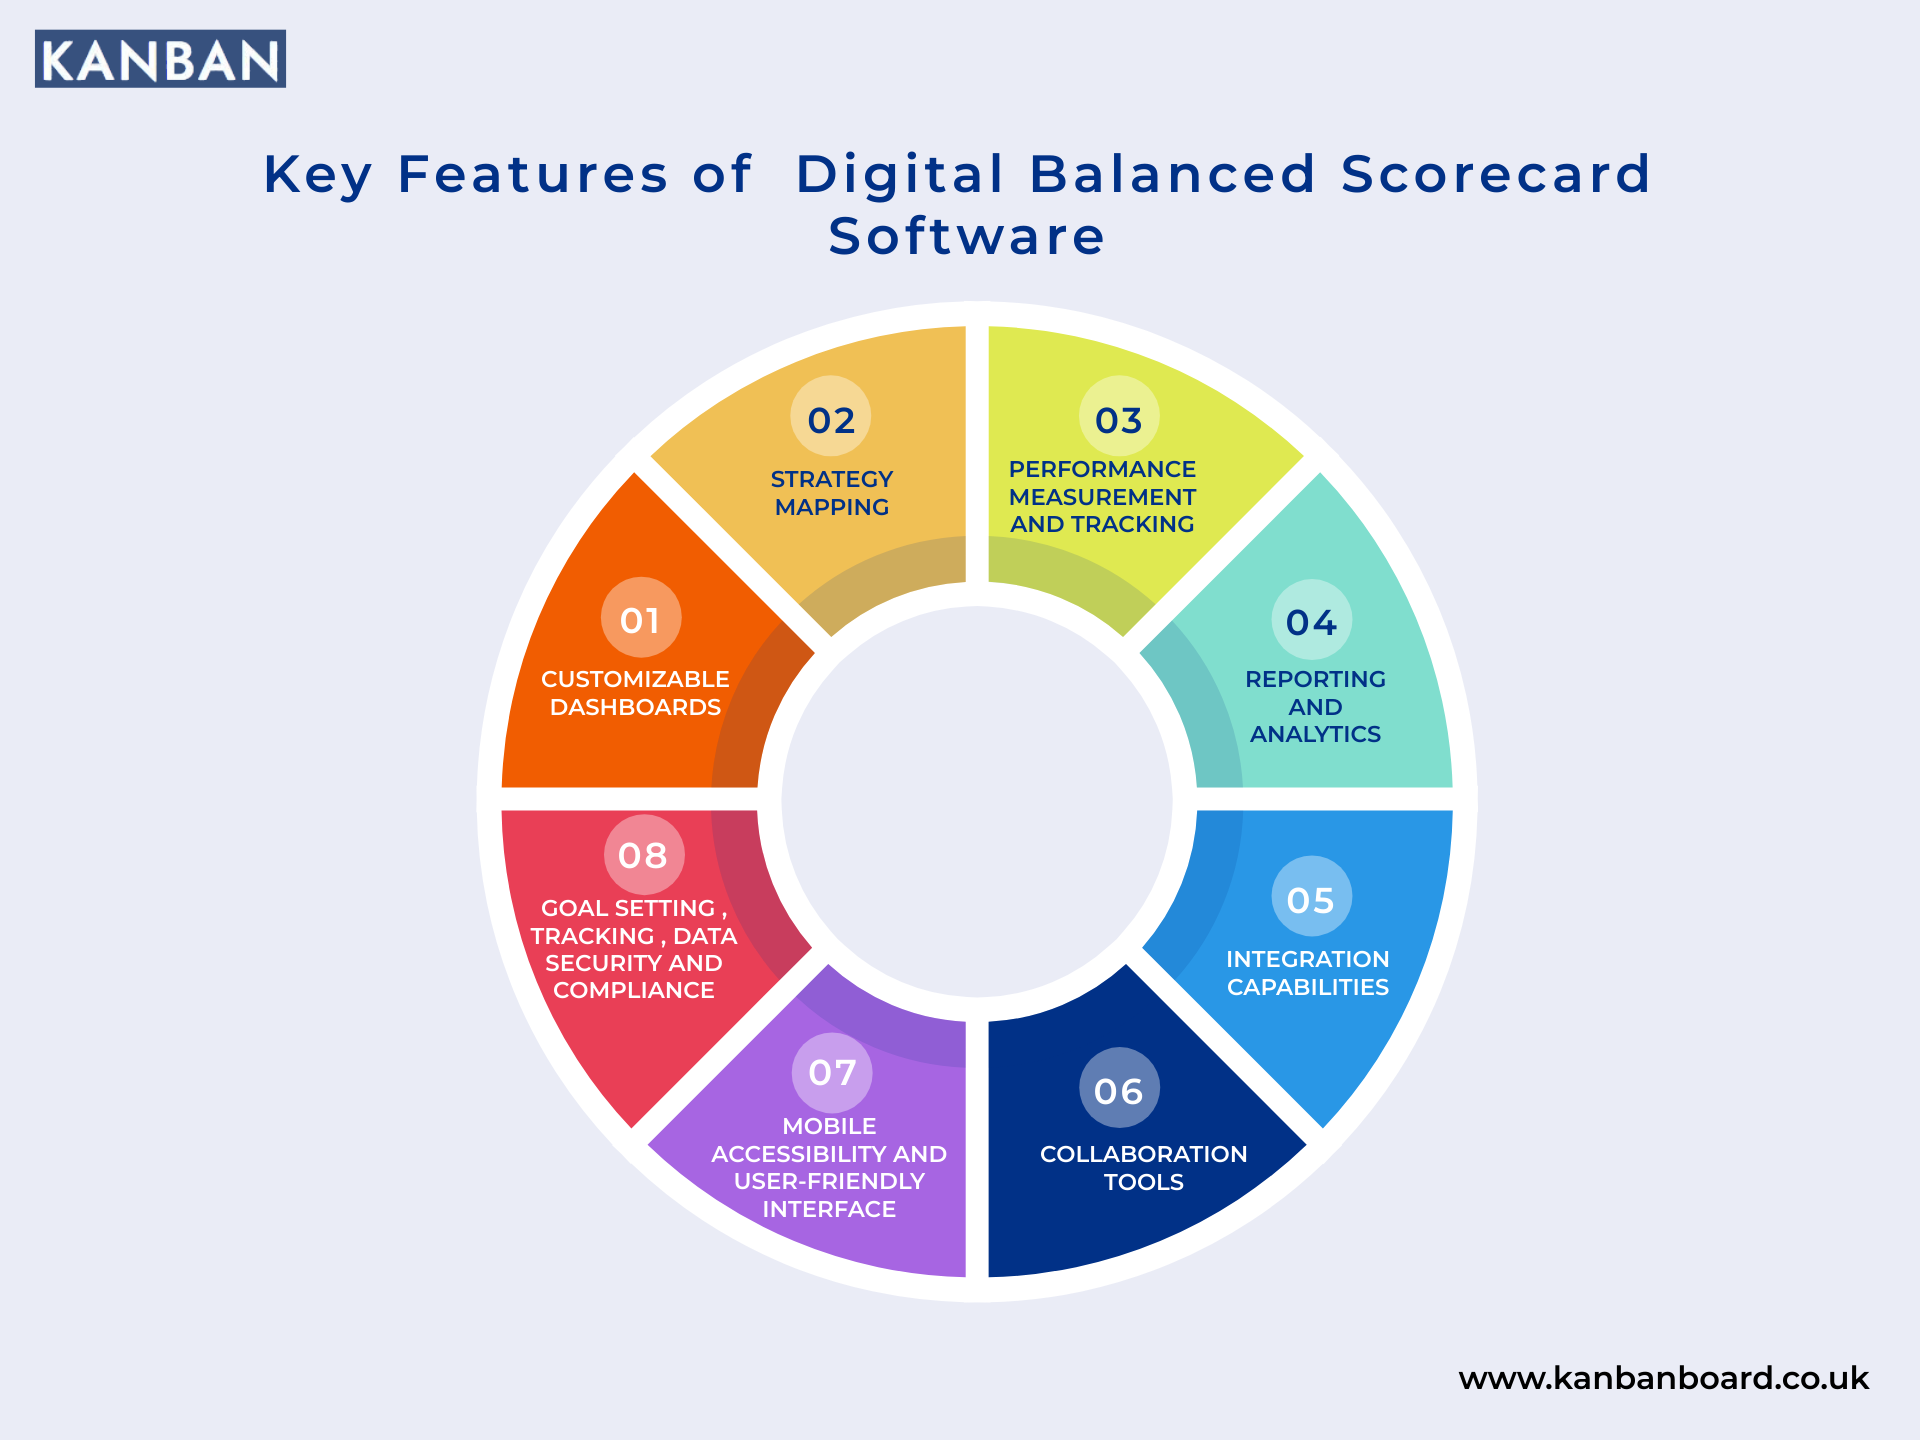
Features of Digital Balanced Scorecard software
Digital Balanced Scorecard software for strategic planning and effective management.
Real-Time Data Monitoring
1. Organisations can track Key Performance Indicators (KPIs) and metrics in real time.
2. It enables prompt decision-making and quick responses to performance fluctuations.
Customisable Dashboards
1. Users can customise dashboards to display the most relevant KPIs based on their roles and responsibilities.
2. This customisation improves focus and accountability across various organisational levels.
Integration Capabilities
1. Seamless integration with existing systems like ERP, CRM, and HR software is crucial.
2. It consolidates data from multiple sources, providing a comprehensive view of organisational performance.
Visual Analytics
1. Data visualisation using charts, graphs, and dashboards simplifies complex information.
2. This feature facilitates easy interpretation of performance metrics and identification of trends.
Strategic Alignment
1. The software helps align departmental objectives with overarching organisational goals.
2. It ensures that all teams work toward common priorities, fostering a unified strategic direction.
Collaboration Tools
1. Built-in collaboration features allow team members to share insights, provide feedback on performance metrics, and participate in discussions.
2. This promotes teamwork and a culture of accountability.
Performance Tracking
1. The ability to track performance against established targets is a core function.
2. It allows organisations to monitor progress, identify areas for improvement, and ensure accountability.
Mobile Accessibility
1. The ability to access the digital balanced scorecard from mobile devices.
2. This allows for decision makers to have access to the information they need at any time.
Drive Strategic Success with Balanced Scorecard Software!
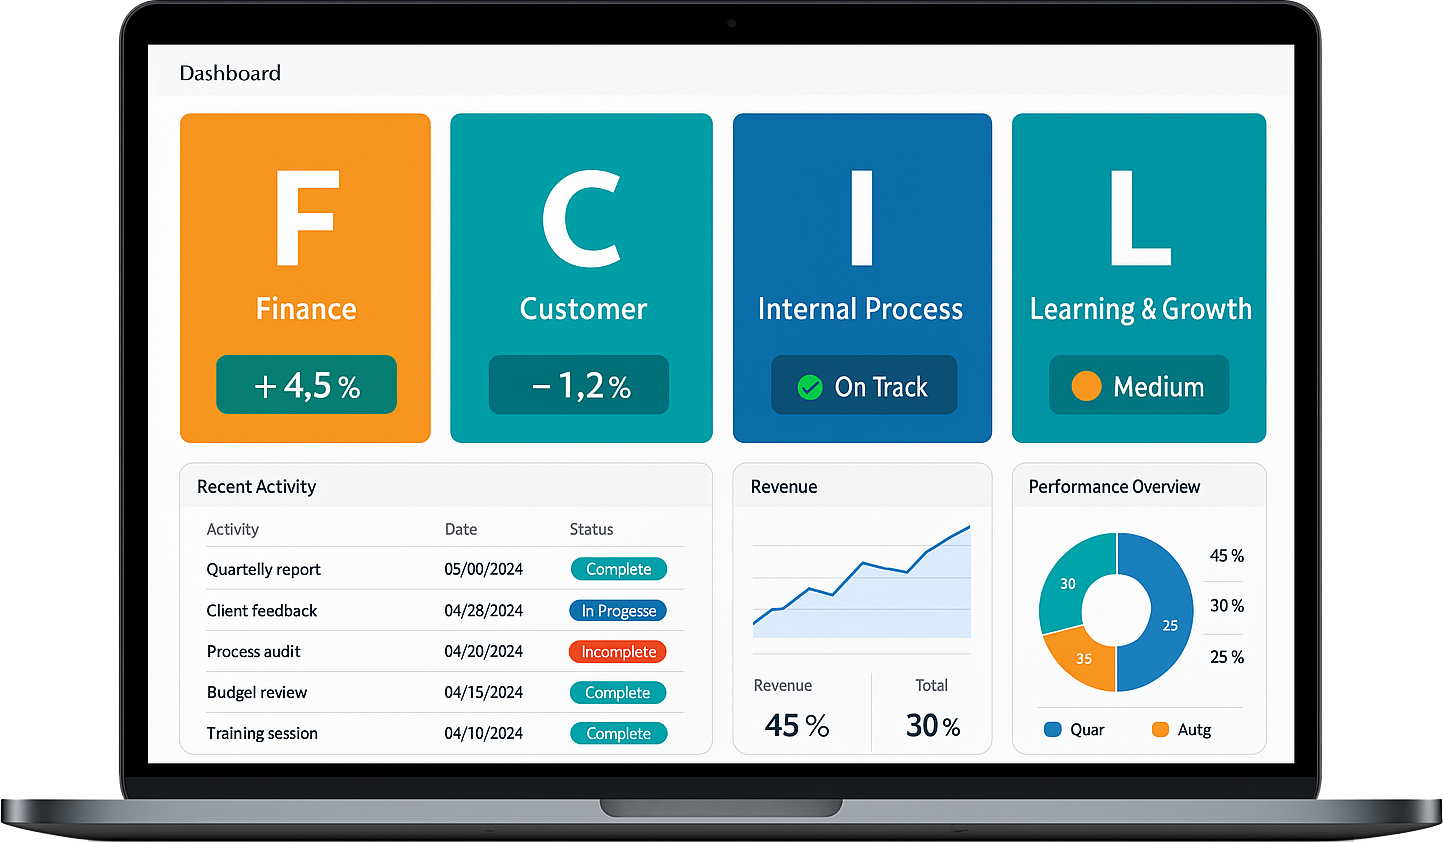
"Balanced Scorecard Software helps organisations track and manage performance using metrics like FCIL, SQDC, SQDCP, SQCDL, SQDIP, QCDMS, and SQDCME across financial, quality, delivery, and safety dimensions."
Different Industries for Balanced Scorecard software (BSC)
Balanced Scorecard software can be tailored to meet the needs of various industries by focusing on industry-specific metrics and strategic goals. Here’s how it can be adapted for different sectors:
Healthcare
In healthcare, Balanced Scorecard software might emphasise patient outcomes, quality of care, operational efficiency, and financial performance. It can track metrics like patient satisfaction scores, treatment effectiveness, cost per patient, and compliance with regulatory standards.

Manufacturing
For manufacturing, the software can focus on production efficiency, quality control, cost management, and safety. Key metrics might include production downtime, defect rates, cost per unit, and adherence to safety protocols.

Retail
In retail, Balanced Scorecard software can track customer satisfaction, sales performance, inventory management, and operational efficiency. Metrics could include customer loyalty scores, sales per square foot, inventory turnover rates, and employee productivity.

Financial Services
For financial services, the software might emphasise client satisfaction, regulatory compliance, operational efficiency, and financial performance. Metrics could include client retention rates, compliance incident rates, cost-to-income ratios, and return on assets.
Oil and Gas industry
Balanced Scorecard Software in the oil and gas industry helps track key performance metrics across financial, operational, safety, and sustainability goals to drive strategic alignment, improve efficiency, and enhance decision-making.
Aerospace industry
Balanced Scorecard Software in the aerospace industry helps organisations align strategic objectives across financial, customer, internal processes, and innovation, improving performance tracking, decision-making, and long-term sustainability in a highly competitive sector.
1. What is Balanced Scorecard software?
Balanced scorecard (BSC) software is a platform that helps organisations create, manage, and monitor their balanced scorecard, a strategic management system, by allowing them to define objectives, track KPIs, and initiatives, and visualise progress through dashboards and reports.
2. How does Balanced Scorecard software enhance performance tracking?
- Strategic Goal Alignment – Ensures all activities align with organisational objectives for better focus.
- Real-Time Performance Monitoring – Tracks key performance indicators (KPIs) to measure progress accurately.
- Data-Driven Decision-Making – Provides insights through dashboards and reports to enhance decision-making.
- Four-Perspective Analysis – Evaluates performance across Financial, Customer, Internal Processes, and Learning & Growth perspectives.
- Customisable KPIs – Allows organisations to set and track performance metrics relevant to their goals.
- Automated Reporting – Generates real-time reports to assess progress and identify areas for improvement.
- Continuous Improvement – Helps identify inefficiencies and optimise workflows for better results.
3. What are the core features of Balanced Scorecard software?
Balanced Scorecard (BSC) software, at its core, helps organisations track and manage performance across multiple perspectives like financial, customer, internal processes, and learning & growth, using key performance indicators (KPIs) and strategic maps to align activities with organisational goals.
4. Can Balanced Scorecard software integrate with existing business tools?
Yes, it often supports integration with various business tools like ERP systems and CRM platforms, ensuring seamless data flow and enhancing performance insights.
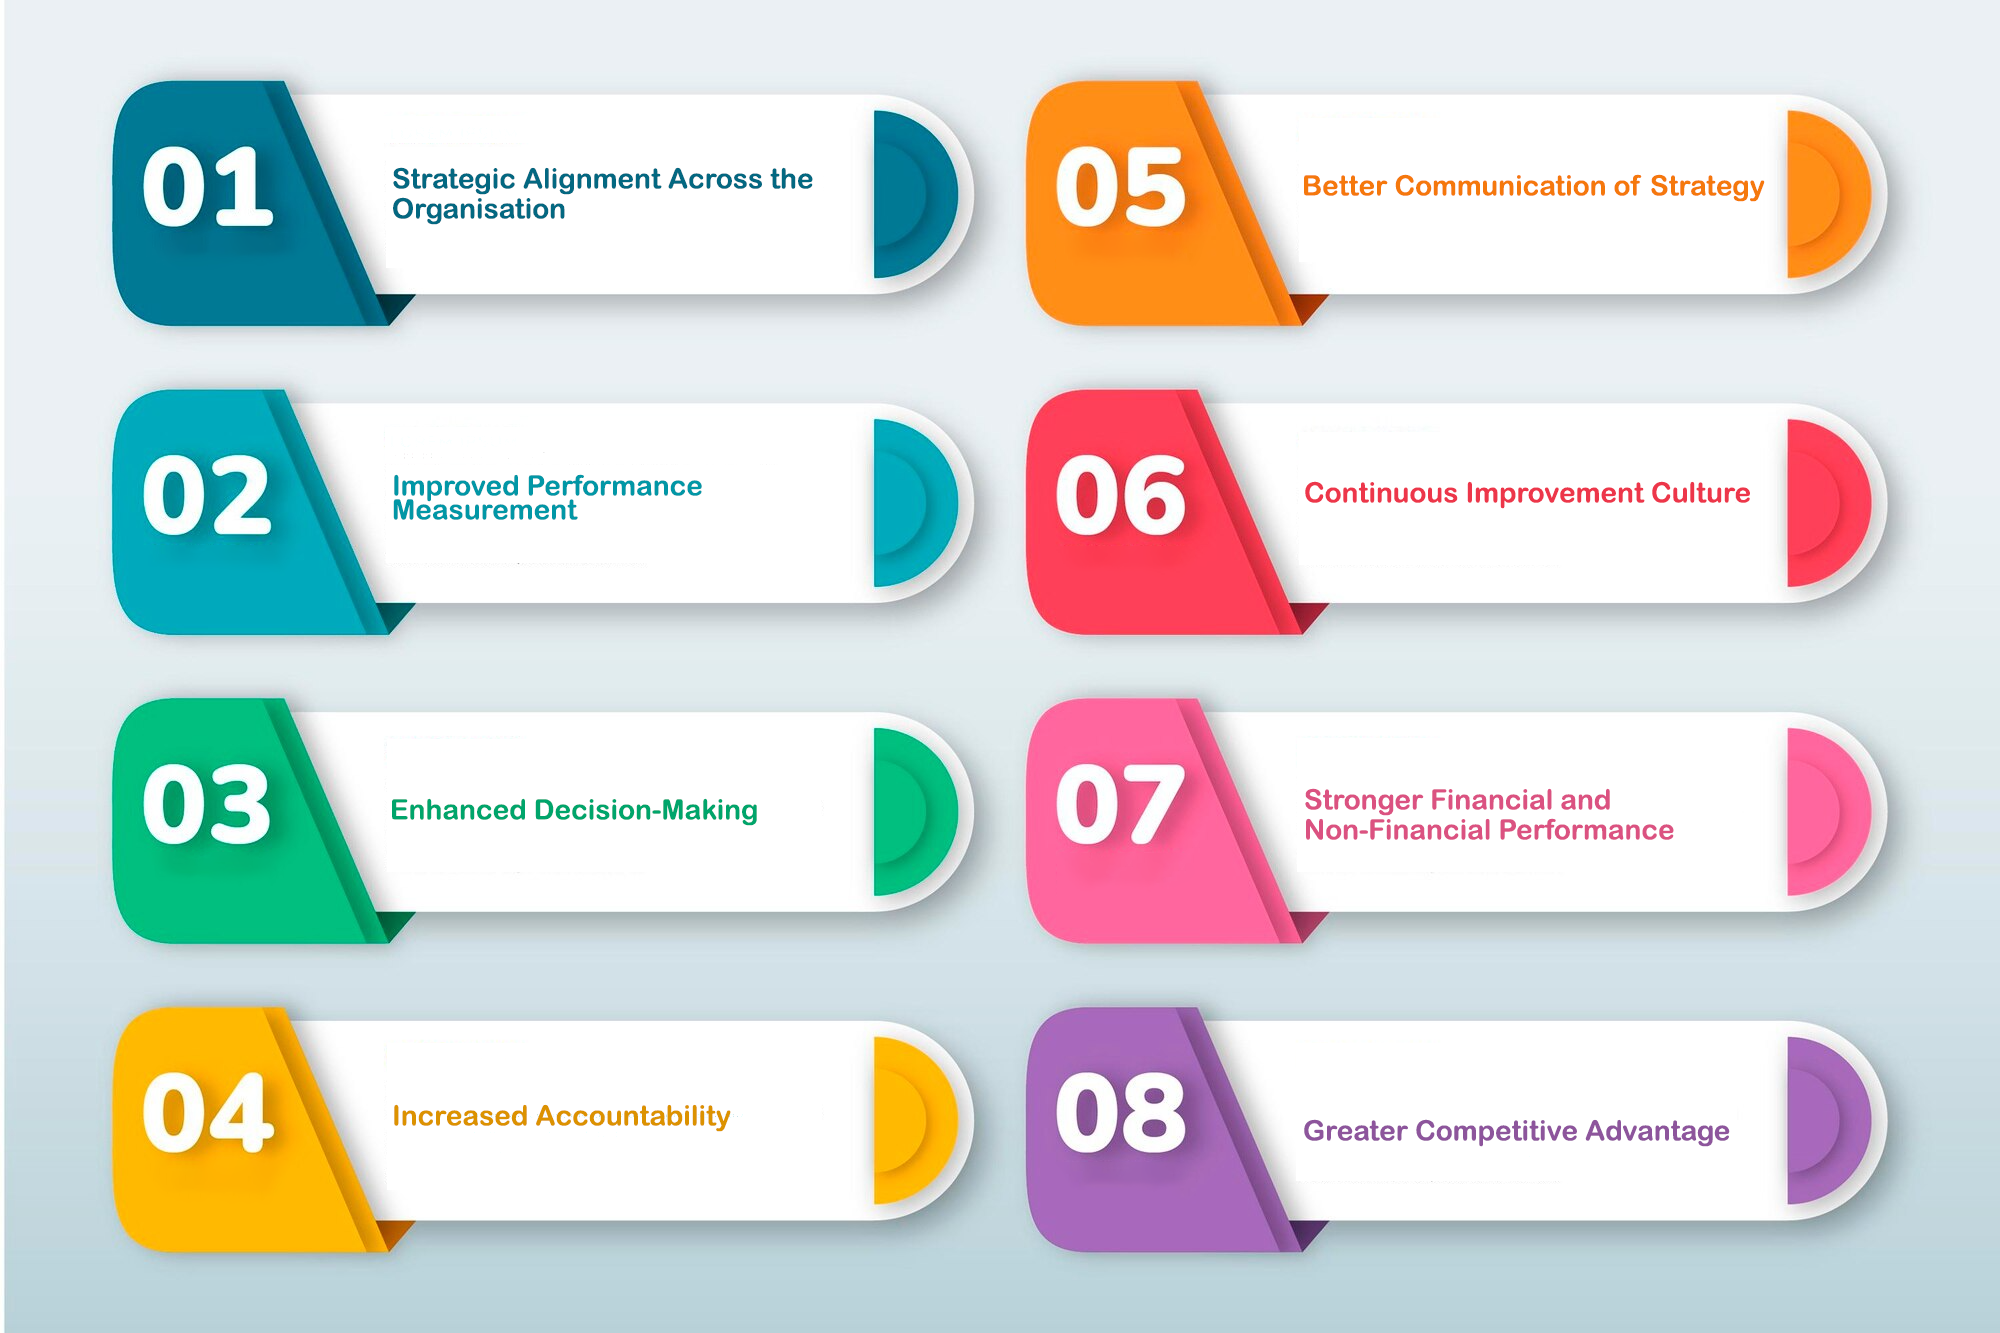
5. What are the main benefits of using Balanced Scorecard software?
Balanced Scorecard (BSC) software offers several key benefits, including improved strategic planning, enhanced communication and execution, better alignment of projects and initiatives, and more efficient performance reporting and management information.
6. Is Balanced Scorecard software suitable for all types of organisations?
Yes, it can be adapted for various organisations, including small businesses, large corporations, and non-profits, accommodating different industry needs and sizes.
7. What factors should be considered when selecting Balanced Scorecard software?
When choosing Balanced Scorecard software, prioritise ease of use, customisation options, integration capabilities, scalability, and focus on strategy alignment and performance measurement.
8. How can organisations ensure a successful implementation of Balanced Scorecard software?
- Clear Strategic Objectives – Define and align business goals with the Balanced Scorecard framework.
- Leadership Commitment – Gain executive support to drive adoption and engagement across the organisation.
- Effective KPI Selection – Choose relevant Key Performance Indicators (KPIs) that reflect business priorities.
- Comprehensive Training – Educate employees on how to use the software and interpret performance data.
- Integration with Existing Systems – Ensure seamless connection with ERP, CRM, and other business tools.
- Regular Performance Reviews – Continuously monitor results and refine strategies for continuous improvement.
- Data-Driven Decision-Making – Utilise real-time analytics and reports to guide business decisions.
- Strong Change Management – Communicate benefits and address resistance to encourage adoption.
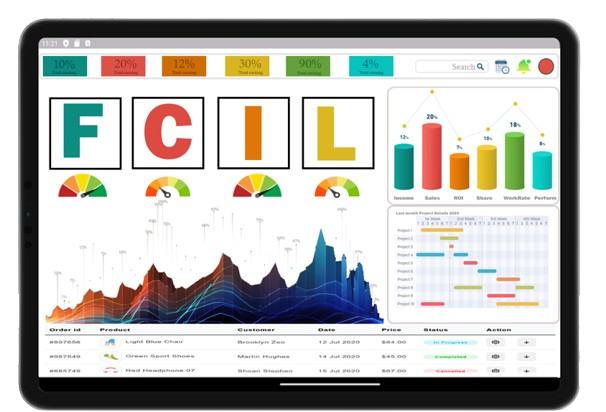
9. What is FCIL?
The FCIL Balanced Scorecard is a strategic performance management framework for nonprofits, focusing on Financial, Customer, Internal Processes, and Learning & Growth metrics, helping organisations translate their vision into actionable objectives and measures.
10. What does SQDC stand for?
SQDC stands for Safety, Quality, Delivery, and Cost, a framework used to track and improve performance in various business operations, particularly in manufacturing.
11. What is SQDCP?
SQDCP stands for Safety, Quality, Delivery, Cost, and People, and it's a framework used in lean manufacturing and continuous improvement to monitor and improve key performance indicators (KPIs) across these areas.
12. What does SQCDL represent?
SQCDL stands for Safety, Quality, Cost, Delivery, and Leadership, highlighting the importance of leadership in achieving operational excellence.
13. What is SQDIP?
SQDIP is a daily management tool used in lean manufacturing and continuous improvement environments to monitor and improve key performance indicators (KPIs) in areas like Safety, Quality, Delivery, Inventory, and Productivity.
14. What does QCDMS stand for?
QCDMS stands for Quality, Cost, Delivery, Safety, and Morale, a management approach used to improve business processes and achieve operational excellence.
15. What is SQDCME?
SQDCME is a mnemonic acronym, commonly used in manufacturing and lean environments, that stands for Safety, Quality, Cost, Delivery, Morale, and Environment, helping organisations remember and track key performance indicators.
16. How are FCIL and SQDC different?
FCIL focuses on strategic management, while SQDC concentrates on operational management within production and service processes.
17. How does SQDCP expand on SQDC?
SQDCP expands on SQDC (Safety, Quality, Delivery, Cost) by adding an essential Productivity (P) component.
SQDC focuses on monitoring and improving key operational performance metrics—ensuring workplace safety, product quality, timely delivery, and cost efficiency.
SQDCP builds on this by incorporating Productivity, which measures resource utilisation, workforce efficiency, and process optimisation to maximise output.
18. Why is Lead time included in SQCDL?
Lead time emphasises process efficiency and timely delivery, improving customer satisfaction and operational efficiency.
19. How does SQDIP incorporate continuous improvement?
SQDIP (Safety, Quality, Delivery, Inventory, Productivity) incorporates continuous improvement by serving as a visual management tool that tracks and analyses key performance indicators (KPIs) to identify areas for improvement and facilitate data-driven decision-making.
20. What role does QCDMS play in manufacturing?
In manufacturing, QCDMS (Quality, Cost, Delivery, Safety, and Morale) serves as a holistic strategy to improve business processes by focusing on these five key areas, ultimately aiming for continuous improvement and operational excellence.
21. How does SQDCME address employee morale and environmental concerns?
SQDCME (Safety, Quality, Delivery, Cost, Morale, Environment) addresses employee morale and environmental concerns by incorporating them as core performance indicators, fostering a culture of continuous improvement, and promoting a supportive work environment.
22. Can FCIL and SQDC be used together?
Yes, FCIL provides a strategic perspective while SQDC focuses on operational performance, aligning strategic objectives with daily improvements.
23. What is the benefit of including People in the SQDIP framework?
Including People emphasises workforce engagement in achieving operational goals, recognising that employee involvement is critical for maintaining safety, quality, delivery, and continuous improvement.
24. How can organisations measure success with QCDMS?
Organisations can measure success with QCDMS (Quality, Cost, Delivery, Safety, Morale) by tracking key performance indicators (KPIs) across these areas, comparing actual achievements against set goals, and measuring the efficiency of business functions and processes.
25. What are the key considerations when implementing SQDCME?
Key considerations include integrating employee morale and environmental impacts into operational processes, creating a supportive work environment, and aligning these aspects with safety, quality, delivery, and cost goals.