What are sqdip metrics?
SQDIP Metrics refer to the key performance indicators monitored in the SQDIP framework:
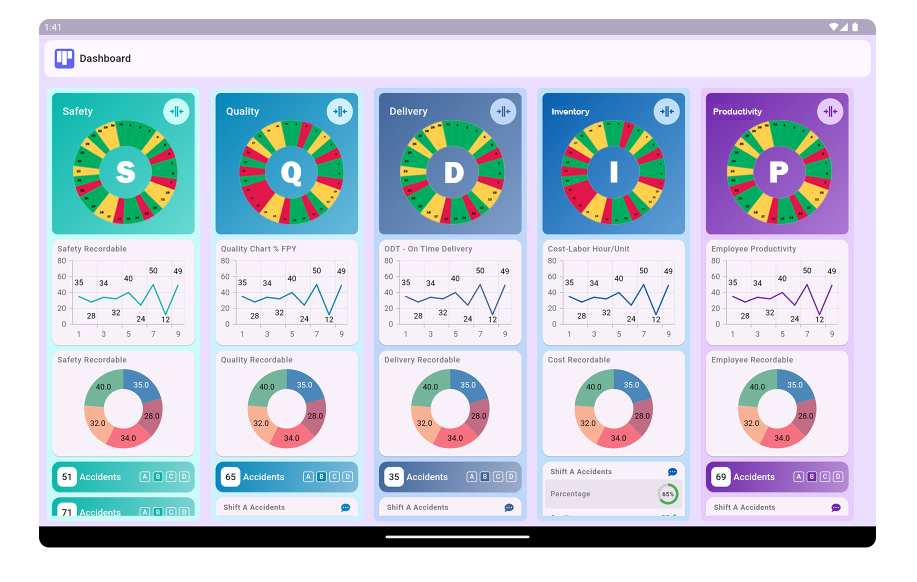
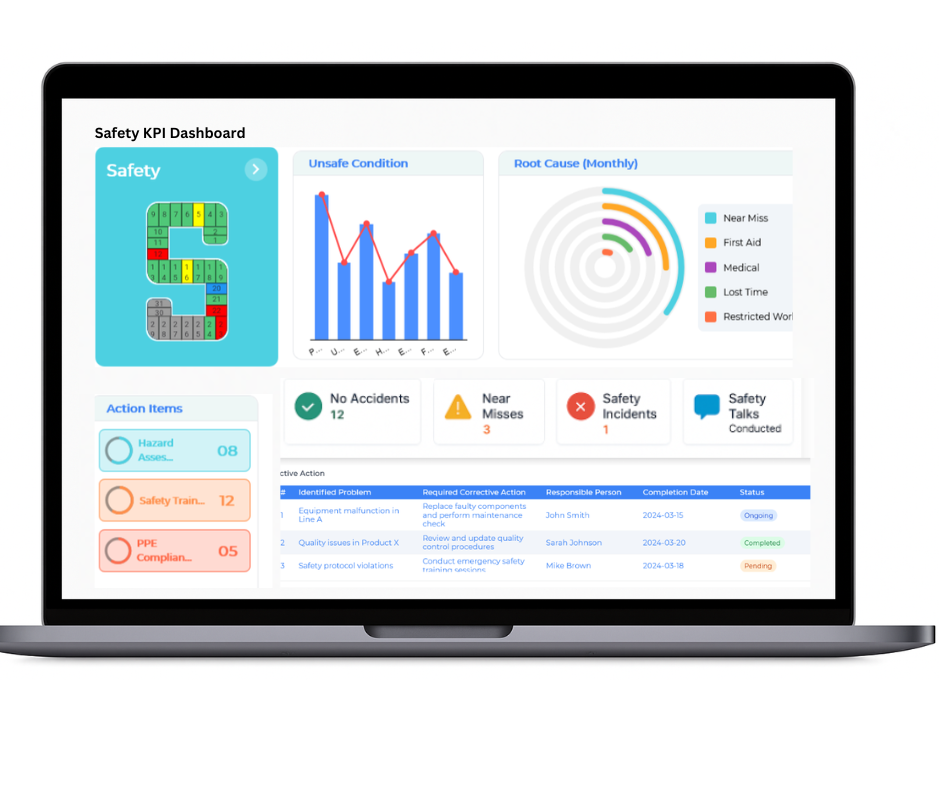
- Safety: Tracks incidents, near-misses, safety training completion, and adherence to safety protocols.
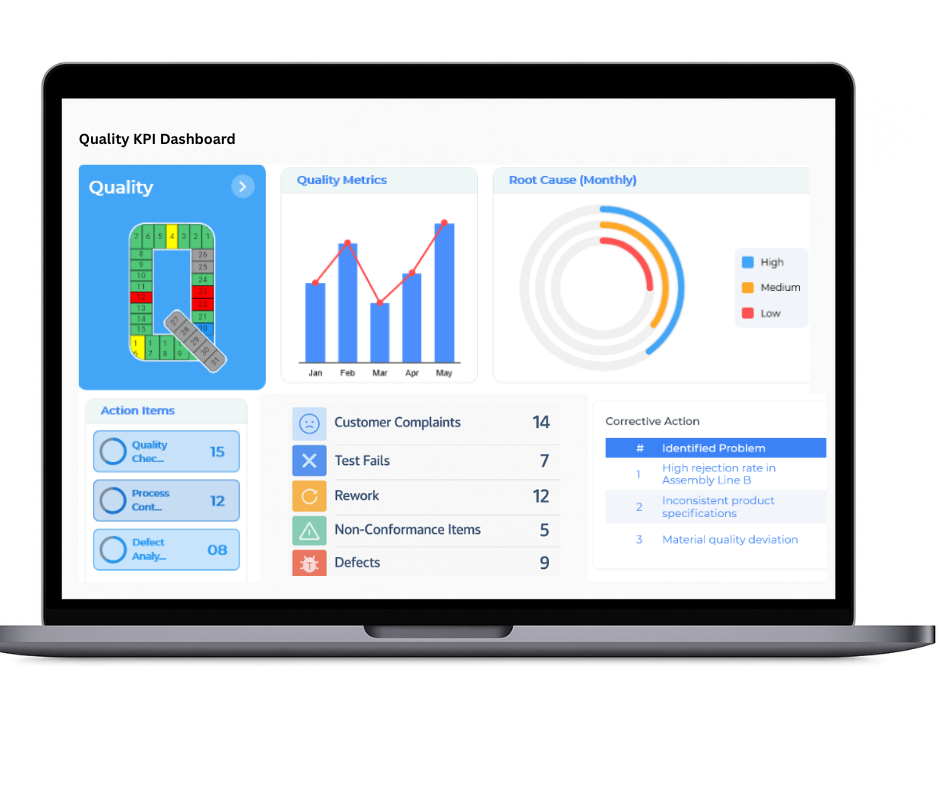
- Quality: Measures defect rates, customer complaints, returns, and adherence to quality standards.
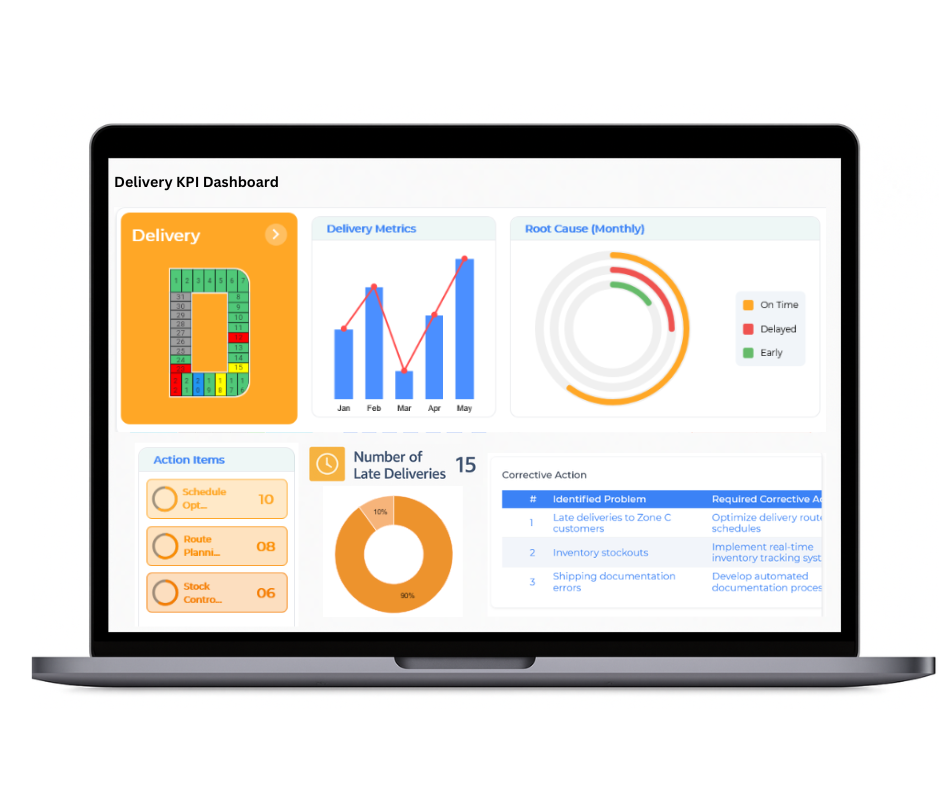
- Delivery: Monitors on-time delivery rates, lead times, and delivery accuracy.
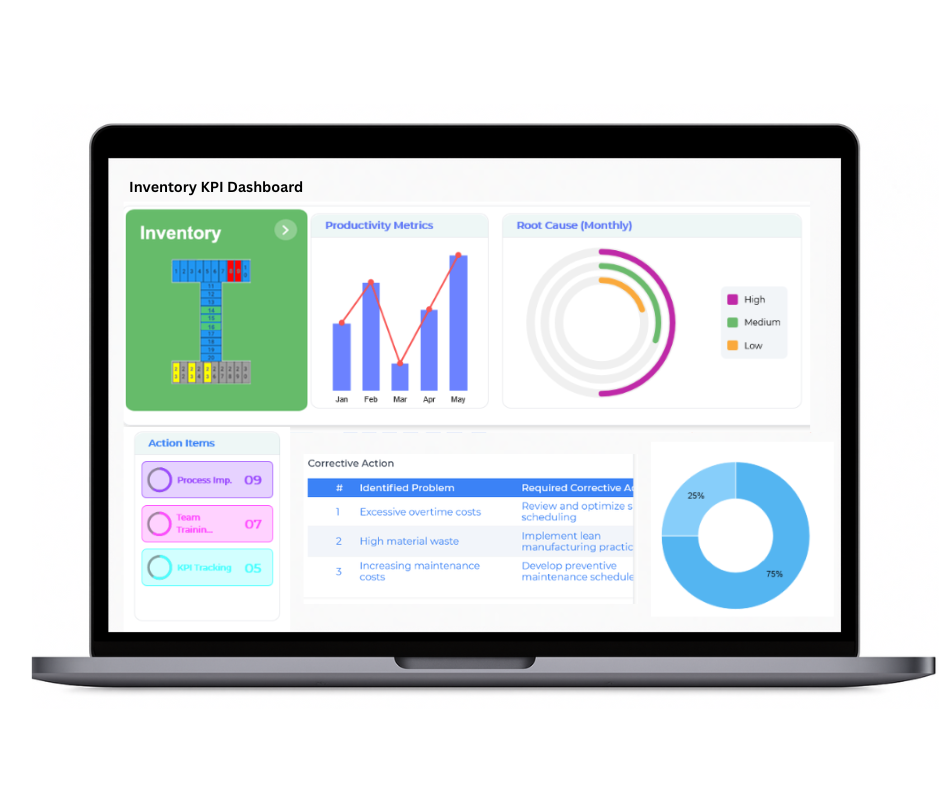
- Inventory: Tracks inventory levels, stockouts, and inventory turnover rates.
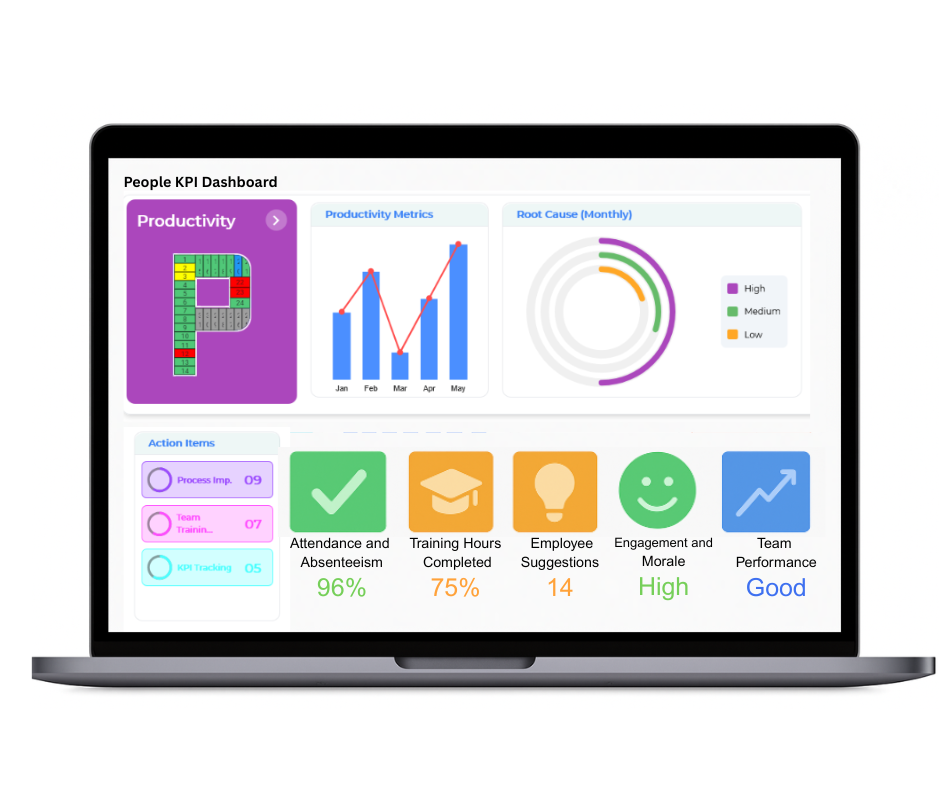
- Productivity: Measures output rates, efficiency, downtime, and adherence to production schedules.
What is the purpose of SQDIP?
- Provide a visual and systematic approach to monitor key performance indicators.
- Enable teams to quickly identify and address issues in critical areas.
- Foster a culture of continuous improvement and operational excellence.
- Enhance communication and collaboration among team members.
- Drive better decision-making based on real-time data.
What Does SQDIP Stand For?
SQDIP is a valuable acronym used in the world of operational management to drive continuous improvement across organisations. It stands for Safety, Quality, Delivery, Inventory, and People. These five pillars represent the core focus areas that help organisations maintain a well-balanced and efficient operation, particularly in manufacturing and production environments.
Safety
Safety is the top priority in any organisation. SQDIP boards help monitor and improve safety standards by tracking incidents, hazards, and safety protocols. By keeping safety visible and part of daily operations, businesses can foster a culture of proactive risk management and reduce accidents in the workplace.
Quality
Quality ensures that products and services meet customer expectations and industry standards. The quality pillar of SQDIP focuses on monitoring defects, rework, and ensuring that quality checks are in place throughout production. This improves product consistency and helps reduce waste and costs.
Delivery
Delivery measures the ability of a business to meet deadlines and fulfil customer orders on time. Tracking delivery performance through SQDIP helps identify bottlenecks and areas for improvement, ensuring that products are delivered promptly and customer satisfaction is maintained.
Inventory
Effective inventory management is crucial for reducing waste and optimising resources. The inventory pillar of SQDIP ensures that stock levels are monitored, and that materials are used efficiently, leading to cost savings and reduced overstocking.
People
The people element focuses on employee engagement and development. Monitoring the performance and wellbeing of the workforce is key to fostering a motivated and efficient team. It encourages accountability and continuous improvement through employee involvement in decision-making and problem-solving.
In summary, SQDIP is a comprehensive tool for organisations to track their performance in key operational areas. It ensures that safety, quality, delivery, inventory, and people are all aligned, leading to a more effective and streamlined operation.
What is the Primary Purpose of SQDIP?
The primary purpose of SQDIP (Safety, Quality, Delivery, Inventory, and People) is to provide a structured approach to monitoring and improving key operational metrics within an organisation. SQDIP is a tool designed to drive continuous improvement by focusing on five critical areas that directly impact performance, efficiency, and customer satisfaction.
Safety
Ensuring a safe working environment is paramount for any organisation. SQDIP helps organisations track and manage safety incidents and hazards, fostering a culture of safety and reducing the risk of workplace accidents. By monitoring safety consistently, businesses can create a safer environment for employees and minimise downtime due to accidents.
Quality
Quality management is central to ensuring products or services meet the required standards. The SQDIP framework highlights quality issues such as defects, rework, or customer complaints, allowing businesses to address these concerns promptly. By improving quality control, organisations can enhance customer satisfaction and reduce operational costs caused by poor quality.
Delivery
Timely delivery is critical to customer satisfaction and operational success. SQDIP helps organisations track delivery performance, ensuring products or services are delivered on time. Monitoring delivery allows businesses to identify and resolve bottlenecks, ensuring efficient production and maintaining a positive customer experience.
Inventory
Effective inventory management helps reduce waste and optimise resources. By tracking inventory levels through the SQDIP framework, organisations can ensure they are using resources efficiently, preventing stockouts or overstocking, and improving overall supply chain management.
People
People are at the heart of any successful operation. SQDIP focuses on employee performance, engagement, and wellbeing, ensuring a motivated and productive workforce. By involving employees in performance tracking and improvement, organisations can drive a culture of accountability and continuous development.
How is SQDIP Implemented in an Organisation?
Implementing SQDIP (Safety, Quality, Delivery, Inventory, and People) in an organisation requires a systematic approach to integrate these key performance indicators (KPIs) into daily operations. By focusing on these five critical areas, businesses can track performance, identify improvement opportunities, and ensure continuous growth. Here's how organisations can effectively implement SQDIP:
Step 1: Define Clear Objectives
The first step is to define specific goals for each of the SQDIP pillars. For example, safety targets could include reducing workplace accidents, while quality targets might aim to lower product defects. Setting clear, measurable objectives ensures everyone in the organisation understands what is being tracked and why it matters.
Step 2: Create a Visual Management System
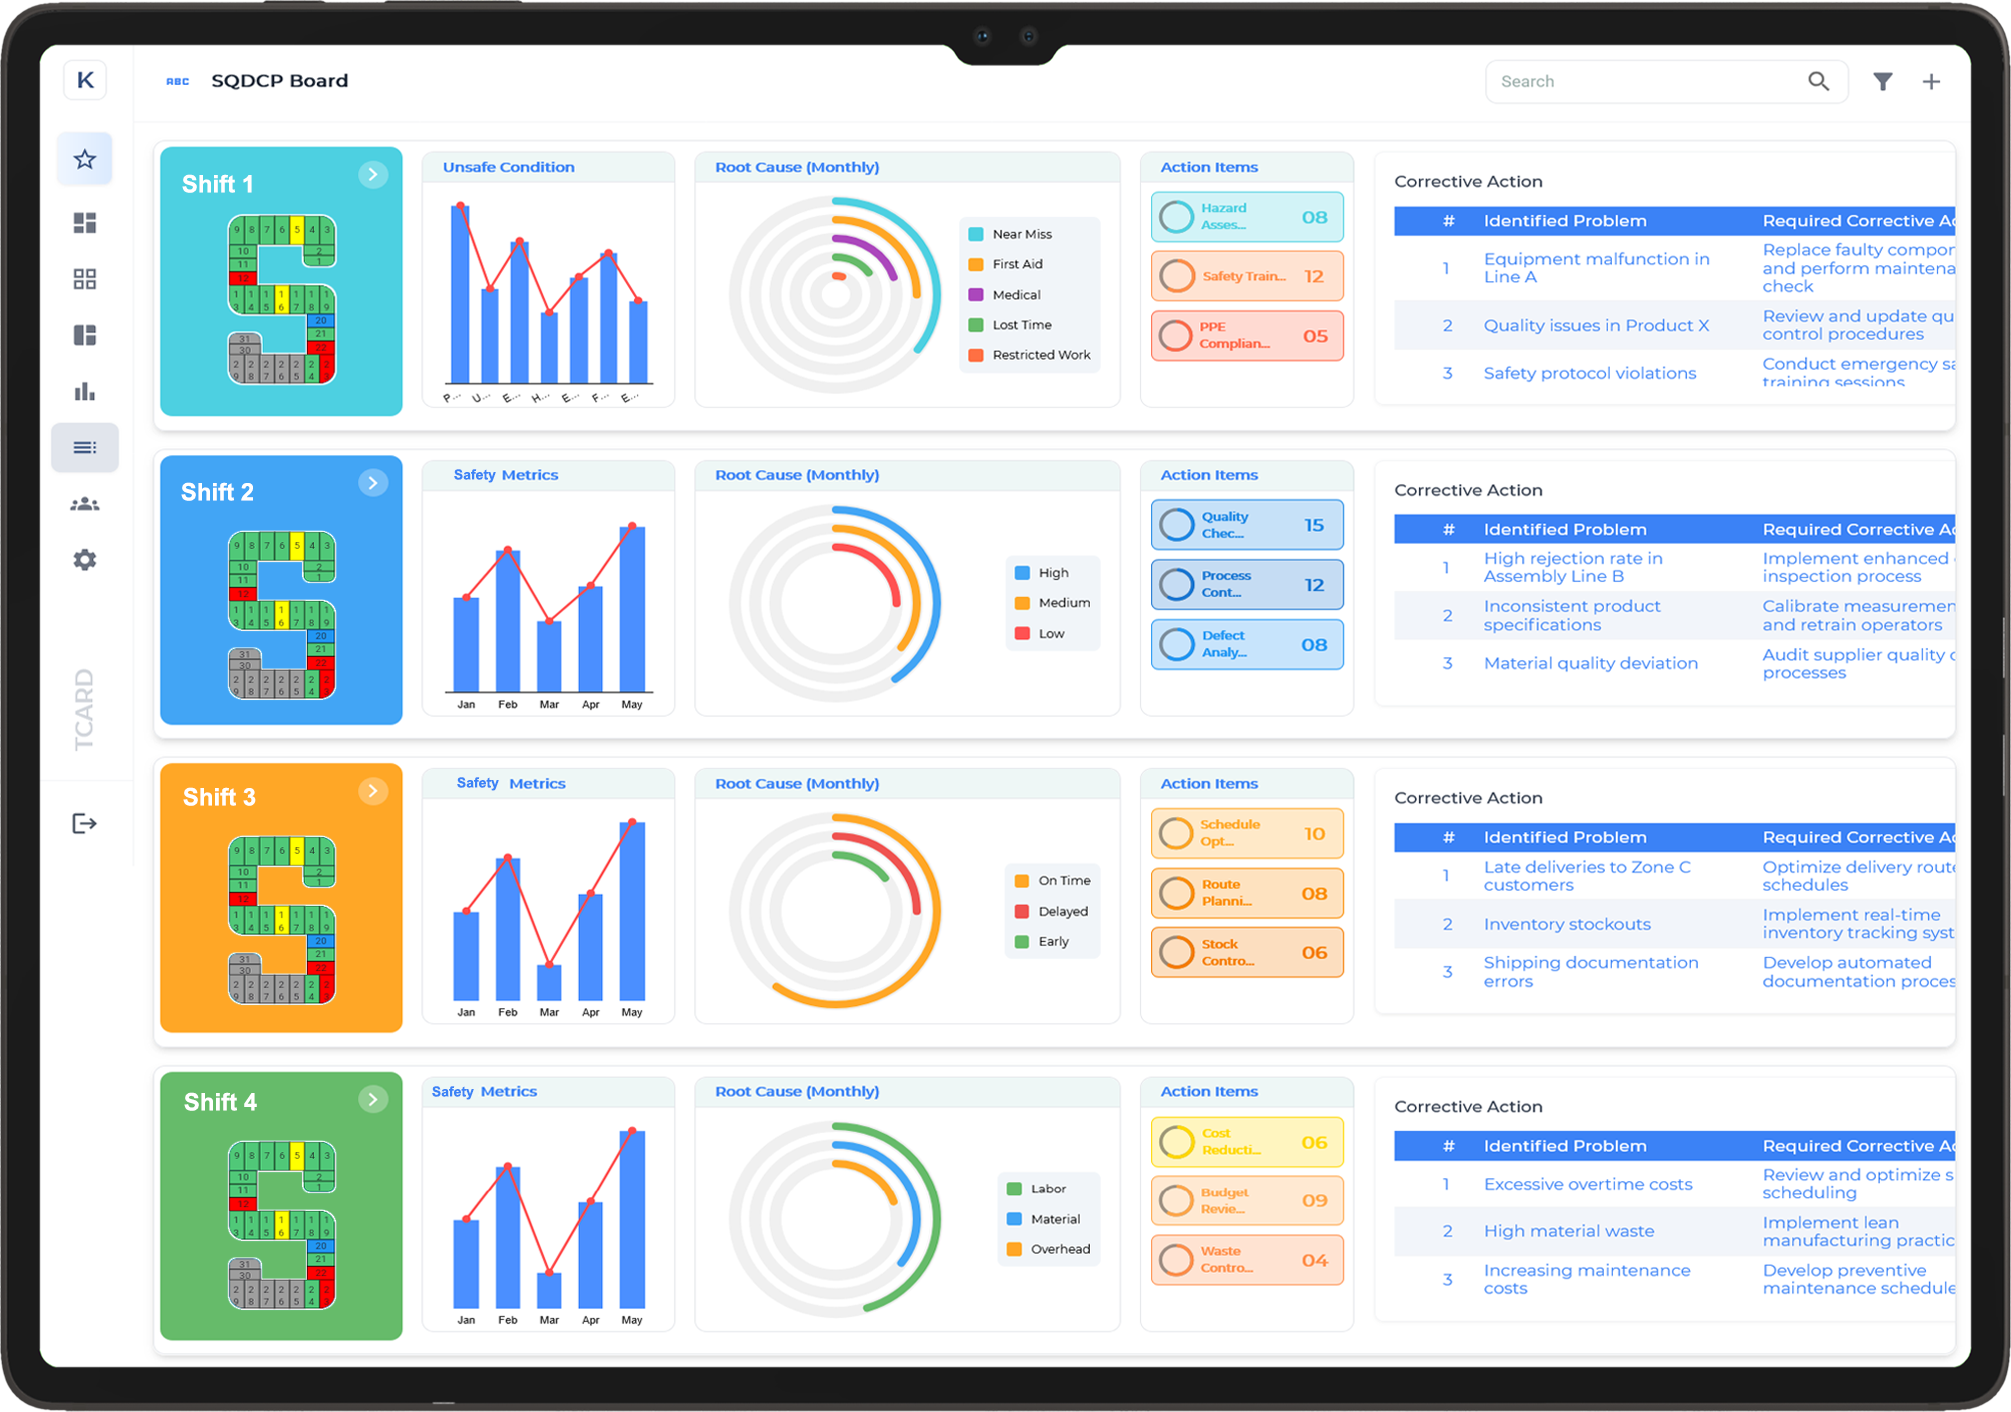
Visual management tools like SQDIP boards are an essential part of implementation. These boards help teams track key metrics in real time. By displaying data related to safety, quality, delivery, inventory, and people, organisations can quickly identify issues and take corrective action.
Step 3: Regular Monitoring and Review
SQDIP requires ongoing monitoring and review. Daily or weekly meetings should be held to discuss performance data, address any issues, and identify opportunities for improvement. This regular feedback loop helps keep teams engaged and focused on achieving the set goals.
Step 4: Empower Teams and Encourage Accountability
For SQDIP to be successful, all team members need to be involved. Each department should take ownership of their area, be it safety, quality, or inventory. Encouraging accountability at all levels ensures that the goals are met and the organisation can drive improvements.
Boost Operational Excellence with SQDIP Board Software
Streamline daily management and enhance visibility across critical performance areas with our user-friendly SQDIP Board Software. Drive continuous improvement in Safety, Quality, Delivery, Inventory, and People-tailored to your business needs.
What are the Benefits of Using SQDIP?
Implementing SQDIP (Safety, Quality, Delivery, Inventory, and People) brings numerous advantages to organisations looking to optimise their operations. By focusing on these five key areas, businesses can achieve better performance, streamline processes, and enhance overall productivity. Here are the primary benefits of using SQDIP:
Improved Safety Standards
Safety is a top priority in any workplace. SQDIP helps reduce accidents and injuries by tracking safety metrics regularly. With clear safety goals and real-time visibility, teams can take proactive measures to address hazards, ensuring a safer working environment for everyone.
Enhanced Quality Control
Focusing on quality is essential for customer satisfaction. SQDIP allows organisations to monitor quality metrics, identify defects, and take corrective actions swiftly. This focus on continuous quality improvement leads to better products and services, ultimately boosting customer loyalty and brand reputation.
On-Time Delivery and Operational Efficiency
Meeting delivery deadlines is crucial for maintaining customer trust. SQDIP enables organisations to track delivery performance and resolve bottlenecks quickly. This improves operational efficiency, helps reduce lead times, and ensures that customers receive their orders on time, every time.
Optimised Inventory Management
By closely monitoring inventory levels, organisations can reduce excess stock, avoid shortages, and optimise the flow of goods. SQDIP allows for better control of inventory, minimising waste and costs, and ensuring smooth production processes.
Enhanced People Management and Engagement
SQDIP helps organisations focus on employee engagement and performance. Tracking the ‘People’ pillar encourages a culture of accountability, motivating teams to improve their skills and contribute to the organisation's goals.
Who Should Use SQDIP in an Organisation?
SQDIP (Safety, Quality, Delivery, Inventory, and People) is a powerful tool that can be used by a variety of roles within an organisation to drive continuous improvement and operational excellence. Implementing SQDIP effectively requires the involvement of key stakeholders across different levels of the organisation. Here’s who should use SQDIP:
Senior Leadership
Senior leaders and management are responsible for setting the overall strategic direction. They should use SQDIP to align organisational goals with operational performance. By focusing on safety, quality, delivery, inventory, and people, leadership can ensure that every department is working towards the same objectives, driving business growth and long-term success.
Operations and Production Teams
For teams involved in production and operations, SQDIP provides clear visibility into performance metrics that impact daily operations. These teams can monitor safety standards, track production quality, manage inventory levels, and improve delivery performance. Using SQDIP enables them to identify issues early, solve problems quickly, and optimise processes on the shop floor.
Quality Control and Safety Managers
Quality control and safety managers are key users of SQDIP. They can use the safety and quality pillars to ensure compliance with standards, address risks, and improve product quality. By monitoring and acting on these metrics, they help minimise defects, reduce accidents, and ensure that the organisation meets both customer and regulatory expectations.
Human Resources and People Managers
The ‘People’ pillar within SQDIP allows HR and people managers to track employee performance, engagement, and development. Using this data, HR can create targeted training programmes, identify areas for improvement, and enhance employee satisfaction, which ultimately leads to a more motivated and productive workforce.
Team Leaders and Supervisors
Team leaders and supervisors can use SQDIP to manage day-to-day operations, ensuring their teams are meeting set targets in all five areas. By using SQDIP boards, they can visually track progress, identify bottlenecks, and improve overall team performance.
In summary, SQDIP is beneficial for everyone from senior management to frontline workers. By adopting SQDIP across all levels of an organisation, teams can work more cohesively towards achieving continuous improvement and operational excellence.
How Does SQDIP Help in Improving Safety?
Safety is a crucial element in any workplace, and SQDIP (Safety, Quality, Delivery, Inventory, and People) offers a structured approach to ensuring that safety standards are consistently met and improved. By focusing on safety as one of its core pillars, SQDIP helps organisations create safer work environments while fostering a culture of continuous improvement. Here’s how it helps improve safety:
Continuous Monitoring of Safety Metrics
With SQDIP, safety becomes a daily focus through continuous monitoring. The safety pillar provides real-time tracking of incidents, near misses, hazards, and compliance with safety protocols. This allows organisations to identify trends or recurring issues, which can be addressed before they escalate into more serious problems. Regular tracking keeps safety at the forefront of everyday operations.
Encourages Proactive Safety Measures
SQDIP promotes proactive safety measures by empowering employees to report safety concerns, ensuring that potential risks are addressed promptly. The system encourages employees to stay vigilant and act quickly to resolve hazards, rather than waiting for an incident to occur. This proactive approach helps to minimise workplace accidents and injuries.
Facilitates Safety Training and Awareness
Using the safety pillar of SQDIP, organisations can identify areas where additional training or awareness programmes may be required. Whether it’s providing refresher courses on proper handling techniques or educating staff about new safety regulations, SQDIP ensures that safety remains a top priority through regular evaluations and improvements.
Enhances Accountability for Safety
With SQDIP, safety performance is visualised and shared across teams. This transparency creates accountability at all levels, as individuals and departments are responsible for meeting safety targets. Clear safety goals and regular progress updates motivate employees to contribute to a safer workplace.
Can SQDIP Be Customised to Fit Different Industries?
Yes, SQDIP (Safety, Quality, Delivery, Inventory, and People) is highly customisable and can be tailored to fit the unique needs of different industries. This flexibility makes it an invaluable tool for organisations across various sectors, including manufacturing, healthcare, logistics, and service industries. By adapting the SQDIP framework, businesses can address specific challenges and optimise their operations in line with industry standards. Here’s how SQDIP can be customised:
Tailoring Safety Protocols
Different industries have different safety requirements, and SQDIP can be customised to reflect these needs. For example, a manufacturing plant may need to focus on machine safety and hazard prevention, while a healthcare facility might need to emphasise patient safety and infection control. Customising the safety pillar ensures that industry-specific safety risks are effectively managed.
Adjusting Quality Standards
Each industry has its own set of quality standards and benchmarks. SQDIP allows organisations to define quality metrics that align with these standards. In manufacturing, this might include product defect rates, while in healthcare, it could focus on patient care quality. By setting the right quality indicators, businesses can continually improve their operations and maintain high standards.
Optimising Delivery and Inventory
The delivery and inventory pillars can also be adjusted to meet the needs of different sectors. In retail, for instance, inventory management might focus on stock turnover, while in logistics, the emphasis could be on delivery lead times and fleet performance. Customising these pillars allows businesses to streamline their operations and reduce costs.
People Management Adaptations
The people pillar in SQDIP focuses on workforce engagement, and its approach can vary depending on the industry. For example, in a service-based industry, it might focus on employee training and customer service skills, while in construction, it may emphasise workforce safety and productivity.
What Types of Data Are Displayed on an SQDIP Board?
An SQDIP (Safety, Quality, Delivery, Inventory, and People) board displays a wide range of data that helps teams track performance and make informed decisions. The data presented is tailored to the specific needs of the organisation, ensuring it aligns with key business goals. Here’s a breakdown of the types of data typically displayed on an SQDIP board:
Safety Data
Safety metrics are crucial for maintaining a safe work environment. The data shown in this section may include the number of accidents, near misses, safety violations, and any corrective actions taken. Additionally, safety audits, risk assessments, and safety training completion rates are often displayed to ensure that the workplace meets safety standards.
Quality Data
The quality section of an SQDIP board typically displays information about product or service quality. This may include defect rates, returns, customer complaints, and quality control checks. The goal is to monitor and reduce defects while ensuring the organisation meets or exceeds industry quality standards.
Delivery Data
Delivery data focuses on tracking the on-time performance of services or product deliveries. This could include on-time delivery percentages, delays, lead times, and any disruptions in the delivery process. It provides an overview of how efficiently the organisation meets its customer expectations in terms of delivery.
Inventory Data
Inventory data includes stock levels, inventory turnover rates, and stockouts. This helps businesses monitor inventory flow and avoid overstocking or understocking issues. Additionally, it can include order fulfilment rates and supply chain performance, helping organisations optimise their inventory management processes.
People Data
The people section tracks employee performance, engagement, and development. This may include data on absenteeism, employee training completion rates, team performance, and workforce utilisation. By displaying this data, organisations can identify areas where employee development or improvement is needed.
Overall, the SQDIP board provides a clear, visual representation of critical operational data across multiple pillars. It allows teams to identify trends, spot issues early, and take proactive measures to improve performance in safety, quality, delivery, inventory, and people management.
How Often Should SQDIP Boards Be Reviewed?
The frequency of reviewing SQDIP boards is crucial for maintaining continuous improvement and ensuring operational excellence. The ideal review frequency largely depends on the specific needs of the organisation, but regular checks are necessary to keep performance on track. Here’s a guide on how often each aspect of the SQDIP board should be reviewed:
Daily Reviews
In fast-paced environments, such as manufacturing or service operations, daily reviews of the SQDIP board are essential. These quick, focused checks help to ensure that teams remain aligned with key performance indicators (KPIs) like safety, delivery, and quality. Daily updates allow teams to address immediate issues, make adjustments, and celebrate small wins, keeping everyone motivated and focused on the day’s tasks.
Weekly Reviews
Weekly reviews are beneficial for teams or departments that deal with more complex or long-term projects. This frequency allows for a deeper dive into the data, such as inventory levels, quality control issues, or workforce performance. A weekly review gives managers the opportunity to spot trends, adjust plans, and prepare for the upcoming week’s challenges. It also provides the chance for team discussions and feedback.
Monthly Reviews
Monthly reviews are ideal for broader strategic analysis and to assess overall operational performance. This review frequency allows for a more comprehensive understanding of long-term trends and can help identify areas where systemic improvements are needed. Monthly reviews provide the perfect opportunity to reflect on achievements, evaluate the effectiveness of strategies, and plan for the next month.
What Are Some Common Challenges in Implementing SQDIP?
Implementing SQDIP (Safety, Quality, Delivery, Inventory, and People) boards can significantly enhance operational efficiency, but it comes with its own set of challenges. Understanding these challenges can help organisations prepare and adapt effectively to maximise the benefits of SQDIP. Here are some common obstacles:
Resistance to Change
One of the biggest hurdles in implementing SQDIP is resistance to change. Employees, especially those who are used to traditional systems, may be reluctant to adopt a new method of tracking and monitoring performance. Overcoming this resistance requires clear communication, training, and leadership support to demonstrate the value of SQDIP boards in improving day-to-day operations.
Data Accuracy and Consistency
For SQDIP boards to be effective, the data displayed must be accurate and up-to-date. Inconsistent or inaccurate data can lead to poor decision-making and undermine the board’s effectiveness. Organisations must establish robust data collection processes and ensure that team members are trained to maintain data quality consistently.
Overcomplicating the Process
Another challenge is overcomplicating the SQDIP board with too many metrics or categories. While it’s essential to track multiple aspects of performance, overwhelming the board with excessive data can dilute focus and make it harder for teams to prioritise key issues. A streamlined, focused approach that aligns with business goals is crucial for success.
Lack of Engagement
Without active engagement from all team members, an SQDIP board will not be effective. It is vital to ensure that everyone, from frontline workers to managers, understands the board’s purpose and contributes to its updates. Regular team meetings and follow-ups are essential to keep the SQDIP process alive and relevant.
By addressing these challenges, organisations can ensure the successful implementation of SQDIP boards and drive continuous improvement throughout their operations.
SQDIP Template
SQDIP Board for [Department/Team]
Date: [Current Date]
Safety (S)
| Metric |
Target |
Actual |
Status |
| Number of incidents |
0 |
[Value] |
[✓/✗] |
| Near-misses |
0 |
[Value] |
[✓/✗] |
| Training completion |
100% |
[Value] |
[✓/✗] |
| Audit scores |
[Target] |
[Value] |
[✓/✗] |
Action Plan:
[Description of actions to improve safety metrics]
Quality (Q)
| Metric |
Target |
Actual |
Status |
| Defect rates |
[Target] |
[Value] |
[✓/✗] |
| Customer complaints |
0 |
[Value] |
[✓/✗] |
| Returns |
[Target] |
[Value] |
[✓/✗] |
| Audit scores |
[Target] |
[Value] |
[✓/✗] |
Action Plan:
[Description of actions to improve quality metrics]
Delivery (D)
| Metric |
Target |
Actual |
Status |
| On-time delivery |
100% |
[Value] |
[✓/✗] |
| Lead time |
[Target] |
[Value] |
[✓/✗] |
| Delivery accuracy |
100% |
[Value] |
[✓/✗] |
Action Plan:
[Description of actions to improve delivery metrics]
Inventory (I)
| Metric |
Target |
Actual |
Status |
| Inventory levels |
[Target] |
[Value] |
[✓/✗] |
| Stockouts |
0 |
[Value] |
[✓/✗] |
| Inventory turnover |
[Target] |
[Value] |
[✓/✗] |
Action Plan:
[Description of actions to improve inventory metrics]
Productivity (P)
| Metric |
Target |
Actual |
Status |
| Output rate |
[Target] |
[Value] |
[✓/✗] |
| Efficiency |
[Target] |
[Value] |
[✓/✗] |
| Downtime |
[Target] |
[Value] |
[✓/✗] |
| Adherence to schedule |
100% |
[Value] |
[✓/✗] |
Action Plan:
[Description of actions to improve productivity metrics]
Review Frequency: Daily/Weekly/Monthly
Responsible Team Members: [List of Names]
Next Review Date: [Date]

