The Fishbone template, also known as the Ishikawa diagram or Cause and Effect diagram, is a powerful visual tool for identifying the root causes of problems. Developed by Kaoru Ishikawa in the 1960s, the Fishbone diagram helps businesses and organizations analyze complex issues by breaking down potential causes into manageable categories. This tool is widely used in industries like manufacturing, healthcare, and service sectors to improve quality and performance by addressing problems at their source.
1. Understanding the Fishbone Template
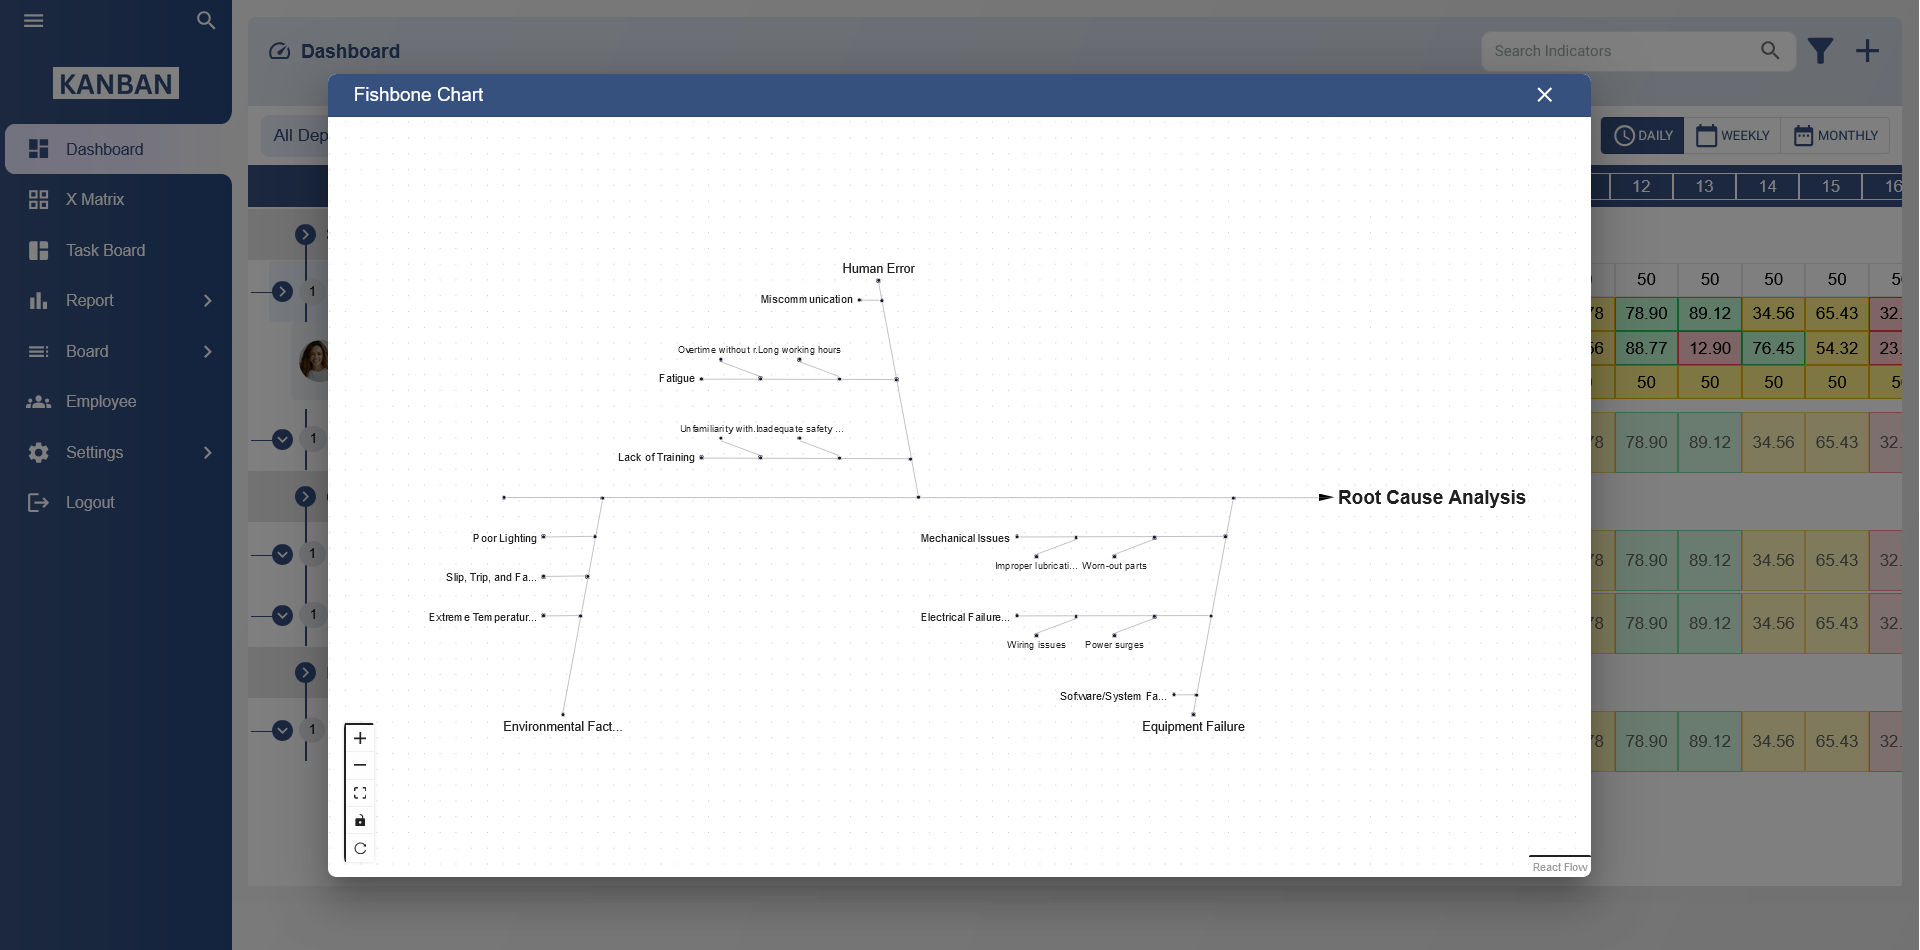
The Fishbone diagram gets its name from its resemblance to a fish skeleton, where the head represents the main problem or effect, and the "bones" represent various categories of causes. These categories help organize different factors that could contribute to the issue being analyzed. The diagram is structured as follows:
- Head: The problem or effect that needs to be analyzed.
- Spine: The central line that runs from the head to the tail of the fish, representing the process or flow.
- Bones: The branches extending from the spine, representing different categories of causes.
- Sub-causes: Further branches that extend from the bones, identifying more specific causes of the problem.
2. Key Benefits of the Fishbone Template
The Fishbone diagram is highly beneficial for both problem-solving and continuous improvement efforts. Some key advantages include:
- Visual Clarity: The Fishbone diagram provides a clear, visual representation of complex problems, helping teams identify all potential causes.
- Organized Approach: By categorizing potential causes, the template helps structure the analysis, making it easier to pinpoint areas for improvement.
- Team Collaboration: The diagram encourages team discussions and brainstorming, helping bring multiple perspectives into the problem-solving process.
- Root Cause Identification: It helps shift the focus from symptoms to root causes, leading to more effective solutions and long-term improvements.
3. How to Create a Fishbone Template
Creating a Fishbone diagram involves several key steps. Here’s a step-by-step guide to using the template effectively:
- Step 1: Define the Problem – Clearly identify the problem or effect that needs to be analyzed. This should be placed at the head of the diagram.
- Step 2: Identify Categories of Causes – Determine the main categories of potential causes. Common categories include:
- People
- Process
- Equipment
- Materials
- Environment
- Management
- Step 3: Identify Possible Causes – For each category, brainstorm and list potential causes. These are represented as the "bones" of the diagram.
- Step 4: Identify Sub-causes – If necessary, further break down the causes into sub-causes to explore deeper layers of the problem.
- Step 5: Analyze and Prioritize – Once the diagram is complete, analyze the causes to identify which ones are most likely contributing to the problem. Prioritize them for further investigation and corrective action.
4. Common Categories for Fishbone Templates
While the categories mentioned earlier (People, Process, Equipment, Materials, Environment, and Management) are standard, the Fishbone diagram is customizable based on the nature of the issue. Some industries or businesses may prefer to use different categories. Here are a few common variations:
- Manufacturing: In manufacturing, common categories might include Machinery, Methods, Materials, Measurement, Manpower, and Environment.
- Healthcare: In healthcare, categories might include People, Procedures, Equipment, Environment, and Policies.
- Service Industry: In the service industry, categories might include Employees, Equipment, Environment, Communication, and Procedures.
5. Tips for Using the Fishbone Template Effectively
To make the most of the Fishbone diagram, here are some best practices:
- Involve the Right Team: Ensure that you have a diverse team with knowledge of the issue at hand. This will lead to a more thorough analysis of causes and sub-causes.
- Be Thorough: When brainstorming potential causes, don’t skip over any possibilities. The more causes you explore, the easier it will be to identify the true root cause.
- Stay Focused: Keep the problem statement clear and concise to avoid wandering off-topic. A focused problem statement helps streamline the analysis process.
- Use Multiple Diagrams: If necessary, use multiple Fishbone diagrams for different aspects of a problem. For example, one diagram could address human factors, while another addresses process-related issues.
6. Fishbone Template in Continuous Improvement
The Fishbone diagram is a valuable tool in continuous improvement frameworks such as Lean, Six Sigma, and Total Quality Management (TQM). It allows organizations to systematically address quality issues by investigating the underlying causes and eliminating them. Here’s how the Fishbone diagram fits into continuous improvement efforts:
- Problem Identification: It helps businesses identify and define problems clearly, providing a visual map to guide the team’s efforts.
- Root Cause Analysis: By exploring all potential causes, the Fishbone diagram leads to the discovery of the root causes of problems, rather than just treating symptoms.
- Solution Development: Once root causes are identified, businesses can develop targeted solutions to address the problem and prevent recurrence.
- Prevention of Future Issues: The Fishbone diagram helps organizations prevent future issues by focusing on improving processes and eliminating inefficiencies.
7. Example of a Fishbone Template in Action
Let’s consider an example: a manufacturing company is experiencing delays in production. A Fishbone diagram might be used to identify the root causes. The categories could include:
- People: Lack of training, employee miscommunication
- Process: Inefficient workflow, unclear procedures
- Equipment: Machine breakdowns, outdated technology
- Materials: Delays in material supply, low-quality materials
- Environment: Poor lighting, noisy work environment
- Management: Lack of oversight, unclear goals
By analyzing these causes, the team can pinpoint which areas need attention, prioritize improvements, and implement corrective actions to streamline production and reduce delays.
What is a Fishbone template?
A Fishbone template, also known as an Ishikawa diagram or cause-and-effect diagram, is a visual tool used to identify the root causes of a problem. It resembles a fish skeleton, with the main "bone" representing the problem and the "bones" branching out as potential causes.
How does the Fishbone diagram help in problem-solving?
The Fishbone diagram helps in problem-solving by breaking down the problem into multiple categories of potential causes. This allows teams to explore all possible factors contributing to an issue and identify the root causes for effective solutions.
What are the main components of a Fishbone template?
The main components of a Fishbone template include the head (representing the problem or effect), the spine (representing the central cause), and the branches (representing categories of causes). Each branch further breaks down potential factors contributing to the problem.
When should a Fishbone diagram be used?
A Fishbone diagram should be used when a team needs to analyze a problem and identify the underlying causes. It is especially useful in quality control, process improvement, and troubleshooting situations where the root cause is not immediately clear.
How do you create a Fishbone diagram?
To create a Fishbone diagram, draw a central line (the spine) and connect branches representing categories of potential causes (e.g., People, Process, Equipment). Then, identify and list specific causes on each branch, exploring all possible factors that could contribute to the problem.
What are the benefits of using a Fishbone diagram in root cause analysis?
The benefits of using a Fishbone diagram in root cause analysis include its structured approach to problem-solving, the ability to identify multiple causes simultaneously, and its effectiveness in facilitating team discussions to uncover the real issue.
Can a Fishbone diagram be used for process improvement?
Yes, a Fishbone diagram is ideal for process improvement. It helps teams identify inefficiencies, bottlenecks, or weaknesses in processes by analyzing their causes, thus enabling better solutions and process optimizations.
How does a Fishbone diagram identify potential causes of problems?
A Fishbone diagram identifies potential causes by organizing them into categories such as People, Process, Materials, Equipment, Environment, and Management. This allows teams to explore all factors contributing to a problem systematically.
What are the categories commonly used in a Fishbone diagram?
Common categories in a Fishbone diagram include People, Process, Equipment, Materials, Environment, and Management. These categories help organize potential causes into clear groups, making it easier to analyze them.
How do you prioritize causes in a Fishbone diagram?
Causes in a Fishbone diagram can be prioritized by evaluating their impact on the problem. Teams can use methods such as brainstorming, voting, or data analysis to identify which causes are most likely to be the root cause and address them first.
Is a Fishbone diagram suitable for all types of problems?
While a Fishbone diagram is versatile and effective for many types of problems, it is most useful for complex issues where multiple factors contribute. It may not be as useful for problems with clear, straightforward causes.
How can a Fishbone diagram be used in team discussions?
A Fishbone diagram is an excellent tool for team discussions. It encourages collaboration by allowing team members to contribute their perspectives on possible causes, ensuring a comprehensive exploration of the issue and a shared understanding of the problem.
Can a Fishbone diagram be created digitally?
Yes, Fishbone diagrams can be easily created digitally using various software tools that allow for quick creation, sharing, and editing. Digital Fishbone diagrams can be more efficient, especially in collaborative environments.
How does a Fishbone diagram contribute to decision-making?
A Fishbone diagram contributes to decision-making by providing a structured visual representation of the problem’s causes. This helps teams make data-driven decisions by focusing on the root causes rather than just the symptoms of the problem.
Can the Fishbone diagram be used for project management?
Yes, the Fishbone diagram is a valuable tool in project management. It helps identify and address potential obstacles or issues that could affect the success of a project, leading to more effective planning and execution.