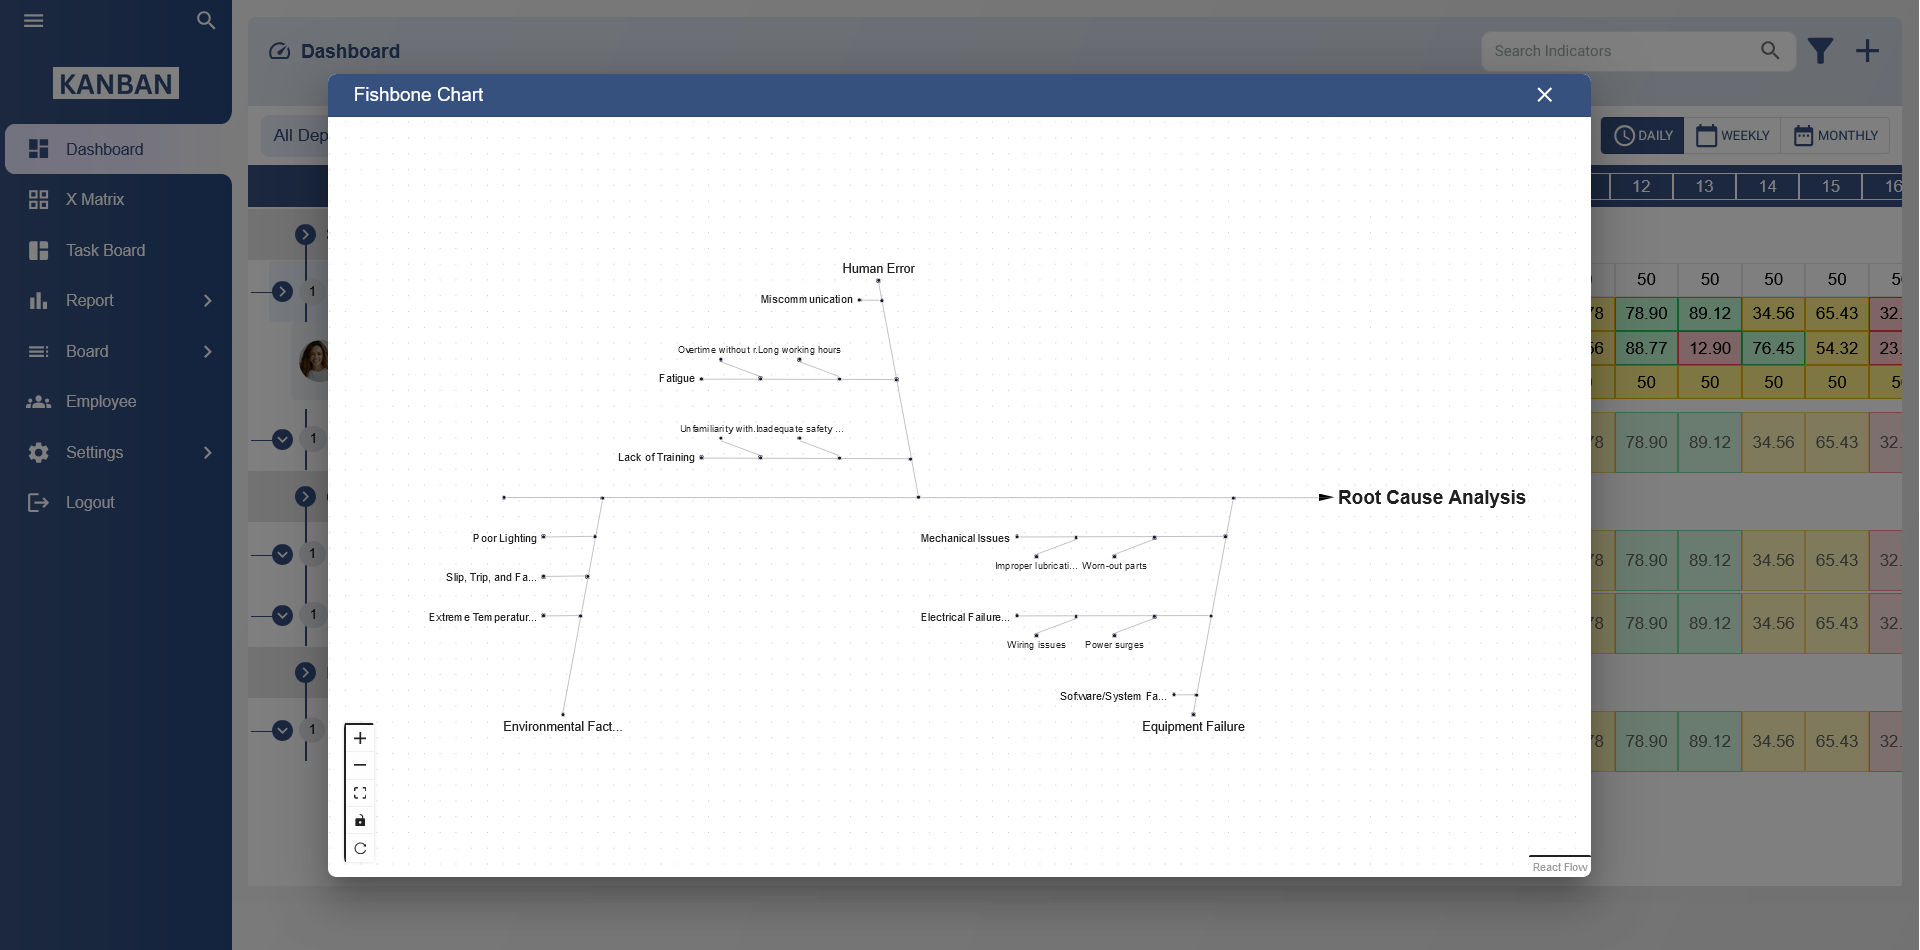
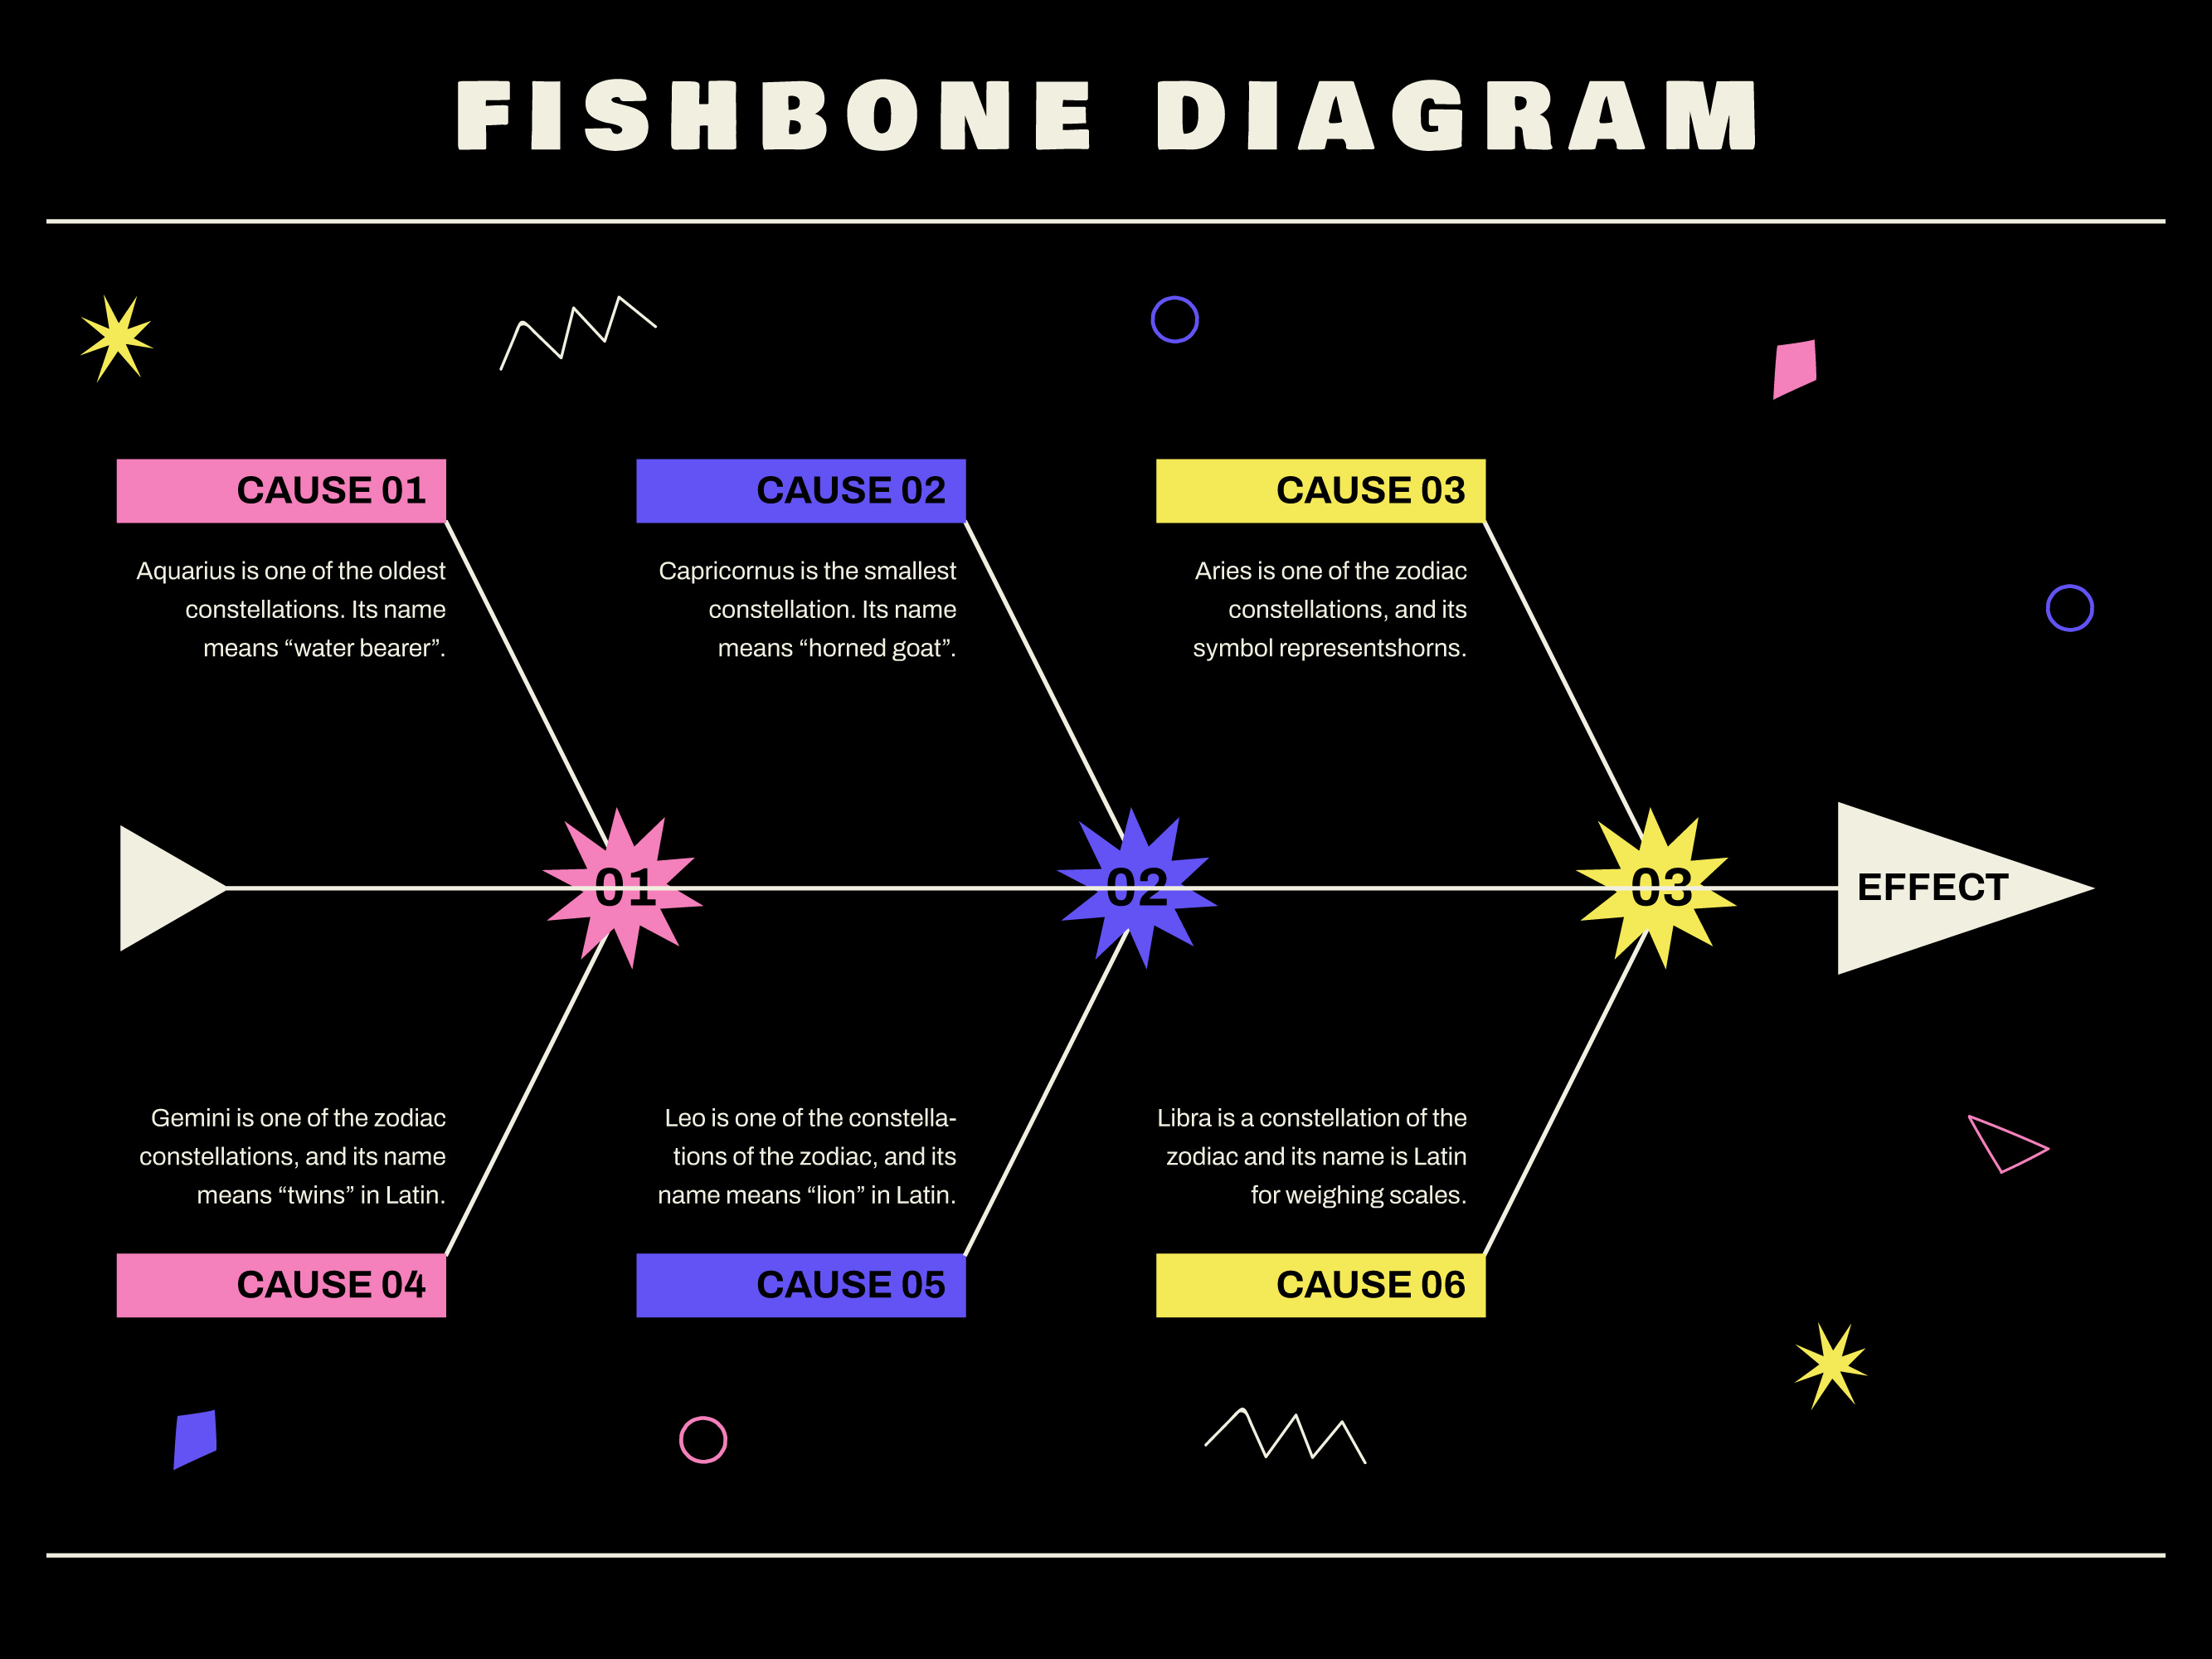
A Kanban fishbone diagram, also known as a "Kanban Ishikawa diagram," combines the principles of Kanban with the fishbone diagram, also called the Ishikawa or cause-and-effect diagram. This tool is used primarily in the context of process improvement, especially in manufacturing and software development.

Here's how you can create one:
Identify the Problem: Start by identifying the problem or the area you want to improve. This could be anything from production delays to software bugs.
Create Categories: Draw the head of the fishbone diagram, representing the problem. Then draw the main bones (lines) coming out of the head. These bones represent different categories or factors that could contribute to the problem. Common categories include People, Process, Equipment, Materials, and Environment.
Brainstorm Causes: For each category, brainstorm potential causes or factors that could contribute to the problem. These are represented as smaller bones branching off from the main bones.
Use Kanban Principles: Once you have identified the causes, you can use Kanban principles to manage and prioritize them. You can create Kanban cards for each cause and move them through your Kanban board as you investigate, address, or eliminate them.
Continuous Improvement: As you address causes and make improvements, continue to monitor the process and update the fishbone diagram accordingly. This helps in visualizing the progress and identifying new areas for improvement.
By combining Kanban with the fishbone diagram, you can visually represent the causes of a problem, prioritize them using Kanban principles, and systematically work towards solutions, fostering continuous improvement within your organization.
Use of kanban fishbone diagram
The Kanban fishbone diagram is a powerful tool for process improvement. It helps teams in various industries, such as manufacturing, software development, healthcare, and more, to:
Identify Root Causes: By visually mapping out the causes of a problem, teams can pinpoint the underlying issues affecting their workflow or product quality.
Prioritize Improvement Efforts: The Kanban board layout allows teams to prioritize causes based on their impact and urgency. This helps in allocating resources efficiently.
Facilitate Collaboration: Teams can collaborate effectively by brainstorming and discussing potential causes, fostering a culture of shared problem-solving.
Track Progress: Using Kanban principles, teams can track the progress of addressing each cause. They move Kanban cards representing causes across the board as they investigate, implement solutions, or validate improvements.
Drive Continuous Improvement: By continuously updating the Kanban fishbone diagram and addressing root causes, teams can iteratively improve their processes, leading to enhanced efficiency, quality, and customer satisfaction.
Enhance Transparency: The visual nature of the Kanban fishbone diagram promotes transparency within the team, as everyone can see the causes being addressed and their progress.
Support Data-Driven Decision-Making: Teams can use data to analyze the impact of different causes and make informed decisions about where to focus their improvement efforts.
Fishbone(Ishikawa) diagram & cause and effect diagram template
What is an Ishikawa Diagram?
An Ishikawa Diagram, also known as a Fishbone Diagram or Cause and Effect Diagram, is a tool used to identify the root causes of problems or issues in processes.

What is the purpose of a Fishbone Diagram?
The purpose of a Fishbone Diagram is to systematically identify and analyze the root causes of a problem to facilitate effective problem-solving and corrective actions.
What are the main components of an Ishikawa Diagram?
The main components are the "spine" (main line), the "bones" (categories of causes), and the "head" (the problem or effect being analyzed).
How is an Ishikawa Diagram different from other types of diagrams?
Unlike other diagrams that may show a sequence or flow of steps, the Ishikawa Diagram visually organizes potential causes into categories, which makes it ideal for root cause analysis.
What industries use Fishbone Diagrams?
Fishbone Diagrams are used in a wide variety of industries, including manufacturing, healthcare, education, and service sectors, to identify and solve problems in processes or systems.
How do you create an Ishikawa Diagram?
To create an Ishikawa Diagram, write the problem or effect at the head, draw a spine, and categorize the potential causes using "bones." Then, analyze the causes in more detail within each category.
What are the main categories of causes in a Fishbone Diagram?
Common categories include people, processes, machines, materials, environment, and management. These categories may vary depending on the context and the problem being analyzed.
What are some common causes listed in an Ishikawa Diagram?
Common causes include human error, inadequate training, faulty equipment, poor communication, unclear procedures, or inadequate resources.
How can an Ishikawa Diagram help with problem-solving?
The diagram helps by clearly identifying all potential causes of a problem, facilitating more effective problem-solving through a structured and collaborative analysis process.
What are the benefits of using a Fishbone Diagram?
Benefits include clarifying complex problems, facilitating team collaboration, identifying multiple causes, and guiding teams toward effective solutions for process improvements.
Can you use a Fishbone Diagram for root cause analysis?
Yes, Fishbone Diagrams are a widely used tool for root cause analysis, helping to trace problems to their root causes and avoid addressing only the symptoms.
Is the Ishikawa Diagram used for quality management?
Yes, the Ishikawa Diagram is often used in quality management to identify the causes of quality problems, improve product or service quality, and meet customer satisfaction goals.
Can an Ishikawa Diagram be used in non-manufacturing settings?
Yes, the Ishikawa Diagram is applicable in non-manufacturing sectors such as healthcare, IT, service industries, and education to analyze problems and improve systems.
What software tools can be used to create an Ishikawa Diagram?
There are various tools available, including Microsoft Visio, Lucidchart, SmartDraw, and online tools like Creately, which offer templates for creating Fishbone Diagrams.
How do you analyze the results from an Ishikawa Diagram?
After constructing the diagram, analyze the causes in each category by discussing them with the team, conducting further research, and prioritizing the causes that contribute most to the problem.
Can an Ishikawa Diagram be applied to team-based problem-solving?
Yes, it is an excellent tool for team-based problem-solving as it encourages collaboration, helps gather diverse perspectives, and ensures all possible causes are considered.
How detailed should the cause categories in an Ishikawa Diagram be?
The cause categories should be detailed enough to capture all significant contributing factors, but not so detailed that the diagram becomes overwhelming or difficult to analyze.
What is the relationship between Fishbone Diagrams and Six Sigma?
Fishbone Diagrams are often used in Six Sigma as a part of the Define, Measure, Analyze, Improve, and Control (DMAIC) methodology to identify root causes of defects and variability in processes.
What are some examples of an Ishikawa Diagram in action?
Examples include analyzing defects in a production line, identifying causes of delays in service delivery, or pinpointing factors contributing to poor customer satisfaction in a call center.
What are the limitations of an Ishikawa Diagram?
Limitations include potential oversimplification of complex issues, the need for accurate data, and the risk of missing causes if the diagram is not sufficiently detailed or collaborative.