Fishbone Analysis, also known as Ishikawa Diagram or Cause and Effect Diagram, is a powerful tool used to identify the root causes of a problem. This visual representation helps teams systematically analyze and organize potential causes contributing to a particular issue. The diagram resembles a fish’s skeleton, hence the name, with the main spine representing the problem and the “bones” branching out to display the possible causes. This method is particularly effective in solving complex problems by focusing on specific contributing factors.
What is Fishbone Analysis?
Fishbone Analysis is a problem-solving technique that involves brainstorming potential causes of an issue, categorizing them into different areas, and identifying root causes. It was developed by Dr. Kaoru Ishikawa, a Japanese quality management expert, in the 1960s. The Fishbone Diagram is an essential tool in Six Sigma, Total Quality Management (TQM), and Lean Manufacturing methodologies. It helps teams pinpoint underlying problems within processes that could lead to inefficiencies, defects, or failures.
Key Components of a Fishbone Diagram
A typical Fishbone Diagram consists of the following components:
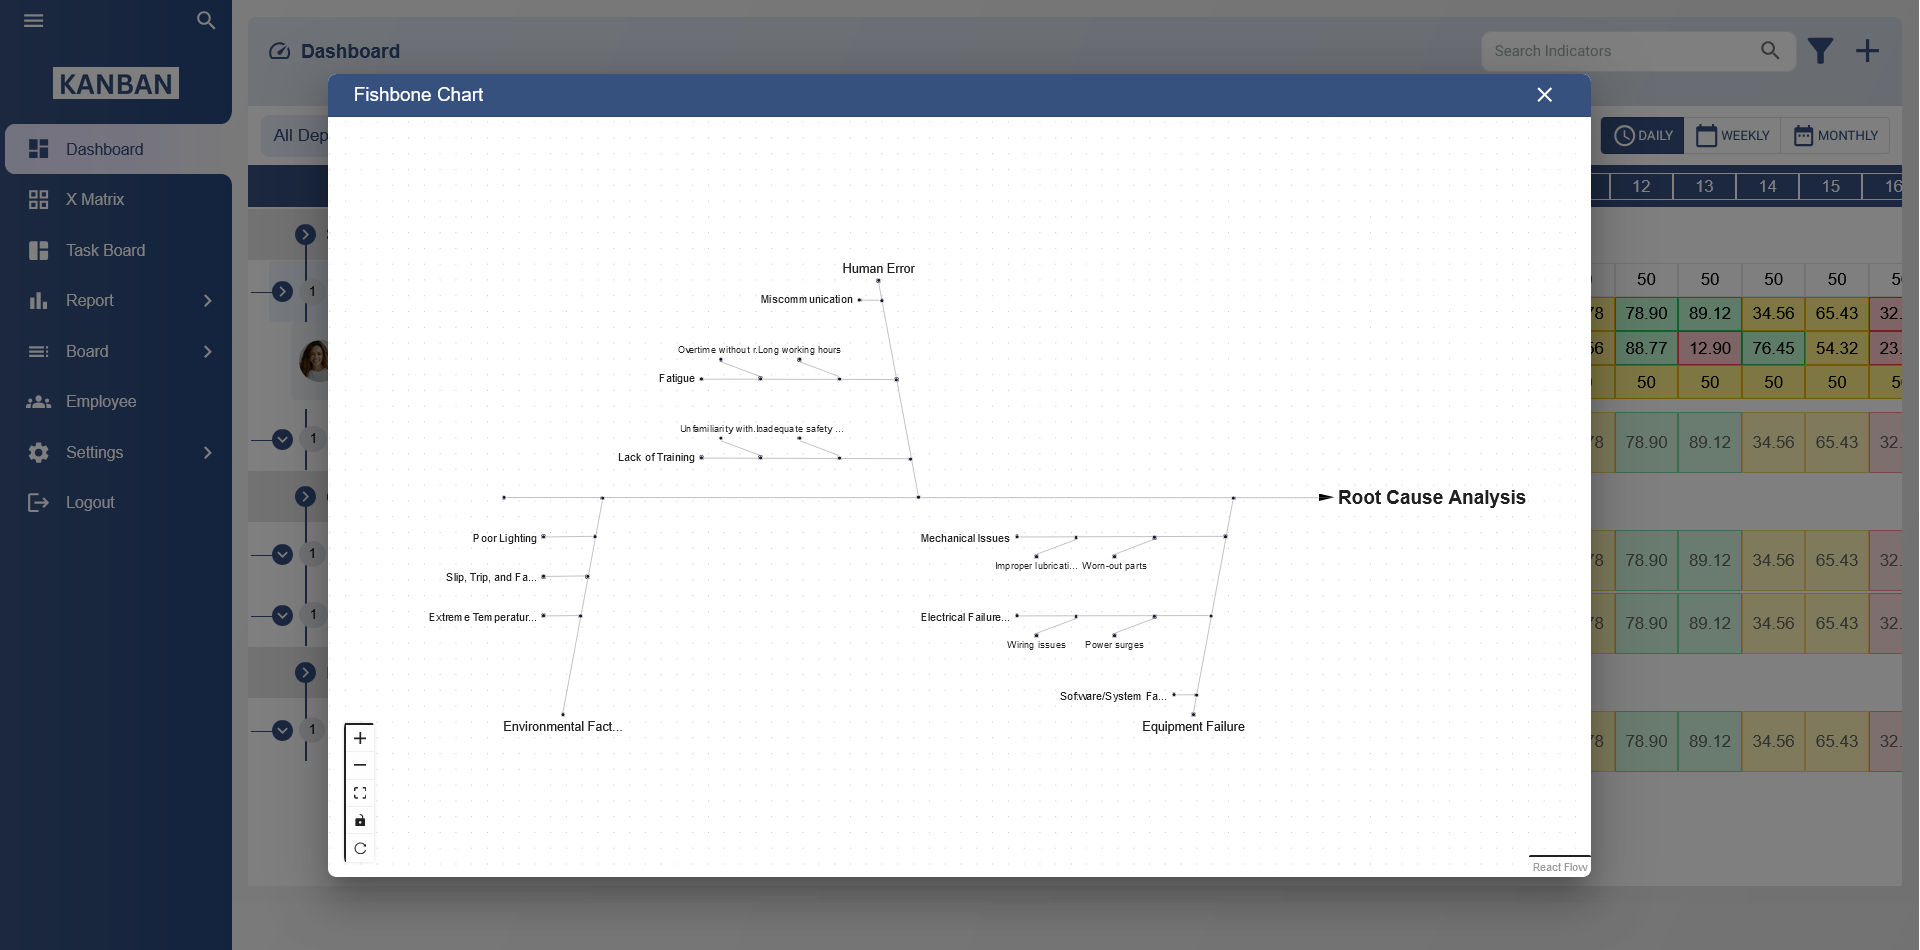
- Head: The problem or effect being analyzed is placed at the head or the right end of the diagram.
- Spine: The main horizontal line that connects all the bones. This represents the central issue or problem.
- Bones: Diagonal lines branching off the spine, which represent the categories of potential causes contributing to the issue.
- Sub-branches: Smaller branches connected to the bones, which represent the individual causes or factors identified within each category.
Steps to Create a Fishbone Diagram
Creating a Fishbone Diagram involves several steps:
1. Define the Problem
The first step is to clearly define the problem or effect you want to analyze. The issue should be framed in a concise statement that clearly represents the problem at hand. Write this problem at the head of the diagram, at the far-right end.
2. Identify Major Categories
Next, identify the major categories that could potentially contribute to the problem. These categories help organize the causes into manageable sections. Common categories include:
- People: Issues related to human factors, such as training, skills, or communication.
- Processes: Problems in workflow, procedures, or systems.
- Materials: Issues with raw materials, components, or supplies.
- Machines: Problems with equipment, tools, or technology.
- Environment: External factors like workspace, temperature, or regulatory requirements.
- Measurement: Problems with data collection, analysis, or metrics used in the process.
3. Brainstorm Possible Causes
With the categories in place, brainstorm potential causes for each category. This involves gathering input from team members, stakeholders, or subject matter experts. Use open-ended questions to dig deeper into the reasons behind the problem. For example:
- Why is this issue occurring?
- What could be the contributing factors?
- What processes or systems might be involved?
4. Organize Causes into the Diagram
Start by drawing a horizontal line, the spine, and write the problem statement on the right end. Then, draw the main branches (bones) representing each of the major categories. Add smaller branches (sub-branches) to each category, which will represent the potential causes you identified during the brainstorming session. Each cause can further branch out into more specific details if necessary.
5. Analyze and Identify Root Causes
Once the diagram is complete, examine the various causes and evaluate them to determine which ones are the most likely contributors to the problem. Look for patterns, trends, or repeating themes across categories. Identify the root causes that require attention and focus on addressing them in your improvement efforts.
Benefits of Fishbone Analysis
Fishbone Analysis offers several advantages for problem-solving and process improvement:
- Clear Visual Representation: The Fishbone Diagram provides a visual way to organize and display causes, making it easy to see how different factors contribute to the problem.
- Systematic Approach: The method encourages a thorough and structured analysis of the problem, ensuring that no potential cause is overlooked.
- Collaboration: Fishbone Analysis promotes collaboration and team involvement, bringing different perspectives into the problem-solving process.
- Root Cause Identification: It helps teams move beyond surface-level symptoms to uncover the root causes that are truly responsible for the issue.
- Improved Problem-Solving: By focusing on causes rather than symptoms, Fishbone Analysis enables teams to develop more effective and long-lasting solutions.
Applications of Fishbone Analysis
Fishbone Analysis is widely used in various industries and applications, such as:
- Quality Control: In manufacturing and service industries, Fishbone Diagrams help identify causes of defects, errors, or quality issues in products or services.
- Process Improvement: Organizations use Fishbone Analysis to identify inefficiencies in processes and develop strategies for continuous improvement.
- Root Cause Analysis: Fishbone Diagrams are a common tool for conducting root cause analysis in fields like healthcare, engineering, and supply chain management.
- Project Management: Project managers use Fishbone Analysis to identify risks, bottlenecks, or potential obstacles that could impact project success.
- Employee Training: It can also be used in training programs to help employees understand problem-solving techniques and encourage critical thinking.
What is Fishbone Analysis?
Fishbone Analysis, also known as the Ishikawa diagram, is a visual tool used to systematically identify the root causes of a problem. It categorizes potential causes to help understand the underlying issues affecting the problem.
What are the benefits of using Fishbone Analysis?
Fishbone Analysis helps teams identify root causes, organize contributing factors, and systematically approach problem-solving. It promotes a clear understanding of complex issues and encourages collaboration among team members.
What are the main categories in Fishbone Analysis?
The main categories often used in Fishbone Analysis include: People, Processes, Equipment, Materials, Environment, and Management. These categories help organize potential causes in a structured manner.
How does Fishbone Analysis help in problem-solving?
Fishbone Analysis helps identify potential causes of a problem by visually breaking down the contributing factors. This ensures that solutions target the root causes rather than just addressing symptoms.
What industries benefit from using Fishbone Analysis?
Fishbone Analysis is widely used across various industries, including manufacturing, healthcare, service industries, and education, to improve quality, troubleshoot issues, and optimize processes.
How do you construct a Fishbone diagram?
To construct a Fishbone diagram, start by drawing a horizontal line (the "spine") and then branch out with lines representing categories of potential causes. Each branch should include specific factors that contribute to the problem.
What are the key components of a Fishbone diagram?
The key components of a Fishbone diagram include the problem statement (the "head" of the fish), the main categories of causes (the "bones"), and specific causes that contribute to the issue (the smaller branches).
When is Fishbone Analysis typically used?
Fishbone Analysis is typically used when a team needs to investigate complex problems, especially when the root cause is unclear, and the issue cannot be solved by simply addressing surface-level symptoms.
How does Fishbone Analysis identify root causes?
Fishbone Analysis identifies root causes by visually categorizing potential contributing factors, encouraging team members to brainstorm and delve deeper into the underlying reasons behind the problem.
What is the role of brainstorming in Fishbone Analysis?
Brainstorming plays a crucial role in Fishbone Analysis by encouraging team members to contribute ideas on potential causes of the problem, which are then organized into categories for deeper analysis.
How does Fishbone Analysis differ from other problem-solving methods?
Unlike other methods, Fishbone Analysis focuses on visualizing all potential causes and categorizing them systematically. This makes it easier to identify the root cause and develop targeted solutions rather than applying general fixes.
What are common problems Fishbone Analysis can address?
Fishbone Analysis can address a wide range of problems, including quality issues, process inefficiencies, customer complaints, production delays, and equipment malfunctions, among others.
How can Fishbone Analysis improve team collaboration?
Fishbone Analysis fosters collaboration by encouraging input from all team members, ensuring that diverse perspectives are considered when identifying the root causes of a problem.
Can Fishbone Analysis be used in conjunction with other quality management tools?
Yes, Fishbone Analysis can be used alongside other quality management tools like Pareto analysis, control charts, or failure mode analysis to provide a more comprehensive problem-solving approach.
What are the limitations of Fishbone Analysis?
Fishbone Analysis may not always identify the most critical cause immediately, especially in complex situations. It requires thorough brainstorming, and the effectiveness depends on the team's understanding of the problem.