What Is OEE and How Does It Measure Manufacturing Performance?
Understanding OEE in Simple Terms
OEE stands for Overall Equipment Effectiveness. It is a key metric used in manufacturing to measure how well a machine, line, or entire plant is performing. OEE takes into account three important factors: availability, performance, and quality. These give a complete picture of how efficiently production is running.
Availability: Minimising Downtime
This factor looks at how often equipment is available when needed. Unplanned stops, breakdowns, or long changeovers reduce availability. Measuring availability helps identify where downtime occurs and encourages actions to keep machines running smoothly for longer periods.
Performance: Running at the Right Speed
Even when machines are running, they may not operate at full speed. Performance measures how quickly work is completed compared to the ideal cycle time. If machines are running slower than expected, it can point to process inefficiencies or the need for maintenance.
Quality: Reducing Defects and Rework
Quality looks at the number of good parts produced compared to the total output. If a high number of items are rejected or need rework, it lowers the OEE score. Tracking quality helps identify where errors are happening so improvements can be made to reduce waste.
The Power of a Single Score
OEE combines all three factors into one percentage. A perfect score is 100%, meaning zero losses. Most operations aim for steady improvement by tracking and boosting their OEE score over time.
The Three Pillars of OEE: Availability, Performance, and Quality
Availability: Keeping Machines Ready to Run
Availability measures the time that equipment is actually running compared to the planned production time. If a machine is down due to breakdowns, maintenance, or changeovers, it lowers the availability score. By tracking this, teams can identify where downtime occurs most and take steps to reduce it, improving overall production efficiency.
Performance: Running at the Right Speed
Even when machines are running, they may not always be working at full speed. Performance looks at the actual output compared to the ideal output, based on the fastest possible cycle time. Delays due to slow operations, small stops, or minor faults affect performance. Monitoring this helps teams spot where improvements can speed up production without adding stress or errors.
Quality: Getting It Right the First Time
Quality measures how many parts produced are usable without needing rework or repair. If products are rejected or require fixing, it reduces the quality score. By focusing on quality, teams can identify where defects are happening and improve processes to reduce scrap and waste, which saves time and materials.
Bringing It All Together
These three pillars—availability, performance, and quality—combine to form the full OEE score. Each one shows a different part of the production process, helping teams understand where they are strong and where they need to improve.
Why Digital OEE Tools Outperform Manual Spreadsheets
Real-Time Data Collection
Digital OEE tools automatically collect data directly from machines or operators in real time. This means that production performance is always up to date, without waiting for manual input. In contrast, spreadsheets often rely on delayed entries, which can lead to outdated or inaccurate insights.
Reduced Human Error
Manual spreadsheets are prone to mistakes—wrong formulas, missed data, or typing errors. These small issues can distort the overall OEE score. Digital tools eliminate these risks by automating calculations and ensuring standardised data entry across shifts and teams.
Instant Visual Reporting
With built-in dashboards and charts, digital systems offer instant visuals of performance trends. Teams can see problems as they happen, not after the shift ends. Spreadsheets, by comparison, take more time to update and often require extra effort to create visual reports.
Easier Historical Analysis
Digital OEE tools store data over time, making it easy to spot long-term patterns or recurring problems. Teams can review past performance without digging through old files. Spreadsheets can become cluttered and harder to manage the longer they're used.
Faster Decision-Making
Since digital systems provide up-to-date insights, managers can make informed decisions quickly. This helps resolve issues faster, reduce downtime, and improve performance. In contrast, spreadsheet-based reviews may lead to slower reactions and missed improvement opportunities.
Spotting Inefficiencies Early with Real-Time OEE Monitoring
Immediate Visibility into Production Health
Real-time OEE monitoring allows teams to track performance as it happens. Instead of waiting until the end of the day or shift, issues such as slow cycle times, unplanned stops, or rising defect rates are seen immediately. This visibility helps teams take quick action before minor issues grow into bigger problems.
Faster Reaction to Downtime
When downtime occurs, real-time alerts notify operators and managers instantly. This means corrective steps can be taken right away, reducing the total time machines sit idle. By addressing downtime as it happens, production flow stays more consistent and output remains on track.
Identifying Trends Before They Impact Output
Live performance data highlights small drops in efficiency that may not be obvious during manual checks. A gradual slowdown or repeated minor stops can be early signs of a developing problem. Real-time tracking helps detect these trends so teams can investigate and solve the issue early.
Boosting Team Accountability and Engagement
When teams can see the live impact of their work on the overall performance score, it encourages greater ownership. Operators are more likely to stay engaged and make improvements when they can track their own impact in real time, leading to a stronger continuous improvement culture.
How OEE Software Helps Reduce Machine Downtime
Instant Detection of Equipment Stops
OEE software tracks machine performance in real time and quickly detects when a stop occurs. This immediate visibility allows operators and supervisors to respond faster, reducing the time a machine sits idle. Early alerts mean problems can be addressed before they escalate into longer delays.
Root Cause Analysis Made Easier
When downtime happens, OEE tools record detailed information about the cause. This could include planned maintenance, unexpected breakdowns, or setup delays. Having this data readily available helps teams identify recurring issues and target them directly, reducing the chances of repeat failures.
Tracking Maintenance and Repair Trends
With historical data stored over time, OEE software can highlight patterns in downtime events. If a certain piece of equipment regularly breaks down after a set number of hours, preventive maintenance can be scheduled proactively. This reduces surprise stoppages and improves overall uptime.
Encouraging Proactive Responses
Real-time dashboards give teams live access to availability metrics. When they see a drop in performance, they can step in immediately to correct the issue. This encourages a proactive approach, where small issues are solved early, rather than reacting after damage is already done.
Better Planning with Reliable Data
Because downtime is tracked accurately, planners and managers can make smarter decisions about staffing, schedules, and machine loads. This helps avoid overworking certain machines and keeps production balanced across all resources.
Improving Shift Efficiency Through Accurate OEE Data
Clear Performance Visibility for Each Shift
Accurate OEE data gives a detailed view of how each shift is performing. Teams can track key metrics like availability, performance, and quality in real time. This allows supervisors to quickly identify if a shift is falling behind, helping them take timely action to stay on schedule.
Identifying Shift-Based Variations
By comparing OEE data between different shifts, it's easier to spot inconsistencies. If one shift consistently shows lower output or more downtime, it could highlight training needs, process issues, or equipment handling differences. Addressing these gaps leads to more balanced productivity across all hours.
Faster Shift Handovers
When OEE data is up to date and clearly displayed, shift handovers become smoother. Incoming teams can quickly see what has been done, what is pending, and where any issues occurred. This reduces confusion, shortens handover time, and keeps operations moving without delay.
Boosting Accountability and Motivation
When team members can see how their actions affect performance metrics, it builds a sense of ownership. Accurate data encourages friendly competition and motivates teams to improve. It also helps managers recognise high-performing shifts and provide support where needed.
Supporting Continuous Improvement Goals
Reliable OEE data provides a foundation for making informed decisions. Whether it's adjusting shift patterns, improving training, or refining workflows, accurate information ensures that changes lead to real improvements in shift efficiency.
Using OEE to Support Lean Manufacturing and Continuous Improvement
Aligning OEE with Lean Principles
OEE fits perfectly within lean manufacturing because it focuses on reducing waste and maximising value. By tracking availability, performance, and quality, OEE helps identify areas where time, resources, or effort are being lost. This allows teams to target improvements that have the greatest impact on productivity and cost savings.
Eliminating the Six Big Losses
OEE data helps expose the six common types of losses in manufacturing: equipment failure, setup and adjustments, idling and minor stops, reduced speed, defects, and start-up losses. By measuring these issues, teams can create focused action plans to reduce or eliminate them, which is a core goal of lean.
Supporting Kaizen and Continuous Improvement
OEE provides a clear, consistent way to track progress over time. When teams make small changes to improve performance, OEE metrics show whether those changes are working. This supports a continuous improvement mindset, where decisions are based on facts, not guesswork.
Improving Process Standardisation
As teams work to boost their OEE score, they naturally move toward more consistent and standardised processes. This improves overall quality and reduces variation. OEE also helps set realistic targets and maintain high-performance standards across different shifts and sites.
Driving a Culture of Accountability
OEE encourages everyone, from operators to managers, to stay focused on performance. When data is visible and shared, it creates a sense of shared responsibility, which is essential for any successful lean or improvement initiative.
How OEE Metrics Help Teams Make Smarter, Faster Decisions
Turning Real-Time Data into Action
OEE metrics provide up-to-date insights into how machines and production lines are performing. When teams have access to this data in real time, they can quickly spot issues like unexpected downtime, slow cycle times, or rising defect rates. This allows immediate decisions that help prevent small problems from becoming bigger ones.
Removing the Guesswork from Problem-Solving
Instead of relying on assumptions, teams can use OEE data to identify the root causes of performance drops. Whether it’s a recurring equipment issue or a specific shift underperforming, the data offers clarity. This makes decision-making faster and more accurate, leading to better outcomes.
Improving Daily Stand-Ups and Team Meetings
With OEE dashboards, daily meetings become more focused. Teams can review the latest performance figures, set clear priorities, and assign follow-up actions. Everyone sees the same facts, reducing confusion and helping everyone align on goals and expectations for the day ahead.
Supporting Strategic Planning
Beyond day-to-day decisions, OEE trends help managers plan longer-term improvements. They can prioritise investments, adjust staffing, or change production plans based on real performance data. This supports smarter planning that aligns with actual factory performance.
Boosting Confidence and Accountability
When decisions are based on data everyone can see and trust, teams are more confident in the actions they take. OEE metrics also help track the results of those actions, encouraging accountability and ongoing improvement.
Track and Compare OEE Scores Across Lines, Machines, or Teams
Creating a Clear Performance Overview
Tracking OEE scores across different production lines, machines, or teams allows you to build a complete view of your factory’s performance. With standardised data from all areas, you can easily spot which parts of the operation are running well and where improvements are needed.
Identifying Top and Low Performers
When OEE data is compared side by side, it becomes clear which machines or teams are achieving the best results. This helps set benchmarks for others to follow. You can also see where performance is lagging, making it easier to focus support and resources on areas that need the most attention.
Encouraging Healthy Competition
Displaying OEE scores publicly across shifts or teams can encourage friendly competition. When teams see how their performance compares to others, it motivates them to improve. This promotes a culture of accountability and continuous improvement across the workforce.
Highlighting Consistency and Reliability
OEE tracking over time reveals which machines or lines consistently meet expectations. This helps in planning, as reliable equipment can be given more load, while underperforming machines can be scheduled for maintenance or upgrades to boost efficiency.
Supporting Smarter Operational Decisions
With clear comparisons, managers can make better decisions on scheduling, staffing, and equipment use. Data-backed insights ensure resources are used wisely, and any gaps in performance are addressed with targeted actions.
Setting Realistic Production Targets Based on OEE Insights
Using OEE Data as a Performance Baseline
OEE metrics provide a reliable starting point for setting production targets. By understanding your current levels of availability, performance, and quality, you can create goals that reflect what your machines and teams are truly capable of. This avoids setting targets that are either too high or too low.
Tracking Capacity and Efficiency Together
OEE insights show how much of your available time is being used effectively. This allows managers to align production goals with actual capacity, taking into account planned downtime, slowdowns, and quality losses. Targets become more accurate and achievable when based on real data rather than estimates.
Adjusting Targets Based on Shifts or Machines
Different teams, lines, or machines may perform at varying levels. OEE data makes it easy to customise targets for each area, depending on past performance. This approach helps avoid unrealistic expectations and supports fair, data-driven planning across departments.
Improving Planning and Scheduling
When production goals are backed by OEE analysis, it becomes easier to build realistic schedules. You can avoid overloading equipment or pushing teams beyond their limits. Instead, you focus on steady, sustainable performance that encourages quality and consistency.
Supporting Continuous Improvement
As OEE scores improve over time, production targets can be adjusted to reflect progress. This keeps goals aligned with actual improvements, motivating teams and reinforcing a continuous improvement mindset on the shop floor.
OEE Software and Its Role in Predictive Maintenance
Linking Equipment Performance with Maintenance Needs
OEE software tracks how machines are performing in real time, making it easier to detect patterns that may lead to breakdowns. When availability or performance suddenly drops, it can signal early signs of equipment wear. This insight helps maintenance teams take action before a failure occurs.
Using Data to Plan Maintenance Strategically
Instead of waiting for a machine to fail, predictive maintenance uses OEE trends to schedule service at the right time. For example, if a drop in speed or a rise in minor stops is observed, it may point to the need for cleaning, lubrication, or part replacement. This prevents unexpected downtime and supports smoother operations.
Reducing Unplanned Downtime
By acting on the early warnings provided by OEE software, manufacturers can reduce the number of urgent repairs. This not only improves machine uptime but also allows maintenance work to be completed during scheduled breaks or quieter shifts, causing less disruption.
Extending Equipment Life
Regular and timely maintenance, guided by performance data, reduces long-term wear and tear. Machines that are well cared for last longer and perform more consistently, saving money on costly replacements or major overhauls.
Creating a Preventive Culture
OEE software encourages a proactive mindset across the production floor. When teams regularly review performance data, they are more likely to act early, maintain standards, and keep equipment in peak condition over time.
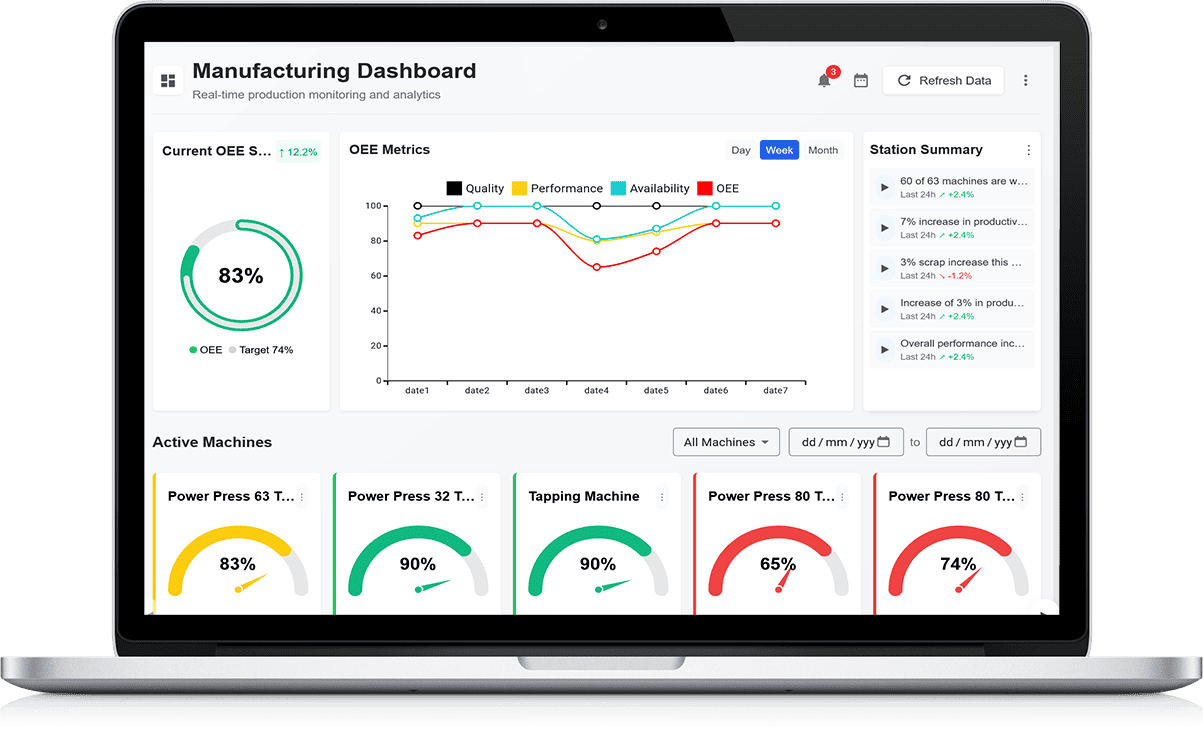
Visualising Your Factory Floor’s Health with OEE Dashboards
Bringing Performance Data to Life
OEE dashboards offer a clear, visual way to understand how your factory is performing. Instead of digging through spreadsheets or reports, teams can see live data on machine availability, performance rates, and quality levels—all in one place. This instant clarity helps everyone stay informed and aligned.
Spotting Issues at a Glance
Colour-coded charts, graphs, and indicators on OEE dashboards make it easy to spot problems as they happen. A sudden drop in performance or a rise in defects becomes immediately visible. This allows quick response and reduces the risk of delays or poor output going unnoticed.
Monitoring Multiple Areas in Real Time
Dashboards can be set up to show OEE data for different machines, lines, or shifts. This gives managers a full view of the factory floor’s health without needing to walk from station to station. It also supports faster decisions by showing where attention is needed most.
Supporting Daily Meetings and Reviews
Displaying OEE dashboards during team huddles or shift handovers helps guide discussion. Everyone can see what’s working well and what needs fixing. This keeps meetings focused, productive, and based on real performance, not opinions.
Encouraging Team Engagement
When workers see how their efforts impact the overall dashboard, it creates a stronger sense of ownership. Real-time visibility motivates teams to stay on target and continuously look for ways to improve production outcomes.
How OEE Helps Improve Operator Accountability and Engagement
Making Performance Visible to Everyone
OEE data shows clear, real-time insights into how machines and processes are running. When operators can see how their actions impact availability, performance, and quality scores, they become more aware of their role in overall success. This visibility builds ownership and encourages consistent performance.
Encouraging a Results-Driven Mindset
With OEE dashboards in view, operators are naturally more focused on keeping their work areas efficient. Instead of waiting for issues to be noticed by managers, they are empowered to take early action. This builds a culture where each person plays an active part in maintaining high standards.
Providing Clear and Fair Feedback
OEE metrics offer an objective way to review performance. Operators receive clear feedback based on real numbers, not assumptions. This helps create trust and encourages open discussions about what’s working and where improvements are needed—without placing blame.
Highlighting and Celebrating Success
When OEE scores improve, it’s a direct result of better focus, fewer delays, and higher quality output. Recognising teams or individuals who help raise these numbers helps build morale. It also shows that everyone’s efforts matter and are being noticed.
Supporting Skill Development
By tracking detailed OEE data, supervisors can identify training needs. Operators who struggle with certain tasks can be supported with coaching, while those who excel can take on more responsibility. This strengthens engagement and career growth over time.
The ROI of Implementing OEE Software in Your Production Process
Unlocking Hidden Production Potential
OEE software helps reveal inefficiencies that often go unnoticed. By tracking availability, performance, and quality, it uncovers exactly where time and resources are being lost. Once these losses are identified, they can be addressed quickly—boosting output without increasing costs or equipment.
Reducing Unplanned Downtime
One of the fastest returns on investment comes from lowering unexpected machine stoppages. OEE tools provide early alerts and performance trends that allow teams to act before issues lead to costly delays. Even small reductions in downtime can lead to big savings over time.
Improving Workforce Productivity
With clear, real-time feedback on how machines and teams are performing, operators stay more engaged and focused. This leads to smoother workflows, fewer errors, and better use of labour across shifts—all of which contribute to a stronger return on operational investment.
Better Planning, Less Waste
Accurate OEE data supports smarter decisions around production planning, staffing, and maintenance scheduling. It helps eliminate overproduction, reduce excess inventory, and cut energy use—delivering long-term cost savings while improving quality and delivery timelines.
Faster Decision-Making with Reliable Data
When managers have real-time access to performance insights, they can respond to problems quickly and confidently. This results in more agile operations and avoids delays that impact profitability. Over time, this speed and precision help increase the return on your technology investment.
Integrating OEE Tools with ERP, MES, and Production Monitoring Systems
Creating a Connected Manufacturing Environment
Integrating OEE tools with your existing ERP and MES systems allows for a seamless flow of data across departments. It helps link production performance with planning, scheduling, and resource management, giving everyone access to accurate and real-time information.
Streamlining Data Collection and Analysis
When OEE tools are connected to production monitoring systems, data is automatically collected from machines and processes. This reduces manual entry, avoids errors, and speeds up reporting. Real-time insights help operators and managers respond faster to issues on the shop floor.
Improving Decision-Making Across the Business
With integration, performance data from OEE tools feeds into planning and reporting tools used by operations, maintenance, and leadership teams. This supports smarter forecasting, better shift planning, and informed decisions about maintenance schedules or capital investments.
Aligning Performance Goals with Business Objectives
OEE integration helps connect shop floor activity to higher-level business goals. It ensures that daily actions and improvements are aligned with company-wide targets for quality, output, and efficiency. This improves strategic focus and accountability at every level.
Boosting Productivity Through Automation
By linking systems, many routine tasks—like generating reports or tracking downtime reasons—can be automated. This frees up time for staff to focus on continuous improvement while ensuring that critical information is always up to date and easy to access.