A Kanban Cumulative Flow Diagram (CFD) is a visual tool used in Kanban project management systems to track the flow of work through various stages of a process. It provides a clear and intuitive representation of how tasks or work items are progressing, highlighting trends and potential bottlenecks in the workflow. The cumulative flow diagram is an essential tool for teams using Kanban, as it offers insights into the current state of work and helps in making data-driven decisions to improve efficiency and throughput.
Understanding the Components of a Kanban Cumulative Flow Diagram
The CFD typically contains several key components that offer valuable insights into the work process:
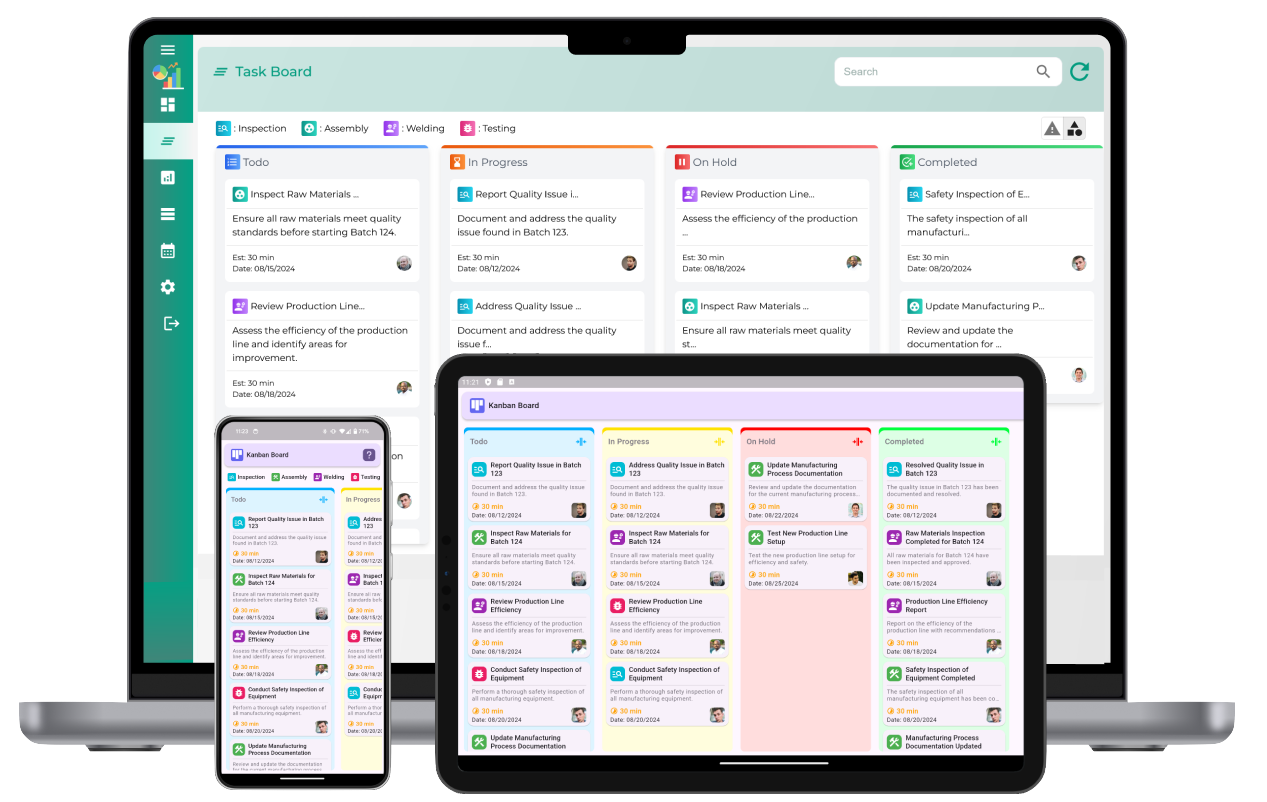
- Work Stages: These are the different stages of the workflow, which are usually represented as columns. Common stages might include "To Do," "In Progress," and "Completed," but these can vary depending on the specific process or team needs.
- Time: The horizontal axis represents time, which can be tracked over days, weeks, or months, depending on the needs of the team or project. This helps in monitoring trends and understanding how quickly work is moving through each stage.
- Work Items: The vertical axis shows the number of work items that have been completed, are in progress, or are still waiting to start. The height of each colored band in the diagram corresponds to the number of items at each stage at a given point in time.
- Colored Bands: Each band represents a different stage of the workflow, and the width of the band indicates the cumulative count of work items in that stage. As items move through the workflow, the width of the colored bands will change, providing a visual representation of progress.
How to Read a Kanban Cumulative Flow Diagram
Reading a CFD can be straightforward once you understand the layout and what each component represents:
- Steady Flow: Ideally, the CFD will show a consistent flow of work through the stages. If all stages are growing at the same pace, it means work is flowing smoothly from start to finish.
- Identifying Bottlenecks: If a particular stage in the diagram shows a growing band while others remain relatively flat, it could indicate a bottleneck in that part of the process. This could be an area where work is getting stuck or delayed.
- Lead Time and Cycle Time: By analyzing the shape and slope of the bands, teams can estimate the lead time (the total time from when a work item is requested to when it is completed) and cycle time (the time it takes to complete the task once work has begun). Shorter, more consistent slopes are ideal, as they suggest faster throughput and shorter times for completing work.
- Work in Progress (WIP): The diagram helps monitor WIP limits, as it shows the number of items at each stage. If the WIP number becomes too large, it can lead to bottlenecks and slower flow of work.
Benefits of Using a Kanban Cumulative Flow Diagram
The Kanban Cumulative Flow Diagram is a powerful tool that offers several benefits to teams, including:
- Visual Insight: The CFD provides a quick, visual snapshot of the entire workflow. This makes it easier to understand the state of the project or process at a glance, allowing teams to act on information quickly.
- Early Detection of Issues: The diagram highlights bottlenecks, delays, and other issues early on, allowing teams to address them before they become more significant problems. Identifying problems early helps improve workflow efficiency.
- Improved Decision-Making: With the data provided by the CFD, teams can make more informed decisions regarding resource allocation, workload distribution, and process improvements. The visual nature of the CFD makes it easier to spot areas that need attention.
- Monitoring Performance: The CFD allows teams to track their performance over time. By comparing the flow of work over different time periods, teams can identify trends and assess whether changes or improvements are having a positive effect on their workflow.
- Optimizing Workflows: By continuously monitoring the CFD, teams can fine-tune their processes, limit work in progress, and improve throughput. The data helps teams avoid overloading any part of the system and ensures a balanced workload across stages.
How to Implement a Kanban Cumulative Flow Diagram
To implement a CFD, follow these steps:
- Define Workflow Stages: Start by clearly defining the stages in your workflow. For example, you might have stages like "Backlog," "In Progress," and "Completed." Ensure these stages reflect the true progression of work.
- Track Work Items: As work items progress through the stages, track their movement. You can either do this manually or use project management tools to automatically update the diagram in real time.
- Update the CFD Regularly: Regularly update the CFD to reflect the most recent data. This will help you track changes over time and gain valuable insights into the state of the workflow.
- Analyze the Data: Review the CFD regularly to identify trends, bottlenecks, and areas for improvement. Use the diagram to make data-driven decisions to optimize workflow and address issues.
- Act on Insights: Take action based on the insights you gain from the CFD. For example, if you notice a bottleneck in one stage, allocate more resources to that stage or limit WIP to reduce delays.
What Is a Kanban Cumulative Flow Diagram?
What is a Kanban Cumulative Flow Diagram (CFD)?
A Kanban Cumulative Flow Diagram (CFD) is a visual tool that displays the flow of work across different stages in a Kanban system over time, showing the amount of work in each state (e.g., "To Do," "In Progress," "Completed").
How does a Cumulative Flow Diagram work in Kanban?
The Cumulative Flow Diagram tracks the quantity of work items in each stage of the Kanban system. It shows how tasks move through the system, helping teams monitor progress and spot inefficiencies in real-time.
What are the key components of a Cumulative Flow Diagram?
The key components include the stages of work (such as "To Do," "In Progress," and "Completed"), the number of tasks in each stage, and the time period over which the tasks are tracked, often displayed as a graph or chart.
How do you interpret a Cumulative Flow Diagram?
You interpret a CFD by analyzing the distribution of tasks across different stages. A smooth flow indicates that tasks are progressing efficiently, while uneven areas or bottlenecks may signal delays or inefficiencies in the workflow.
What does the different color coding in a CFD represent?
In a CFD, different colors represent different stages of the workflow. For example, blue might indicate tasks in the "To Do" stage, orange for "In Progress," and green for "Completed." The colors help quickly distinguish between different work states.
How can a CFD help in identifying bottlenecks in a Kanban system?
A CFD helps identify bottlenecks by showing areas where the flow of tasks is stalled or building up. For example, if a large number of tasks are stuck in the "In Progress" stage, it may indicate a resource shortage or process inefficiency.
What is the significance of the “To Do” stage in a Cumulative Flow Diagram?
The "To Do" stage represents tasks that have yet to be started. A high number of tasks in this stage may suggest a backlog, while an empty "To Do" stage might indicate that there aren’t enough tasks being initiated.
How does a CFD help in improving flow and efficiency?
A CFD highlights workflow bottlenecks and inefficiencies, allowing teams to take corrective action to improve task flow, balance workloads, and ensure timely completion of tasks, ultimately improving overall system efficiency.
Can a Cumulative Flow Diagram be used to predict project delivery dates?
While a CFD helps track progress, it can also provide insight into how long it might take to complete tasks based on current flow rates, helping estimate potential delivery dates. However, it should be combined with other metrics for better accuracy.
What does a healthy Cumulative Flow Diagram look like?
A healthy CFD shows smooth, consistent progress with minimal fluctuations. The stages should gradually fill and empty, without excessive buildup in any particular column, indicating that work is moving efficiently through the system.
How can you use a CFD to balance workload in a Kanban system?
By analyzing the CFD, teams can spot stages where work is accumulating, indicating a bottleneck. This insight can help balance the workload by redistributing tasks or addressing resource issues, ensuring a smoother workflow.
What is the role of the “In Progress” stage in a CFD?
The "In Progress" stage is crucial because it reflects the current work being processed. A spike or delay in this stage may indicate issues such as resource shortages or task overload, requiring immediate attention.
How does a Cumulative Flow Diagram improve decision-making?
A CFD provides clear, real-time data about the flow of work, allowing teams to make data-driven decisions to optimize the process, adjust resources, or prioritize tasks, leading to better management and decision-making.
What metrics can be derived from a Cumulative Flow Diagram?
Metrics such as cycle time (the time taken for a task to move from start to finish), lead time (the overall time to complete a task), and throughput (the number of tasks completed over a given time) can be derived from a CFD.
How does a Cumulative Flow Diagram support continuous improvement?
A CFD supports continuous improvement by allowing teams to monitor their workflows, spot inefficiencies, and take corrective action. Regular analysis of the CFD leads to more refined processes and better performance over time.