What Are SQDCP Boards and Why Metrics Matter in Daily Management
Overview of SQDCP Boards
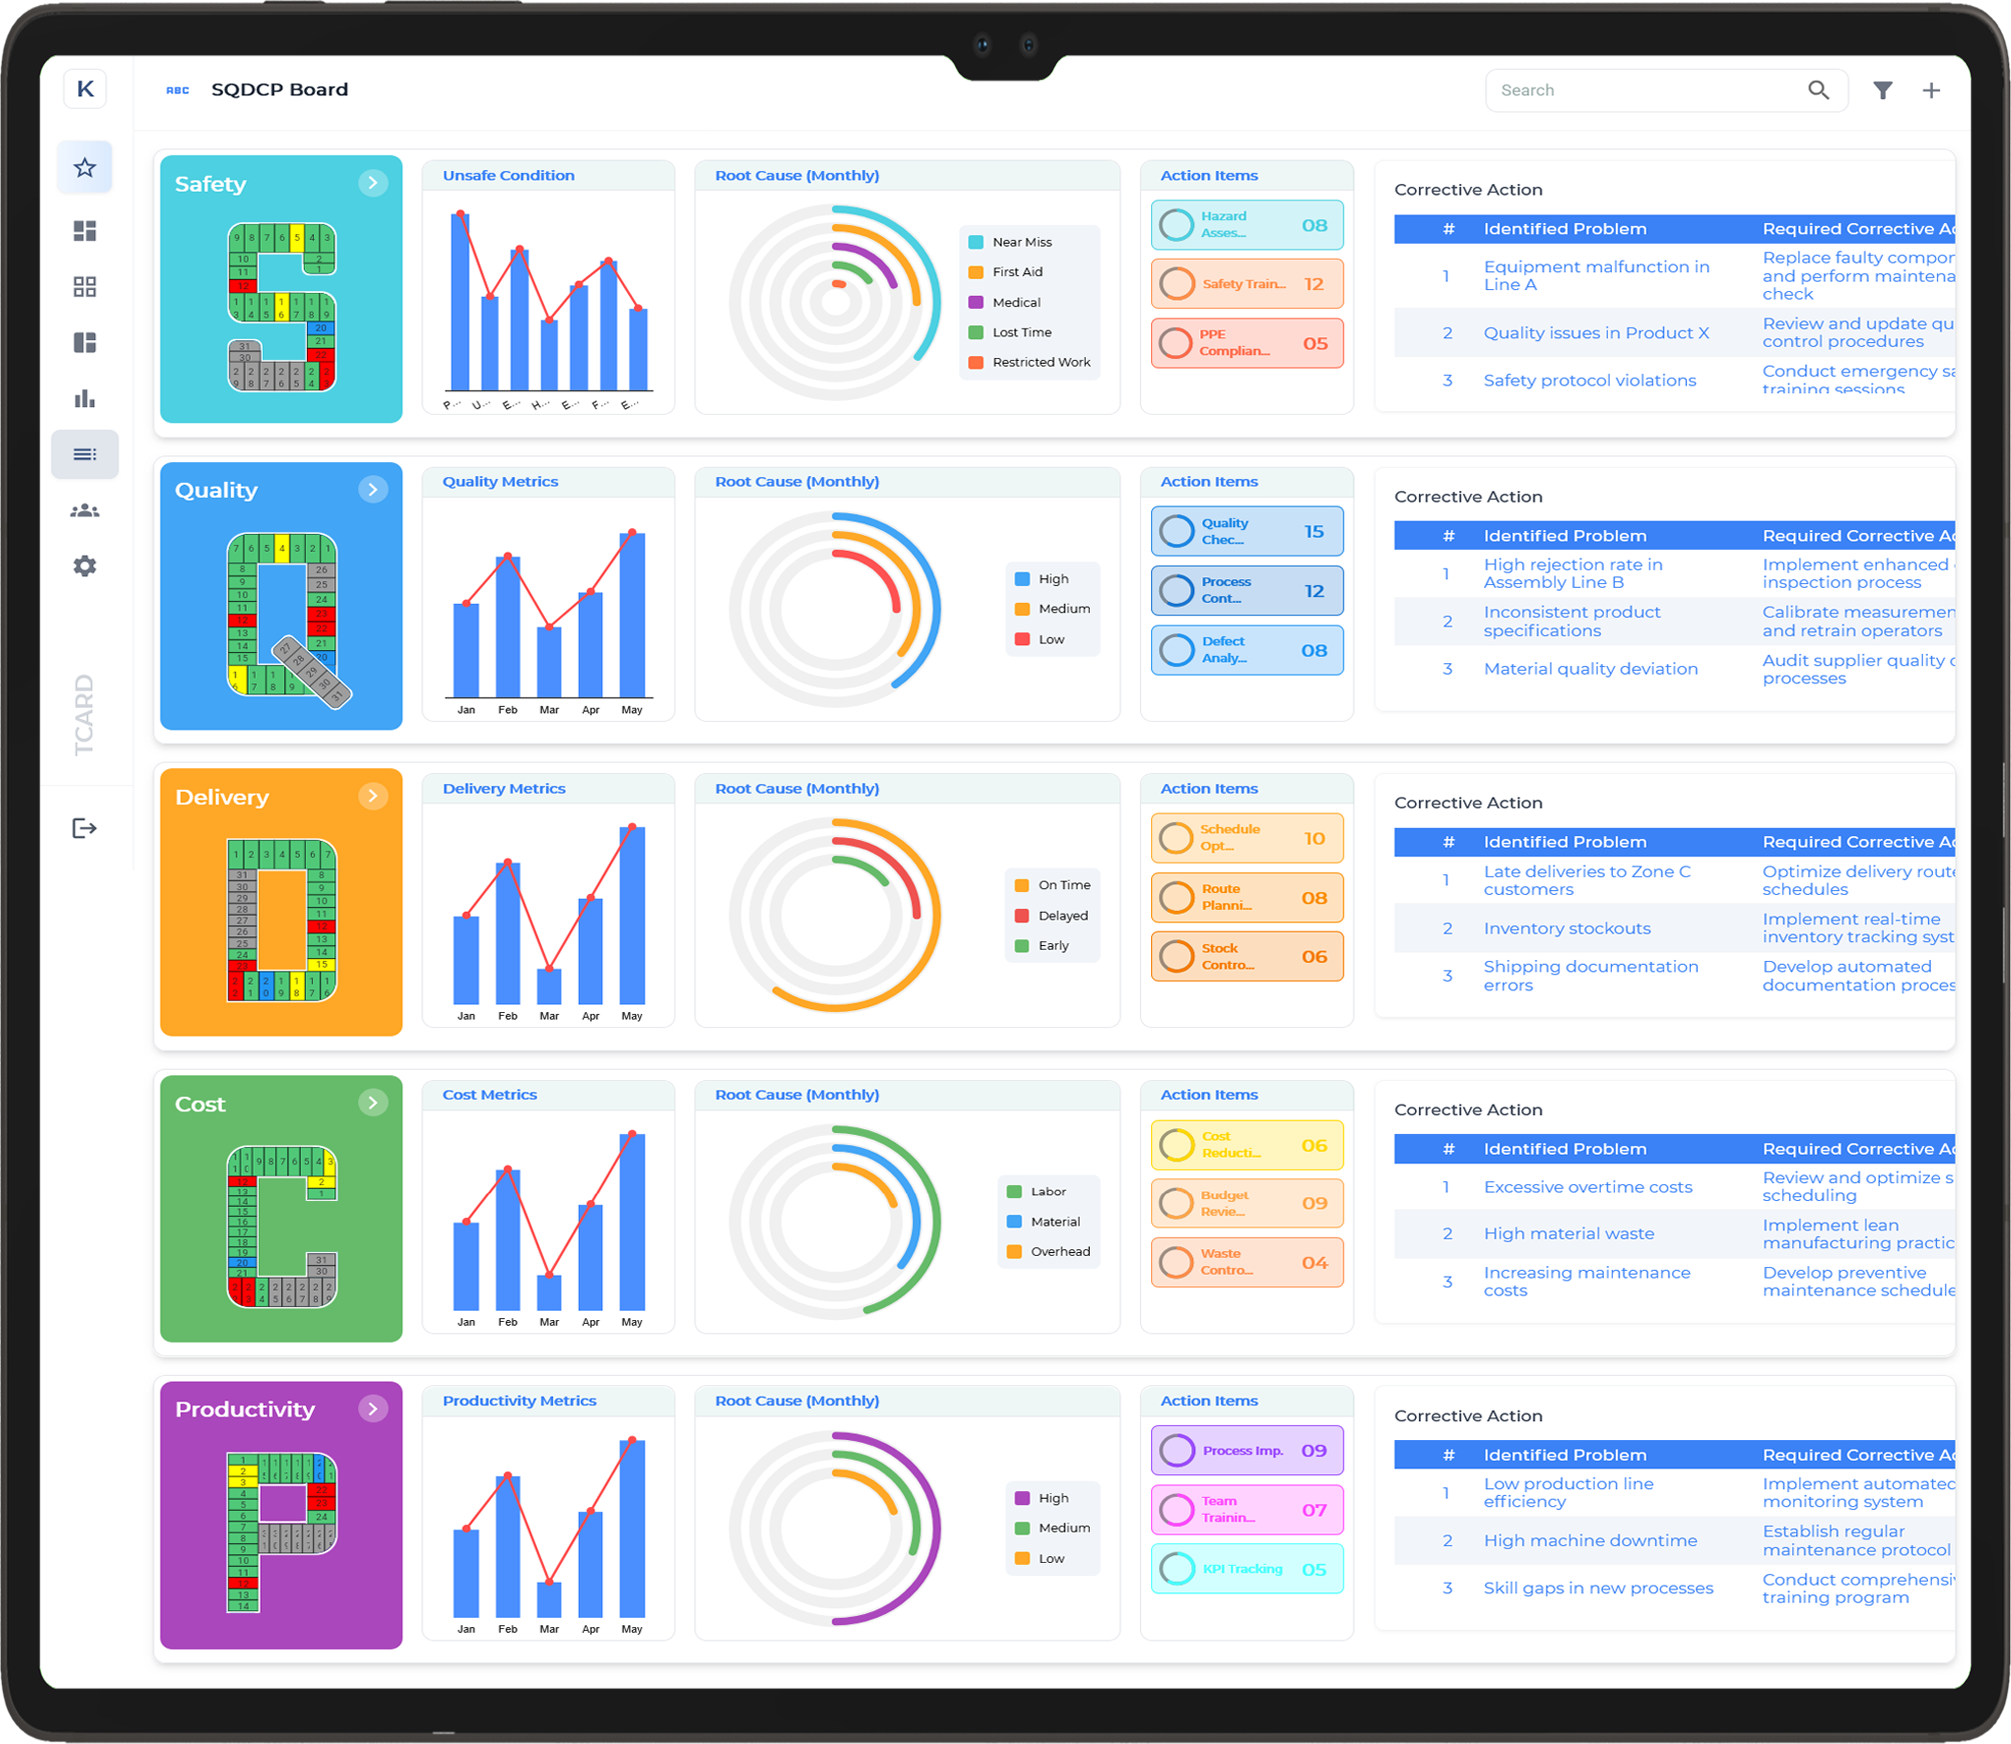
SQDCP Boards are visual management tools used in lean manufacturing to monitor critical operational metrics daily. They focus on five key areas: Safety, Quality, Delivery, Cost, and People. By displaying these metrics clearly, the board provides teams with a comprehensive view of performance at a glance. This visual representation allows for immediate recognition of issues, trends, and areas needing improvement.
Importance of Metrics in Daily Management
Metrics on an SQDCP board play a vital role in daily management. They guide operational decisions, highlight deviations from targets, and ensure that everyone on the shop floor understands performance expectations. Daily review of these metrics fosters accountability and encourages continuous improvement by providing actionable insights.
Supporting Problem-Solving
Visual metrics allow teams to identify problems early and investigate root causes effectively. Daily discussions around the board encourage collaborative problem-solving and ensure corrective actions are implemented promptly. This reduces downtime and improves operational stability.
Enhancing Communication and Alignment
SQDCP Boards serve as a central communication point between operators, supervisors, and management. By making performance metrics visible to all, teams stay aligned with organisational objectives and work towards common goals efficiently. This transparency strengthens engagement and drives better results across operations.
Understanding the Five Pillars: Safety, Quality, Delivery, Cost, and People
Safety
Safety is the foundation of operational excellence. SQDCP Boards track incidents, near misses, and compliance checks to maintain a secure work environment. Continuous monitoring encourages proactive measures to prevent accidents and ensures employee well-being remains a priority.
Quality
Quality metrics include defect rates, rework, and customer complaints. Visualising these indicators helps teams identify patterns, implement corrective actions, and maintain consistent product standards. This focus on quality reduces waste and enhances customer satisfaction.
Delivery
Delivery performance tracks on-time completion, adherence to schedules, and throughput efficiency. Highlighting delivery metrics allows teams to quickly identify bottlenecks and adjust production flow to meet customer requirements effectively.
Cost
Cost metrics include resource utilisation, scrap, and operational expenses. Monitoring costs visually helps identify inefficiencies, reduce waste, and optimise expenditure while maintaining high-quality output and timely delivery.
People
People metrics focus on workforce engagement, training, and participation. They measure team involvement in continuous improvement initiatives and ensure employees are motivated, skilled, and aligned with organisational goals, promoting a culture of accountability and growth.
How SQDCP Metrics Improve Team Accountability
Visibility of Performance
SQDCP metrics provide transparent visibility of team and individual performance. By displaying key operational indicators on the board, employees can see how their work directly impacts results. This fosters a sense of responsibility for meeting targets and maintaining standards.
Encouraging Ownership
When metrics are reviewed daily, teams are encouraged to take ownership of their tasks and outcomes. Employees understand which areas they can influence and are motivated to contribute to process improvements actively.
Supporting Corrective Actions
Clear metrics allow supervisors to identify underperformance quickly and provide guidance or support where needed. This structured approach ensures issues are addressed constructively, improving overall accountability.
Promoting Continuous Improvement
Regular tracking of metrics highlights trends and patterns that require attention. Teams learn to self-monitor and continuously improve processes, reinforcing a culture of accountability and operational excellence throughout the organisation.
Monitoring Safety Performance Across Production Lines
Tracking Key Safety Indicators
Safety performance metrics track incidents, near misses, and compliance with safety protocols. Monitoring these indicators across production lines ensures hazards are identified early, reducing risk and maintaining a safe working environment.
Identifying Trends and Risks
Daily monitoring allows management to detect trends, recurring issues, and potential high-risk areas. This proactive approach helps prevent accidents and ensures adherence to safety standards consistently.
Fostering a Safety Culture
When safety data is visible to all team members, it reinforces the importance of safe work practices. Employees become more aware of potential risks, actively participate in hazard mitigation, and contribute to a culture prioritising safety.
Supporting Compliance and Audits
Consistent tracking and reporting of safety performance ensures regulatory compliance and facilitates audits. Accurate data provides evidence that safety measures are being implemented effectively across all production lines.
Tracking Quality Metrics to Reduce Defects
Monitoring Production Quality
Quality metrics such as defect rates, rework, and customer feedback help identify problems in the production process. By tracking these metrics daily, teams can detect deviations early and take corrective action before defects escalate.
Improving Process Reliability
Visible quality data allows teams to pinpoint root causes of defects and implement process improvements. This reduces waste, enhances product consistency, and increases overall reliability of production.
Encouraging Team Accountability
When quality metrics are transparent, team members understand their role in maintaining high standards. This encourages accountability and proactive participation in continuous improvement initiatives.
Supporting Customer Satisfaction
Effective monitoring and reduction of defects directly improve product quality and customer satisfaction. Tracking quality metrics ensures that performance goals are met consistently, enhancing the organisation's reputation.
Enhancing Delivery Performance with Real-Time Insights
Tracking Delivery Metrics
Delivery performance indicators include on-time completion, adherence to production schedules, and lead times. Real-time insights allow teams to monitor progress and identify delays before they affect commitments.
Improving Scheduling and Coordination
Visual boards help coordinate production across different departments, ensuring jobs are completed in sequence and resources are allocated efficiently. This improves scheduling accuracy and overall delivery performance.
Proactive Problem-Solving
Immediate visibility of delivery data allows teams to take corrective action promptly, such as reallocating resources or adjusting priorities, ensuring targets are met consistently.
Enhancing Customer Trust
Reliable delivery performance strengthens customer confidence and satisfaction. Real-time insights from SQDCP boards enable organisations to meet commitments consistently, building long-term trust and loyalty.
Using Cost Metrics to Optimise Operational Efficiency
Tracking Key Cost Drivers
Cost metrics include production expenses, resource utilisation, scrap, and rework. Monitoring these indicators helps teams identify inefficiencies and areas for potential savings.
Reducing Waste and Unnecessary Costs
By analysing cost data visually, organisations can implement strategies to minimise waste, optimise material usage, and improve labour efficiency. This contributes to overall operational cost reduction.
Supporting Informed Decision-Making
Real-time visibility of cost metrics allows managers to make data-driven decisions regarding resource allocation, process changes, and productivity improvements, ensuring operational efficiency is maximised.
Driving Lean Practices
Cost metric tracking promotes a culture of continuous improvement. Teams are motivated to find cost-effective solutions, improve processes, and maintain high performance across all production areas, resulting in sustainable operational excellence.
Empowering Employees Through People-Focused Metrics
Understanding Individual and Team Contributions
People-focused metrics help employees understand how their daily actions contribute to overall business objectives. Tracking key measures such as attendance, skill utilisation, safety compliance, and task completion allows individuals and teams to see the impact of their work. This transparency fosters a sense of ownership and encourages proactive behaviour.
Encouraging Engagement and Motivation
When employees can monitor their own performance in real-time, it promotes accountability and drives motivation. Teams can celebrate achievements, identify areas for improvement, and take pride in meeting operational goals. Visible metrics also allow supervisors to provide timely support and recognition, reinforcing positive performance.
Supporting Development and Growth
By linking metrics to training needs and skill gaps, organisations can empower employees with opportunities for development. This not only improves individual competence but strengthens the overall capability of the workforce. Employees feel valued when they understand how performance data guides career progression and continuous learning.
Enhancing Collaboration and Teamwork
Shared metrics foster collaboration across teams, as everyone can see how their contributions interconnect with other departments. Clear visibility encourages knowledge sharing, joint problem-solving, and alignment on common objectives, creating a culture of continuous improvement and operational excellence.
Visualising Key Performance Indicators for Faster Decisions
Making Performance Data Accessible
Visualising KPIs allows managers and teams to understand performance at a glance. Charts, dashboards, and colour-coded indicators simplify complex data, making it actionable. Real-time insights help decision-makers respond quickly to issues, rather than waiting for end-of-day reports or manual analysis.
Focusing on Critical Metrics
Visual KPI boards highlight the most important metrics, such as production output, quality, safety, and delivery performance. Prioritising these indicators ensures attention is given to factors that directly impact business goals, leading to faster corrective actions and improved results.
Encouraging Proactive Management
Teams can detect trends, spot anomalies, and identify potential problems before they escalate. This proactive approach reduces downtime, minimises defects, and increases efficiency. Visual KPIs empower employees to take immediate corrective steps and contribute to operational improvement.
Aligning Teams Around Shared Goals
When KPIs are displayed transparently, all departments understand their collective objectives. This alignment strengthens collaboration, accountability, and a unified focus on achieving strategic outcomes, driving overall organisational performance.
Identifying Bottlenecks and Areas for Improvement Daily
Spotting Operational Constraints Quickly
Daily monitoring of production, workflow, and resource utilisation allows teams to identify bottlenecks before they disrupt operations. Delays, idle time, and process inefficiencies are highlighted early, enabling swift interventions that maintain smooth operations and reduce costs.
Enabling Continuous Process Improvement
By capturing daily performance data, managers can detect trends and recurring issues. This insight supports targeted improvement initiatives, optimising workflows and increasing overall productivity. Teams can address the root causes rather than just the symptoms of inefficiencies.
Enhancing Communication and Transparency
Visible bottleneck information ensures that all stakeholders are aware of challenges and priorities. Teams can coordinate better, share solutions, and implement changes collaboratively, strengthening operational alignment and reducing miscommunication.
Driving Accountability and Engagement
When bottlenecks are transparent, teams take ownership of resolving issues and improving processes. This culture of accountability encourages employees to contribute ideas for efficiency gains and operational excellence on a continuous basis.
Integrating SQDCP Metrics with Digital Tools and Dashboards
Connecting Safety, Quality, Delivery, Cost, and People Metrics
Integration of SQDCP metrics with digital dashboards and ERP systems creates a unified view of performance. Data is captured in real-time and displayed clearly, allowing managers and operators to track operational health efficiently and make faster, data-driven decisions.
Reducing Manual Effort and Errors
Automated data collection eliminates repetitive manual recording, reducing the risk of mistakes and freeing employees to focus on problem-solving and operational improvements. Accurate data ensures reliable reporting and decision-making.
Enhancing Operational Transparency
Integrated SQDCP metrics provide visibility across departments. Teams can quickly understand performance gaps, identify trends, and collaborate on corrective actions, leading to improved efficiency, safety, and quality outcomes.
Supporting Strategic Planning and Improvement
Centralised digital data enables trend analysis, forecasting, and prioritisation of improvement initiatives. Businesses can plan resource allocation more effectively and track the long-term impact of process changes, promoting operational excellence.
Supporting Continuous Improvement (Kaizen) in Daily Operations
Embedding Improvement into Daily Work
Continuous improvement, or Kaizen, requires daily attention to processes. Visual metrics and performance boards allow teams to review results, identify minor improvements, and implement changes iteratively, building a culture of constant operational enhancement.
Tracking and Measuring Impact
Daily Kaizen practices are more effective when supported by accurate, visible data. Teams can measure the impact of small changes on productivity, quality, and safety, ensuring initiatives deliver tangible results.
Encouraging Team Participation
When employees see how their suggestions influence performance, engagement increases. Collaborative problem-solving strengthens team ownership of processes and motivates consistent efforts to improve operations.
Driving Long-Term Operational Excellence
Incremental daily improvements accumulate over time, leading to sustainable gains in efficiency, quality, and safety. Kaizen practices supported by visible metrics ensure that operational excellence is maintained and continuously enhanced.
Measuring the Impact of Daily Management Actions on Overall Performance
Linking Daily Actions to Strategic Goals
Daily management actions, such as task prioritisation, resource allocation, and issue resolution, directly affect overall operational performance. Tracking these actions against metrics like output, quality, and efficiency helps managers see the tangible impact of their decisions.
Identifying Areas for Adjustment
Monitoring daily activities enables teams to detect underperforming areas quickly. Adjustments can be made in real-time, ensuring continuous alignment with operational objectives and minimising wasted effort or resources.
Enhancing Accountability and Transparency
Visible measurement of daily management actions ensures that responsibilities are clear. Teams understand how their contributions affect performance, which improves engagement, accountability, and operational discipline.
Supporting Performance Reviews and Improvements
Data-driven insights from daily management activities inform reviews and decision-making. Teams can refine processes, plan targeted improvements, and reinforce best practices for sustainable operational excellence.
Scaling SQDCP Metrics Across Teams and Departments
Standardising Performance Measurement
Scaling SQDCP metrics ensures that safety, quality, delivery, cost, and people measures are applied consistently across all teams. Standardisation simplifies monitoring and enables meaningful comparisons between departments.
Facilitating Cross-Team Learning
Visible, consistent metrics allow teams to identify best practices and implement improvements across departments. Collaboration is strengthened as teams share knowledge and solutions effectively.
Improving Management Oversight
Centralised performance tracking provides managers with a comprehensive view of organisational health. Issues can be addressed quickly, resources allocated efficiently, and operational goals achieved more consistently.
Driving Organisational Growth
Scalable SQDCP practices support expansion, whether adding new teams, lines, or sites, while maintaining high standards of performance, safety, and accountability.
Creating a High-Performance, Lean-Driven Organisational Culture
Embedding Lean Principles in Daily Operations
A lean-driven culture focuses on eliminating waste, improving efficiency, and maintaining high standards of quality and safety. Visual metrics reinforce lean practices, making expectations and performance visible across all teams.
Encouraging Continuous Improvement
Employees are empowered to identify inefficiencies and suggest incremental improvements. Daily review of metrics ensures that adjustments are made promptly, leading to better productivity, safety, and quality outcomes.
Fostering Accountability and Engagement
Transparency in performance encourages ownership and engagement. Employees understand their role in achieving organisational objectives and are motivated to contribute actively to operational excellence.
Ensuring Sustainable Operational Excellence
Combining lean principles with a high-performance culture ensures long-term improvements. Organisations maintain competitiveness and efficiency while continuously enhancing processes, standards, and employee engagement.