What Is a Balanced Scorecard and How Does It Apply to Quality Metrics?
Understanding the Balanced Scorecard
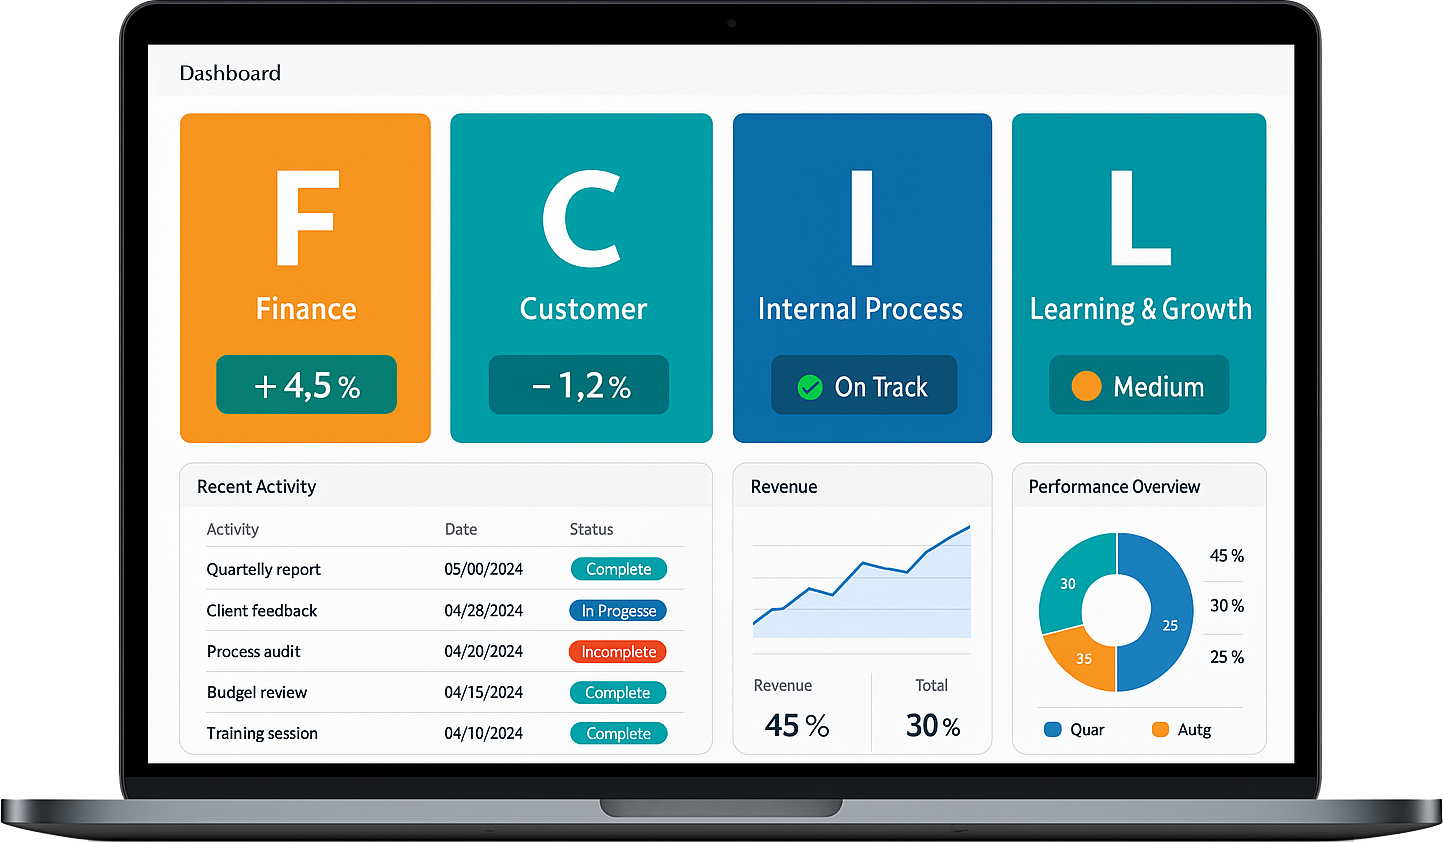
The Balanced Scorecard is a strategic tool used to measure and manage business performance across multiple areas. It goes beyond financial results by including key perspectives such as customer satisfaction, internal processes, and learning and growth. This well-rounded approach ensures that short-term actions support long-term goals.
Applying the Balanced Scorecard to Quality
In the context of quality management, the Balanced Scorecard helps track more than just defects or product returns. It allows teams to monitor performance across all areas that affect quality—from how well processes are followed to how employees are trained and engaged. This broad view helps identify root causes and prevent recurring issues.
Setting Clear Quality Metrics
Quality-related metrics within the scorecard might include defect rates, customer complaints, audit results, or compliance with standards. These indicators help teams understand whether they are meeting customer expectations and maintaining consistency in their output.
Linking Quality to Broader Business Goals
The Balanced Scorecard encourages companies to connect quality efforts with overall strategy. For example, improving customer satisfaction through better product quality may support growth targets. By aligning quality goals with financial and operational objectives, the business becomes more focused and efficient.
Making Quality Visible and Actionable
When quality metrics are tracked regularly and displayed clearly, teams can take early action to improve results. The Balanced Scorecard makes these metrics easy to monitor, encouraging continuous improvement and helping organisations maintain high standards.
Key Quality KPIs to Track in a Manufacturing Scorecard
First Pass Yield (FPY)
First Pass Yield measures the percentage of products that pass through the production process without needing any rework. A high FPY means processes are running smoothly and products are meeting quality standards the first time. It helps reduce waste and improve efficiency.
Defect Rate
The defect rate tracks the number of faulty products produced during a specific period. It’s one of the most direct indicators of quality issues. Keeping this number low means fewer returns, happier customers, and less rework on the shop floor.
Customer Complaints
Monitoring the number and type of customer complaints gives clear insight into how your products perform once they leave the factory. It also helps identify patterns that may require process changes or further training for staff.
Scrap Rate
The scrap rate shows the percentage of materials discarded due to quality failures. High scrap rates can significantly increase production costs. Tracking this KPI helps identify where materials are wasted and how processes can be improved.
On-Time Delivery with Quality
This KPI combines delivery performance with product quality. It measures how often products are delivered on time and meet all customer requirements. It ensures that speed does not come at the cost of quality.
Audit and Inspection Scores
Regular internal or external audits assess whether processes are followed and quality standards are maintained. High scores reflect consistency, compliance, and a strong quality culture in manufacturing operations.
How to Align Quality Objectives with Strategic Goals Using BSC
Understanding the Link Between Strategy and Quality
Aligning quality objectives with strategic goals ensures that daily actions support the long-term direction of the business. The Balanced Scorecard (BSC) provides a structured way to make this link clear and measurable. By focusing on the four key perspectives—financial, customer, internal process, and learning and growth—quality efforts can directly contribute to overall success.
Setting Quality Objectives That Support Strategy
Start by reviewing the organisation’s strategic goals. Then define quality objectives that feed into those goals. For example, if the aim is to improve customer satisfaction, quality objectives might include reducing defects or increasing first-time-right performance. These targets should be specific, measurable, and relevant to each team’s role.
Using BSC to Track Progress Across Departments
The BSC allows you to track quality metrics across different areas of the business. Internal process measures might include error rates or inspection pass rates, while learning and growth may focus on training for quality standards. By connecting these to customer and financial outcomes, the full impact of quality improvements becomes visible.
Encouraging Team Involvement in Strategic Alignment
Involving teams in setting and reviewing quality objectives helps build ownership. When staff see how their efforts improve key results, they stay motivated and focused. Clear communication, regular updates, and visible tracking tools help keep everyone aligned with the company’s wider goals.
Using Scorecards to Monitor Defect Rates, Scrap, and Rework
Making Quality Performance Visible
Scorecards are effective tools for tracking and improving manufacturing quality. By focusing on key indicators like defect rates, scrap, and rework, teams can clearly see how well processes are performing. These visual tools help identify areas where improvements are needed and support informed decision-making across shifts and departments.
Tracking Defect Rates Accurately
Defect rate is a vital quality measure that shows how many products fail to meet standards during production. With a scorecard, teams can record daily defect numbers and compare them to targets. This allows for quick responses to rising trends and helps pinpoint problem areas in production before they affect output on a larger scale.
Reducing Scrap Through Daily Monitoring
Scrap refers to unusable material or products discarded due to quality issues. Tracking scrap on a scorecard helps teams reduce waste and control costs. When scrap levels increase, the visual alert on the scorecard encourages investigation into causes, whether it’s machine faults, incorrect settings, or material issues.
Highlighting and Managing Rework
Rework occurs when items need to be fixed or adjusted before they meet quality requirements. While not as costly as scrap, high rework levels still indicate inefficiencies. Scorecards help teams track rework rates and identify recurring problems that might be solved through training, process adjustments, or better maintenance.
Encouraging a Continuous Improvement Mindset
By reviewing defect, scrap, and rework data daily, scorecards support a culture of continuous improvement. Teams become more proactive, work together to solve problems, and take ownership of quality performance in a visible and structured way.
Visualising Quality Trends with Balanced Scorecard Dashboards
Bringing Data to Life with Visual Tools
Balanced Scorecard dashboards help teams track quality trends in a clear, visual way. Instead of reviewing long reports or spreadsheets, dashboards present real-time data using simple charts, colour indicators, and graphs. This makes it easy to understand quality performance at a glance and spot areas needing attention.
Highlighting Key Quality Metrics
Dashboards can display a range of quality indicators such as defect rates, customer complaints, audit scores, or first pass yield. These metrics are grouped under the quality section of the Balanced Scorecard, making it easier to monitor progress over time and assess whether the team is meeting its quality goals.
Spotting Patterns and Trends Early
With visual dashboards, it becomes easier to identify rising issues or improvements. For example, if defect levels increase over several weeks, a trend line will highlight this clearly. Early visibility helps teams act before problems become serious, improving both efficiency and customer satisfaction.
Supporting Real-Time Decision Making
When dashboards are updated regularly, managers and teams can make faster, data-driven decisions. Whether it's adjusting a process, scheduling maintenance, or providing training, having live information ensures that actions are timely and based on facts.
Improving Engagement and Communication
Visual dashboards also support team engagement. By sharing results openly, everyone understands how their work impacts quality. This transparency promotes accountability, encourages collaboration, and builds a stronger quality culture across the organisation.
Linking Customer Complaints and Returns to Quality Metrics
Turning Feedback into Measurable Data
Customer complaints and product returns are valuable sources of feedback that can be directly linked to quality metrics. When tracked properly, these issues highlight where production or service problems are affecting the end user. By including complaints and returns in regular quality reports, teams gain a clearer picture of product performance after delivery.
Using Complaints to Identify Quality Gaps
Complaints often reveal issues that internal checks may miss. They can relate to packaging, performance, reliability, or ease of use. Each complaint should be categorised and linked to a quality metric, such as defect type or process step, so the team can trace it back to its source and take action to prevent recurrence.
Tracking Return Rates as a KPI
Return rates give a measurable indicator of customer dissatisfaction. A sudden increase in returns can signal a wider quality issue. Monitoring this rate alongside production metrics helps teams spot trends, such as a faulty batch or common failure, and investigate the root cause early.
Closing the Loop with Continuous Improvement
Once complaints and returns are linked to specific quality metrics, teams can create improvement plans and track the results. Over time, this process reduces repeat issues, enhances product quality, and builds customer trust. Sharing outcomes with frontline staff also strengthens engagement and supports a quality-first culture.
Integrating Lean and Six Sigma Tools with Your BSC Framework
Bringing Structure and Efficiency Together
The Balanced Scorecard (BSC) offers a structured way to align business goals across financial, customer, internal process, and learning perspectives. When combined with Lean and Six Sigma tools, it becomes even more powerful. These methods help reduce waste, minimise variation, and improve performance within the strategic framework set by the BSC.
Using Lean to Enhance Internal Processes
Lean focuses on eliminating non-value-added steps and improving workflow. Within the BSC, this supports the internal process perspective by helping teams identify and act on inefficiencies. For example, mapping a process visually alongside scorecard metrics allows for better resource planning and faster decision-making.
Applying Six Sigma for Quality Improvements
Six Sigma tools such as control charts and cause-and-effect analysis help monitor variation and solve recurring problems. These can be linked to quality KPIs tracked within the BSC. If the scorecard shows an increase in customer complaints or defects, Six Sigma tools guide the team in finding and eliminating root causes.
Aligning Projects with Strategic Objectives
One of the key benefits of combining these tools is that improvement efforts stay focused on what matters most. Whether it’s reducing delivery times, increasing customer satisfaction, or improving cost control, Lean and Six Sigma tools help teams deliver measurable improvements tied to the BSC’s strategic goals.
Encouraging a Culture of Data-Driven Action
This integration encourages staff to use data, not guesswork, to drive improvements. Regular reviews of BSC metrics help identify where Lean or Six Sigma tools can have the most impact, supporting smarter operations and long-term success.
How Real-Time Quality Data Improves Decision Making
Immediate Visibility of Performance
Access to real-time quality data allows teams to monitor performance as it happens. Instead of waiting for end-of-shift reports or weekly summaries, supervisors can see issues the moment they occur. This quick visibility helps reduce delays in response and limits the spread of problems across production.
Faster Problem Solving
When quality data is updated instantly, teams can act faster. If a defect is detected, corrective action can be taken immediately—before more faulty items are produced. This prevents waste, reduces rework, and protects delivery deadlines. Real-time insights make it easier to stay on track and maintain high standards.
Supporting Confident, Data-Driven Decisions
Decisions based on real-time data are more accurate. Managers can review current defect trends, inspection results, and production status without relying on outdated information or assumptions. This builds confidence in every action taken—from adjusting processes to reallocating resources.
Enabling Proactive Quality Control
With live quality data, teams can move from reactive fixes to proactive control. Early warnings through dashboards or alerts help spot small deviations before they become bigger issues. Over time, this approach leads to fewer disruptions and better overall performance.
Improving Communication Across Teams
Real-time data helps everyone—from operators to managers—work from the same information. This improves cross-team coordination, reduces misunderstandings, and keeps all departments aligned on quality targets throughout the day.
Setting SMART Quality Goals within the Balanced Scorecard Structure
Why SMART Goals Strengthen Quality Management
Setting SMART goals—Specific, Measurable, Achievable, Relevant, and Time-bound—helps improve the clarity and focus of quality targets within the Balanced Scorecard. These structured goals guide teams toward consistent, meaningful improvements that align with business strategy.
Making Quality Objectives Specific and Measurable
Quality goals should be clearly defined. Instead of saying “reduce defects,” a SMART version might state “reduce first-time defects on Line A by 20% over the next 3 months.” This gives the team a focused outcome and a measurable figure to track through scorecard dashboards or daily reports.
Ensuring Goals Are Achievable and Relevant
While aiming high is important, goals must also be realistic. If a team typically sees 10% rework, aiming for 0% immediately may cause frustration. Instead, setting an achievable step, like reducing rework to 5%, keeps motivation high. It’s also vital that the goal links directly to broader business outcomes like cost savings or customer satisfaction.
Setting Clear Timeframes for Review
Time-bound targets allow teams to stay focused and create urgency. A 30-day or 90-day goal gives enough time to take action and measure impact. When the goal period ends, teams can review performance, identify lessons, and set new goals based on what was learned.
Embedding SMART Goals into the Scorecard
Within the Balanced Scorecard, SMART goals can be placed under the quality or internal process section. Tracking progress regularly ensures everyone stays aligned, takes ownership, and contributes to a culture of continuous improvement.
The Role of Preventive Maintenance in Supporting Quality KPIs
Keeping Equipment in Optimal Condition
Preventive maintenance plays a vital role in achieving consistent product quality. By maintaining machines before faults occur, teams can avoid unplanned breakdowns that often lead to poor quality, scrap, or rework. Well-maintained equipment operates more smoothly, reducing variation in processes and ensuring that every product meets the required standard.
Reducing Defects and Downtime
Unexpected equipment failures can cause delays and increase the risk of defects. Worn-out parts or calibration issues may result in off-spec products or production errors. Preventive maintenance schedules help identify and correct such problems early, directly supporting key quality KPIs like defect rate, first pass yield, and rework levels.
Ensuring Process Consistency
Quality relies on stable and repeatable processes. Regular maintenance helps keep equipment running within its designed limits, ensuring consistent output from one batch to the next. This consistency improves metrics such as process capability and inspection pass rates, both of which are critical for long-term quality improvement.
Supporting Employee Confidence and Accountability
When machines are reliable, operators can focus more on their tasks without constantly troubleshooting faults. This improves productivity and helps build a sense of ownership among staff. In turn, teams are more likely to follow standard procedures and meet daily quality targets.
Linking Maintenance to Strategic Quality Goals
Including maintenance data in Balanced Scorecard reviews connects machine performance with business-level quality goals. This integration ensures that maintenance activities are not just routine tasks but key contributors to overall operational excellence.
Connecting Supplier Quality to Overall Manufacturing Performance
Why Supplier Quality Matters
The quality of supplied materials has a direct impact on manufacturing performance. If components arrive late, damaged, or below standard, they can slow down production, increase waste, and affect final product quality. Strong supplier quality is essential for maintaining smooth operations and meeting customer expectations.
Reducing Defects at the Source
When suppliers consistently provide high-quality inputs, the risk of defects during production is reduced. Poor-quality materials can lead to rework, scrap, or even customer complaints. By working closely with suppliers to meet agreed standards, manufacturers can minimise these issues and improve overall output consistency.
Improving On-Time Delivery and Efficiency
Reliable suppliers help keep production on schedule. Late or inconsistent deliveries cause disruptions, forcing teams to adjust plans or pause operations. With dependable supplier performance, factories can run more efficiently, reduce downtime, and meet delivery commitments to customers.
Strengthening Partnerships for Long-Term Gains
Building strong relationships with suppliers encourages open communication and joint problem solving. Regular quality checks, feedback loops, and shared improvement goals ensure that both parties benefit. Over time, this leads to fewer quality issues and better alignment with manufacturing goals.
Tracking Supplier Quality as a KPI
Manufacturers can track supplier-related KPIs such as defect rates, delivery accuracy, and responsiveness. Including these in scorecards or dashboards provides visibility and supports continuous improvement across the full supply chain.
Monitoring Process Stability and Capability Through Scorecards
Why Process Stability Matters in Manufacturing
Process stability means that a manufacturing process performs in a consistent and predictable way over time. When processes are stable, variations are minimal, and products meet quality standards regularly. Using scorecards to track this stability helps teams identify when a process starts to drift or become unreliable.
Tracking Key Metrics Visually
Scorecards allow teams to monitor daily or weekly results using simple charts, graphs, or colour indicators. Metrics such as cycle time, scrap rate, or first pass yield help show whether a process is under control. When these values stay within target ranges, it signals that the process is stable.
Assessing Process Capability
Process capability refers to how well a process can produce items within the required specification limits. Scorecards can display indicators such as Cp or Cpk values to show how capable the process is in meeting customer requirements. A high capability score means fewer defects and better product consistency.
Spotting Trends Early
By updating scorecards regularly, small changes or early signs of variation can be detected before they become bigger problems. This proactive approach allows teams to act quickly—whether by adjusting equipment, reviewing materials, or providing extra training to operators.
Supporting Continuous Improvement
Scorecards give teams a clear, visual way to monitor both short-term performance and long-term trends. They support fact-based decision making and help drive consistent improvements across the production line.
How to Cascade Quality Metrics Across Departments and Teams
Aligning Quality Goals with the Company Vision
To cascade quality metrics effectively, start by aligning them with the overall company strategy. Clear top-level objectives—such as reducing defects, improving customer satisfaction, or increasing efficiency—should be translated into specific goals for each department. This ensures that everyone is working toward the same outcome, but in a way that fits their area of work.
Translating Metrics into Departmental Language
Each department plays a different role in supporting quality. For example, production may focus on defect rates or rework, while logistics might monitor on-time delivery accuracy. Converting high-level metrics into relevant measures helps teams understand what quality means for them and how they can contribute.
Setting Team-Level KPIs for Daily Focus
Once department-level goals are set, break them down further into simple, trackable KPIs for teams and shifts. These might include scrap percentage, inspection pass rates, or customer complaint counts. Daily monitoring ensures that issues are addressed early and supports continuous improvement from the ground up.
Using Visual Tools to Track and Share Progress
Visual management tools like scorecards or boards help teams see progress against their metrics. Colour indicators, charts, and clear labels make it easier for everyone to stay focused on what matters. Regular updates and open discussions promote accountability and teamwork.
Encouraging Two-Way Communication
As metrics move down the organisation, feedback should flow upward. Teams should be encouraged to share insights or challenges. This helps refine goals, improve processes, and keep quality metrics both realistic and relevant at every level.
Examples of Quality-Focused BSCs in Manufacturing Environments
Using BSC to Reduce Defects in Assembly Lines
One manufacturing site implemented a Balanced Scorecard (BSC) to improve product quality on its assembly line. The team set clear quality objectives linked to the internal process perspective, including reducing defect rates by 15% over three months. Daily inspections and operator training were tracked, and results were reviewed weekly. This helped cut defects by over 20%, improving customer satisfaction and reducing rework.
Improving First Pass Yield Through BSC Tracking
A factory producing electrical components used BSC dashboards to focus on first pass yield. The quality perspective on the scorecard included KPIs like inspection pass rate, operator error trends, and calibration checks. These indicators were monitored across shifts. Over time, increased visibility helped the team identify weak points and reduce errors, raising first pass yield from 82% to 93% in two quarters.
Enhancing Supplier Quality Performance
Another manufacturer used its BSC to hold suppliers accountable for incoming material quality. Under the customer and internal process perspectives, they tracked supplier defect rates and delivery compliance. Regular reviews led to clearer expectations, fewer production delays, and a 30% drop in supplier-related quality issues within six months.
Linking Training to Quality Outcomes
In a plant focused on continuous improvement, the BSC included learning and growth indicators such as training hours and skill audits. These were directly linked to defect reduction goals. As staff skills improved, error rates decreased, demonstrating how investing in people can positively impact quality metrics.
Auditing and Reviewing Your Balanced Scorecard for Continuous Improvement
Why Regular Reviews Matter
The Balanced Scorecard is not a set-and-forget tool. To stay relevant and effective, it must be reviewed regularly. Auditing your scorecard helps ensure that performance indicators are still aligned with business goals and that the data being tracked reflects what truly matters to the organisation.
Checking for Alignment with Strategy
During a review, start by comparing each scorecard element with your current strategy. As company goals evolve, the scorecard should also change. For example, if the business shifts focus from cost control to customer satisfaction, the metrics under each perspective may need updating to match.
Assessing Data Accuracy and Timeliness
Ensure that data sources feeding into your scorecard are accurate and up to date. Inaccurate or delayed data can lead to poor decisions. Regular audits help identify any gaps or inconsistencies in reporting and make sure performance indicators remain trustworthy.
Involving Teams in the Review Process
Effective reviews include feedback from different departments and teams. Their insights can highlight issues that may not be visible in the data alone. This involvement also strengthens ownership and helps the team feel engaged with the performance targets.
Looking for Trends and Gaps
Use the audit to analyse performance over time. Are certain areas improving, while others stay flat? Spotting these trends helps identify where to focus improvement efforts and which strategies may need adjusting. Continuous review keeps the scorecard useful, current, and actionable.