- Home
- Enhancing Continuous Improvement with Visual Management Boards
Enhancing Continuous Improvement with Visual Management Boards
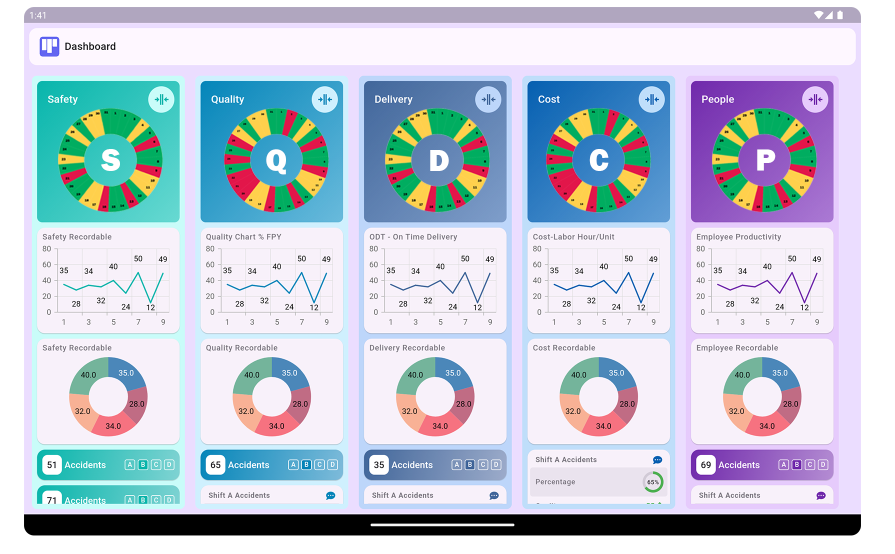
The SQDCP Balanced Scorecard integrates Safety, Quality, Delivery, Cost, and People (SQDCP) metrics into a structured framework for performance measurement and continuous improvement. It aligns operational goals with strategic objectives by tracking key indicators in real-time.
Safety (S):The Balanced Scorecard monitors workplace accidents and records serious near-miss incidents onsite. It analyses health and safety data, offering insights into existing safety measures and identifying areas that need improvement.
Quality (Q):The Balanced Scorecard's quality metrics help organisations assess defect levels in both incoming and in-house products from the customer's perspective. By leveraging these metrics, organisations can effectively monitor and manage quality-related processes to ensure continuous improvement.
Cost (C):The Balanced Scorecard effectively manages financial goals and objectives, which are critical for an organisation. It analyses financial data to provide comprehensive insights, enabling informed decision-making and strategic cost management.
Delivery (D):The Balanced Scorecard tracks delivery performance, including On-Time In-Full (OTIF) metrics, from suppliers to customers. It analyses warehouse operations and stock movements, providing valuable data to the management team for optimising delivery efficiency.
People (P):The people metrics in a Balanced Scorecard evaluate employee performance, skills, and role effectiveness. A dynamic scorecard system helps organisations assess professional competencies, training impact, cultural alignment, teamwork, and overall workforce engagement.
Benefits of SQDCP Visual Management Boards
Implementing SQCDP visual management boards offers numerous advantages for organisations aiming to improve their performance and operational efficiency:
Enhanced Visibility:Visual management boards provide a centralized location for displaying performance metrics. This visibility allows team members to quickly assess the status of various indicators and make informed decisions based on real-time data.
Improved Communication:By presenting performance metrics visually, organisations can facilitate better communication among team members. Visual boards encourage discussions around performance, challenges, and improvement opportunities, fostering collaboration and teamwork.
Quick Identification of Issues:The visual nature of these boards enables teams to identify trends, anomalies, and areas that require immediate attention. This proactive approach to problem-solving helps organisations address issues before they escalate.
Engagement and Accountability:Visual management boards promote engagement among team members by making performance metrics accessible and understandable. When individuals can see their contributions to overall performance, it fosters a sense of accountability and ownership over their work.
Support for Continuous Improvement:The SQCDP framework encourages a culture of continuous improvement. By regularly reviewing and updating visual management boards, teams can track progress, celebrate successes, and identify areas for further enhancement.
Best Practices for Creating SQDCP Visual Management Boards
To maximize the effectiveness of SQCDP visual management boards, organizations should consider the following best practices:
Design for Clarity:The layout of the visual management board should be clean and organized, with clear headings for each dimension (Safety, Quality, Cost, Delivery, People). Use colors, symbols, and graphs to convey information quickly and effectively. Avoid clutter to ensure that key messages stand out.
Incorporate Relevant Metrics:Select metrics that are relevant to the organization’s goals and objectives. Ensure that each metric is measurable and provides meaningful insights into performance. Involving team members in the selection process can also enhance buy-in and engagement.
Use Real-Time Data:Whenever possible, update visual management boards with real-time data to provide an accurate snapshot of performance. Real-time updates enable teams to respond quickly to emerging issues and make data-driven decisions.
Encourage Regular Reviews:Schedule regular meetings to review the visual management board and discuss performance metrics as a team. This practice helps reinforce the importance of the board and ensures that it remains a dynamic tool for communication and improvement.
Celebrate Successes:Recognize and celebrate achievements displayed on the visual management board. Acknowledging successes boosts morale and motivates team members to continue striving for improvement.
Implementing SQDCP Visual Management Boards
Implementing SQCDP visual management boards involves several steps to ensure they are effective and aligned with organizational goals:
Assess Current Processes:Begin by assessing existing performance tracking processes and identifying gaps that the visual management board can address. Understanding the current state will help inform the design and metrics of the board.
Engage Stakeholders:Involve stakeholders from various levels of the organisation in the development of the visual management board. This inclusive approach fosters ownership and ensures that the board meets the needs of different teams.
Choose the Right Location:Select a prominent location for the visual management board that is easily accessible to all team members. High-traffic areas, such as break rooms or near workstations, are ideal for ensuring visibility.
Train Team Members:Provide training to team members on how to interpret and utilise the visual management board effectively. Educating employees on the purpose and value of the board will enhance its use and impact.
Monitor and Adapt:Continuously monitor the effectiveness of the visual management board and make adjustments as necessary. Solicit feedback from team members to identify areas for improvement and ensure the board remains relevant.
Customising SQDCP Visual Management Boards for Different Industries
SQCDP visual management boards can be customized to suit various industries, each with unique operational requirements:
Manufacturing:In a manufacturing environment, visual management boards can focus on production metrics such as defect rates, machine downtime, and safety incidents. Including visual cues like color coding can help quickly identify areas needing attention.
Healthcare:In healthcare settings, visual management boards can track patient safety metrics, quality of care indicators, and staff engagement levels. Customising boards to highlight patient outcomes and staff training hours can enhance performance in this sector.
Service Industries:For service-oriented organisations, visual management boards may include customer satisfaction scores, service response times, and employee training metrics. Highlighting these areas can help improve service delivery and client relationships.
Project Management:In project management, visual boards can track project timelines, resource allocation, and team member contributions. This focus ensures that projects stay on track and within budget.
SQDCP Visual Management Boards
What is an SQDCP Visual Management Board?
An SQDCP (Safety, Quality, Delivery, Cost, and People) visual management board is a tool that helps teams track and improve performance in key areas by providing a clear, real-time visual representation of performance metrics.
What does SQDCP stand for?
SQDCP stands for Safety, Quality, Delivery, Cost, and People, and it's a framework used in various industries, particularly manufacturing, to track and improve key performance indicators.
How does an SQDCP Visual Management Board work?
An SQDCP Visual Management Board provides a structured and transparent way to track key operational metrics across Safety, Quality, Delivery, Cost, and People (SQDCP). It serves as a real-time performance dashboard that helps teams identify issues, drive accountability, and foster continuous improvement.
How It Works:
- Visual Representation: The board displays SQDCP metrics using charts, color codes, and key performance indicators (KPIs) to highlight trends and deviations.
- Daily Updates: Teams update the board regularly with real-time data, ensuring visibility into operational performance.
- Problem Identification: By tracking key metrics, the board helps identify bottlenecks, inefficiencies, or risks early on.
- Team Engagement: It encourages collaboration by making performance data accessible to all team members.
- Continuous Improvement: The board facilitates regular review meetings where teams analyse data, discuss solutions, and implement corrective actions.
What are the benefits of using an SQDCP Visual Management Board?
An SQDCP (Safety, Quality, Delivery, Cost, and People) visual management board offers several benefits, including enhanced visibility, improved communication, increased accountability, and the promotion of a culture of continuous improvement.
What components are typically included in an SQDCP Visual Management Board?
Typical components include sections for Safety, Quality, Delivery, Cost, and People, along with charts, graphs, and indicators that represent performance data and targets for each area.
How does an SQDCP board help improve team communication?
An SQDCP (Safety, Quality, Delivery, Cost, People) board enhances team communication by providing a clear, real-time visual representation of key performance metrics. It fosters collaboration, transparency, and accountability across teams.
Key Ways an SQDCP Board Improves Communication:
- Visual Clarity: The board presents data in an easy-to-understand format, ensuring all team members have access to critical information at a glance.
- Daily Stand-Up Meetings: Teams can use the board for structured discussions, enabling quick identification of issues and immediate problem-solving.
- Real-Time Updates: Regular updates ensure that everyone stays informed about progress, roadblocks, and corrective actions.
- Cross-Team Collaboration: The board acts as a shared reference point, aligning different departments and promoting teamwork.
- Accountability and Transparency: By clearly displaying individual and team responsibilities, it encourages proactive communication and ownership of tasks.
- Continuous Improvement: Open discussions based on board data help teams identify trends, implement best practices, and drive ongoing improvements.
Can SQDCP Visual Management Boards be customized?
Yes, SQDCP boards can be tailored to meet specific organizational needs, allowing teams to adjust metrics, layouts, and features to better reflect their unique operational requirements.
How often should an SQDCP Visual Management Board be updated?
Regular updates are recommended, typically on a daily or weekly basis, to ensure that the board accurately reflects the current performance status and helps teams respond promptly to emerging issues.
What role does the Safety component play on the board?
The Safety section tracks incidents, near-misses, and compliance with safety protocols, promoting a culture of safety and helping organizations reduce workplace hazards effectively.
How can the Quality section on the board enhance performance?
The Quality section of an SQDCP (Safety, Quality, Delivery, Cost, People) board plays a crucial role in maintaining high standards and driving continuous improvement. By visually tracking quality metrics, organisations can quickly identify defects, monitor trends, and implement corrective actions.
Ways the Quality Section Enhances Performance:
- Defect Identification: Helps teams track defect rates in incoming and in-house products, enabling early detection and resolution.
- Root Cause Analysis: Displays recurring quality issues, allowing teams to investigate and implement preventive measures.
- Process Standardization: Encourages adherence to quality protocols, ensuring consistency in production and service delivery.
- Customer Satisfaction: Improves product and service quality, leading to better customer experience and reduced complaints.
- Real-Time Monitoring: Provides instant insights into quality performance, allowing for quick corrective actions.
- Continuous Improvement: Encourages data-driven decision-making, helping organizations refine processes and eliminate waste.
What metrics are tracked in the Delivery section of an SQDCP board?
The Delivery section typically tracks on-time delivery rates, lead times, and order fulfillment metrics, ensuring that teams meet customer expectations and maintain operational efficiency.
Is an SQDCP Visual Management Board useful for non-manufacturing settings?
Yes, SQDCP Visual Management Boards can be effectively utilized in various sectors, including healthcare, logistics, and service industries, where tracking performance across these areas is crucial.
How can an SQDCP board support continuous improvement initiatives?
An SQDCP (Safety, Quality, Delivery, Cost, People) board is a powerful tool for driving continuous improvement by providing real-time visibility into key performance areas. It enables teams to identify inefficiencies, implement corrective actions, and sustain long-term improvements.
Ways an SQDCP Board Supports Continuous Improvement:
- Real-Time Performance Tracking: The board visually displays key metrics, allowing teams to monitor progress and identify deviations early.
- Data-Driven Decision Making: By analysing trends and patterns, organisations can make informed decisions to optimize processes.
- Root Cause Identification: Helps teams quickly detect and address recurring issues in safety, quality, delivery, cost, and people management.
- Employee Engagement: Encourages team participation in improvement efforts by making performance data transparent and actionable.
- Standardised Problem-Solving: Facilitates structured discussions and systematic approaches like PDCA (Plan-Do-Check-Act) for problem resolution.
- Goal Alignment: Ensures that all teams work towards common improvement objectives, fostering a culture of continuous learning and innovation.
What tools can be used to create SQDCP Visual Management Boards?
Various tools can be used to create SQDCP boards, including whiteboards, digital platforms, or specialised software that allows for easy tracking, updating, and sharing of performance metrics.
How do SQDCP boards enhance operational transparency?
An SQDCP (Safety, Quality, Delivery, Cost, People) board enhances operational transparency by providing a clear, real-time view of key performance metrics. It ensures that all team members, from frontline workers to management, have access to critical data, fostering accountability and informed decision-making.
Ways SQDCP Boards Enhance Operational Transparency:
- Real-Time Data Visibility: Displays up-to-date performance metrics, allowing teams to monitor progress and address issues proactively.
- Clear Performance Metrics: Organises key indicators in a structured format, ensuring that goals and expectations are easily understood.
- Accountability & Ownership: Assigns responsibility for specific areas, encouraging team members to take ownership of performance outcomes.
- Consistent Communication: Serves as a centralised communication tool, ensuring alignment between departments and reducing misunderstandings.
- Issue Identification & Resolution: Highlights deviations in real time, enabling quicker problem-solving and continuous improvement.
- Data-Driven Decision-Making: Provides factual insights that support strategic planning and operational efficiency.