SQDCM visual management tools are essential for organizations aiming to enhance efficiency, transparency, and continuous improvement. The framework—Safety, Quality, Delivery, Cost, and Morale (SQDCM)—focuses on tracking and improving key performance areas. These tools simplify complex data, enabling teams to focus on actionable insights and foster collaboration.
What Are SQDCM Visual Management Tools?
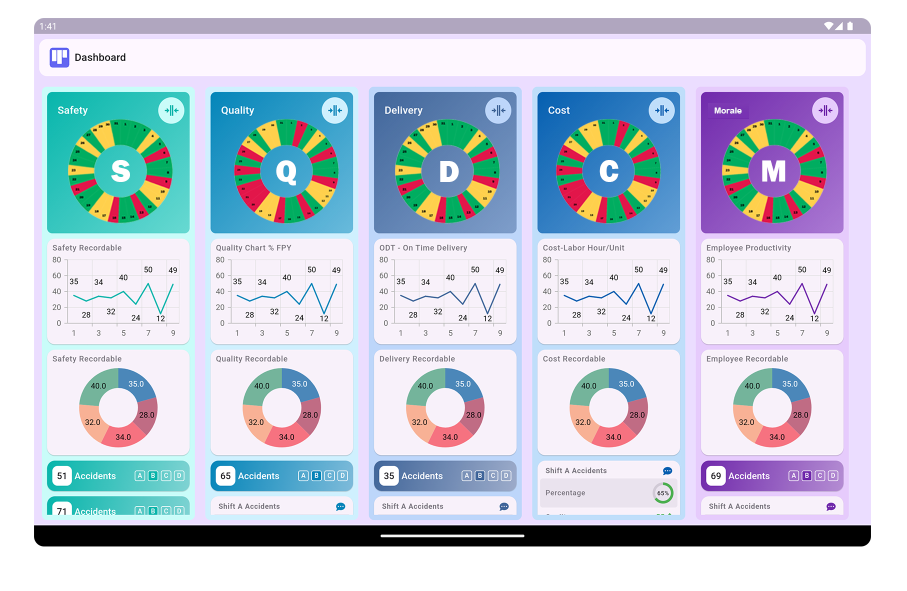
SQDCM visual management tools display critical metrics for Safety, Quality, Delivery, Cost, and Morale. These visual systems make data accessible and actionable, ensuring teams can monitor performance, identify gaps, and implement corrective actions effectively.
Uses of SQDCM Visual Management Tools
- Performance Tracking: Monitor daily, weekly, or monthly metrics to measure success and identify inefficiencies.
- Enhanced Decision-Making: Simplify complex data for quicker and more informed decisions.
- Issue Identification: Highlight deviations in real time, ensuring prompt corrective actions.
- Cross-Team Collaboration: Foster alignment and shared goals across departments.
- Continuous Improvement: Track progress and implement improvements over time.
Key Features of SQDCM Visual Management Tools
- Clear Visualization: Use graphs, charts, and color codes for quick understanding.
- Real-Time Updates: Provide live data for immediate issue resolution.
- Customizable Templates: Adapt layouts to specific organizational needs.
- Status Indicators: Use color codes (green, yellow, red) to display performance levels.
- Process Integration: Align with lean methodologies for seamless operations.
- Escalation Frameworks: Highlight unresolved issues for prompt management review.
Templates for SQDCM Visual Management Tools
1. Daily Status Board
Tracks metrics across Safety, Quality, Delivery, Cost, and Morale for an overview of daily performance.
- Safety: Incidents, near misses.
- Quality: Defects per unit, first-pass yield.
- Delivery: On-time delivery percentage.
- Cost: Cost variance, waste reduction.
- Morale: Absenteeism rate, engagement scores.
2. Escalation Board
Displays unresolved issues requiring higher-level action, ensuring transparency and accountability.
- Issue Description
- Metric Impacted
- Root Cause Analysis
- Proposed Action
- Responsible Team
3. Continuous Improvement Board
Tracks progress on improvement projects aligned with SQDCM metrics.
- Current Metric
- Target Metric
- Action Plan
- Timeline
- Progress Updates
Examples of SQDCM Applications
1. Safety Example
Track safety incidents and near misses using dashboards, enabling proactive training and preventive measures to reduce risks.
2. Quality Example
Monitor defect rates and customer complaints to identify areas for quality checks and ensure consistent product standards.
3. Delivery Example
Track on-time delivery rates, highlight delays, and adjust schedules to meet deadlines efficiently.
4. Cost Example
Display daily expenses and waste data to identify cost-saving opportunities and streamline resource usage.
5. Morale Example
Monitor employee engagement and absenteeism rates, addressing concerns to maintain a motivated workforce.
How to Implement SQDCM Visual Management Tools
- Define Metrics: Clearly outline measurable objectives for Safety, Quality, Delivery, Cost, and Morale.
- Design Templates: Create simple and intuitive layouts tailored to organizational goals.
- Train Teams: Ensure all employees understand how to use the tools effectively.
- Integrate into Processes: Use the tools in daily workflows and tier meetings.
- Monitor and Adapt: Continuously refine tools to align with evolving business needs.
Benefits of SQDCM Visual Management Tools
- Transparency: Foster a culture of openness by visualizing critical metrics.
- Engagement: Increase employee motivation by connecting their efforts to organizational goals.
- Faster Resolution: Address issues proactively with real-time data insights.
- Resource Optimization: Allocate resources effectively based on performance data.
- Continuous Improvement: Drive operational excellence by tracking progress and implementing changes.
Conclusion
SQDCM visual management tools are vital for monitoring and improving key performance areas. By integrating these tools into daily operations, organizations can enhance transparency, streamline workflows, and drive continuous improvement. Whether tracking safety metrics, optimizing delivery, or boosting employee morale, SQDCM tools provide the insights needed to achieve operational excellence.
SQDCM Visual Management Tools: Uses, Features, and Templates with Examples
What is SQDCM in visual management?
SQDCM stands for Safety, Quality, Delivery, Cost, and Morale. It is a framework used in visual management to track and manage key operational metrics that ensure continuous improvement and alignment with organizational goals.
What are the key components of an SQDCM board?
The key components of an SQDCM board include:
- Safety metrics
- Quality performance indicators
- Delivery schedules and performance
- Cost control measures
- Employee morale and engagement indicators
How do SQDCM boards enhance operational efficiency?
SQDCM boards improve operational efficiency by providing real-time data on critical metrics, helping teams quickly identify issues, prioritize corrective actions, and ensure alignment with overall goals.
What are the uses of SQDCM visual management tools?
SQDCM visual management tools are used for monitoring and improving performance in key areas like safety, quality, delivery, cost, and morale. They help teams track progress, identify problems early, and implement corrective actions.
What are the benefits of using SQDCM tools in manufacturing?
SQDCM tools help manufacturing teams ensure safety standards, maintain product quality, optimize delivery times, control costs, and monitor employee morale, leading to enhanced overall productivity and continuous improvement.
Can SQDCM boards be applied to non-manufacturing industries?
Yes, SQDCM boards are adaptable and can be applied to non-manufacturing industries like healthcare, IT, and service sectors to track key performance indicators and drive continuous improvement in various processes.
How does SQDCM support continuous improvement?
SQDCM supports continuous improvement by providing a clear framework to track performance across multiple areas. This helps organizations identify areas needing attention, implement corrective actions, and monitor progress over time.
What is the role of visual indicators on SQDCM boards?
Visual indicators, such as color coding and charts, provide quick, easy-to-understand insights into the current status of key metrics, helping teams make informed decisions and take immediate action when necessary.
How do SQDCM boards track safety in the workplace?
SQDCM boards track safety by displaying safety metrics such as accident rates, safety audits, and near-miss incidents, ensuring that teams can address safety issues proactively and maintain a safe working environment.
How do SQDCM tools integrate with other lean management practices?
SQDCM tools complement lean management practices by providing visual feedback on the performance of key processes, helping to identify waste, improve efficiency, and standardize best practices across the organization.
What types of metrics are typically displayed on an SQDCM board?
Metrics typically displayed on an SQDCM board include:
- Safety incidents and near-misses
- Product defect rates
- On-time delivery performance
- Cost reductions and savings
- Employee satisfaction and morale indicators
How do you customize an SQDCM board for different business needs?
Customization can be done by adjusting the metrics displayed based on the specific goals and challenges of the business. You can tailor the board to track the most relevant performance indicators for the organization or team.
Are there templates available for creating SQDCM boards?
Yes, there are various templates available online and in management software that provide pre-designed layouts for SQDCM boards, which can be easily customized to suit specific organizational needs.
What challenges might arise when using SQDCM boards?
Challenges may include resistance to change, difficulty in maintaining up-to-date data, lack of clear ownership for metrics, or poorly defined performance indicators, all of which can hinder the effectiveness of the board.
How can SQDCM tools be scaled for larger organizations?
SQDCM tools can be scaled by using digital boards, integrating them with enterprise resource planning (ERP) systems, and setting up tiered boards to manage performance at different organizational levels, from departments to the entire company.