The SQCDP (Safety, Quality, Cost, Delivery, and People) dashboard is a management tool designed to monitor and enhance operational performance across critical metrics. By focusing on these five key pillars, organizations can build an environment of continuous improvement, maximize efficiency, and maintain high standards in production and service delivery. A well-designed SQCDP dashboard brings clarity, enhances accountability, and supports proactive decision-making.
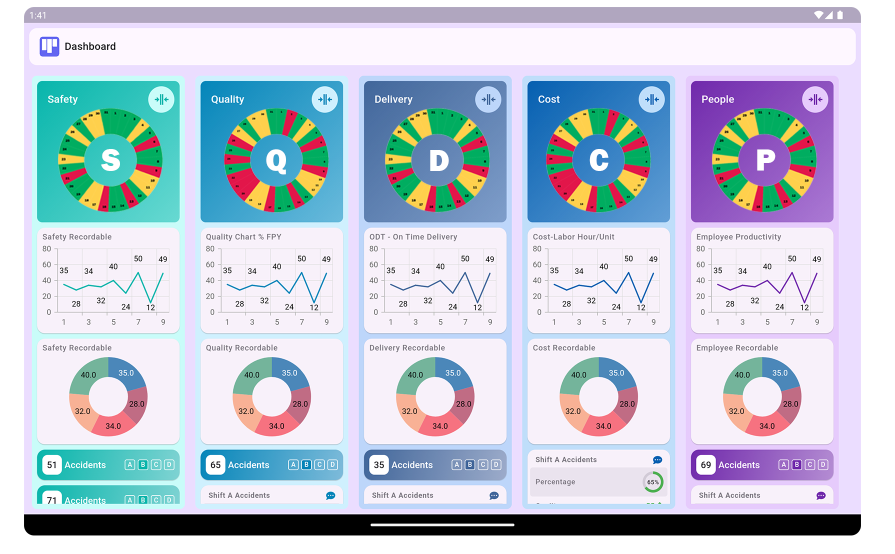
Understanding the Components of SQCDP
1. Safety (S)Safety remains the foremost priority in any operational environment. Tracking safety metrics is essential to protect employees, equipment, and assets. A culture that prioritizes safety not only reduces accidents but also promotes morale, efficiency, and reliability. Safety metrics may include incident rates, near-misses, hazard reports, and employee training compliance.
2. Quality (Q)Quality is the benchmark of any product or service, as it directly impacts customer satisfaction and retention. Monitoring quality metrics enables teams to identify defects, ensure adherence to standards, and continuously improve processes. Typical quality metrics include defect rates, rework instances, and inspection results.
3. Cost (C)Effective cost management is crucial for sustaining profitability and ensuring competitive pricing. The cost component of SQCDP monitors expenses, material usage, labor costs, and waste, helping managers identify areas for cost reduction without compromising quality or safety. This could involve tracking waste rates, overtime expenses, and cost per unit.
4. Delivery (D)Delivery measures the organization’s ability to meet customer demand on time and within specifications. Monitoring delivery metrics keeps the team focused on efficiency, scheduling, and logistics, ensuring that commitments are met. Key metrics include on-time delivery rate, lead times, and production cycle times.
5. People (P)The People pillar acknowledges that a motivated and well-trained workforce is essential for operational success. People metrics gauge employee engagement, training, and productivity, providing insights into workforce morale and the effectiveness of team management. Common people metrics include employee turnover, absenteeism, and training completion rates.
Each of these elements is interdependent. Improvements in safety, for instance, often lead to gains in quality and productivity. By tracking all five metrics, organizations can ensure balanced growth across operational areas.
Key Benefits of the SQCDP Dashboard
1. Improved Visibility and AccountabilityAn SQCDP dashboard brings all vital metrics into one view, allowing teams to see where they stand on critical performance indicators. It provides a visual representation of progress, making it easier for managers to track targets, identify deviations, and address issues proactively.
2. Enhanced Decision-MakingWith real-time data on essential metrics, managers are better equipped to make informed decisions. They can quickly spot trends, assess the impact of corrective actions, and make necessary adjustments to stay aligned with organizational goals.
3. Focus on Continuous ImprovementThe SQCDP framework fosters a culture of continuous improvement by establishing clear goals and tracking performance daily. By identifying problem areas in real time, teams can address issues as they arise, leading to incremental improvements over time.
4. Support for Cross-Functional CollaborationSQCDP dashboards make it easier for different departments, like production, quality assurance, and HR, to collaborate effectively. By aligning their efforts under shared metrics, teams are more likely to work together to achieve common objectives.
5. Employee EngagementSince SQCDP includes a dedicated focus on people, it demonstrates the organization’s commitment to employee well-being and development. Engaging employees in the process not only boosts morale but also encourages a sense of ownership in achieving targets.
Implementing an Effective SQCDP Dashboard
1. Define Key Metrics and TargetsStart by identifying the metrics that are most relevant to your organization’s goals and operational priorities. Set clear, realistic targets for each metric. For example, if reducing downtime is a priority, define acceptable thresholds and ensure the team knows the importance of hitting these goals.
2. Set Up a Visual DashboardA well-designed SQCDP dashboard should be easy to read and understand at a glance. Use color-coding, graphs, and charts to represent different metrics and their statuses (e.g., green for on-target, yellow for at risk, red for off-target). Ensure that the design facilitates quick comprehension and encourages regular review.
3. Integrate Data Collection ToolsThe effectiveness of the SQCDP dashboard depends on reliable and real-time data collection. Integrate digital tools that capture data from various departments and update the dashboard automatically. Automation reduces manual errors and saves time, allowing the team to focus on analysis and improvement.
4. Conduct Regular Reviews and AdjustmentsMake the dashboard part of daily or weekly meetings, ensuring that the team reviews and discusses the metrics regularly. This practice promotes accountability and keeps everyone focused on meeting their targets. Adjust metrics as needed to reflect new goals or changes in the business environment.
5. Train Teams on the Use of the DashboardFor an SQCDP dashboard to be effective, every team member should understand how it works and why each metric matters. Offer training on how to interpret the dashboard and encourage employees to suggest ideas for improvement based on the data.
6. Encourage Ownership and ResponsibilityAssigning specific owners for each metric can enhance accountability. When team members know they are responsible for achieving specific targets, they are more likely to take proactive measures to address issues and improve performance.
Tips for Maximizing SQCDP Dashboard Effectiveness
1. Keep Metrics Aligned with Organizational GoalsEnsure that the metrics on the SQCDP dashboard are aligned with the broader objectives of the organization. If the goal is to improve customer satisfaction, for instance, focus heavily on quality and delivery metrics.
2. Adapt Metrics Based on Changing NeedsAs the business evolves, the metrics may need adjustment. Regularly review the relevance of each metric and update them as necessary to stay in line with current priorities.
3. Prioritize Clarity in Visual DesignAn overly complex dashboard can be overwhelming. Aim for simplicity in design, limiting each metric to one or two key performance indicators and using intuitive visual elements to show status.
4. Celebrate Wins and Recognize EffortsUse the dashboard as a motivational tool by acknowledging when teams meet or exceed their targets. Recognition boosts morale and reinforces a commitment to continuous improvement.
5. Encourage Open FeedbackAn effective SQCDP dashboard isn’t static; it evolves based on user feedback. Encourage teams to share their insights on how the dashboard could be more useful or relevant, and implement changes when possible.
SQCDP Dashboard
What is an SQCDP dashboard?
An SQCDP dashboard is a visual management tool that tracks key performance indicators in Safety, Quality, Cost, Delivery, and People, helping organizations monitor and improve operational performance.
What does SQCDP stand for?
SQCDP stands for Safety, Quality, Cost, Delivery, and People. These are the core performance areas that the SQCDP dashboard focuses on, providing a structured approach to operational management.
How does an SQCDP dashboard improve performance management?
It centralizes performance data in key areas, enabling teams to identify issues quickly, track progress against targets, and take corrective actions, fostering a culture of accountability and continuous improvement.
What key metrics are tracked in an SQCDP dashboard?
Metrics include safety incidents, quality defects, cost variances, delivery timelines, and employee engagement, providing a comprehensive view of operational health and performance.
How does an SQCDP dashboard benefit manufacturing operations?
It allows manufacturing teams to track essential metrics in real time, ensuring that safety, quality, and productivity are maintained, and supporting timely decision-making to enhance efficiency.
Can an SQCDP dashboard be customized?
Yes, many SQCDP dashboards are customizable, allowing organizations to tailor metrics, indicators, and display formats to align with specific operational goals and industry standards.
How often should an SQCDP dashboard be updated?
Daily updates are common for SQCDP dashboards to ensure timely visibility of performance data, allowing teams to respond quickly to issues and track continuous progress toward goals.
What is the purpose of the Safety component in SQCDP?
The Safety component tracks incidents, hazards, and compliance measures to ensure a secure work environment, promoting employee well-being and minimizing operational risks.
How does the Quality component of SQCDP work?
The Quality component monitors defect rates, rework, and other quality issues, helping teams to maintain high standards, reduce waste, and increase customer satisfaction through consistent product quality.
Can SQCDP dashboards support continuous improvement?
Yes, by tracking key metrics and enabling frequent review, SQCDP dashboards facilitate ongoing assessment and process optimization, contributing to a culture of continuous improvement.
How does an SQCDP dashboard support accountability within teams?
It promotes accountability by assigning specific metrics to team members, making performance visible, and encouraging everyone to take ownership of their contributions toward overall goals.
Is training required to use an SQCDP dashboard?
Basic training is often beneficial to help users understand how to read and interpret data, ensuring effective use of the dashboard for tracking and managing performance.
Can an SQCDP dashboard integrate with other data systems?
Many SQCDP dashboards offer integration with other business systems, allowing seamless data exchange and a more comprehensive view of operational performance across platforms.
What types of organizations benefit from using SQCDP dashboards?
Organizations across industries such as manufacturing, healthcare, and logistics can benefit from SQCDP dashboards as they help monitor key performance areas and support operational improvement.
How does an SQCDP dashboard help in tracking daily progress?
The dashboard provides a real-time view of daily metrics, enabling teams to identify deviations from targets and take prompt actions to address issues, ensuring consistent progress.