An SQCD visual management board is a powerful tool for tracking and improving key performance metrics within an organization. The acronym SQCD stands for Safety, Quality, Cost, and Delivery, with additional flexibility to include People or Productivity (P) based on specific organizational needs. This board helps teams visualize their progress, identify issues, and take corrective actions in real-time. By making essential data accessible and actionable, the SQCD board fosters accountability and continuous improvement.
What is an SQCD Visual Management Board?
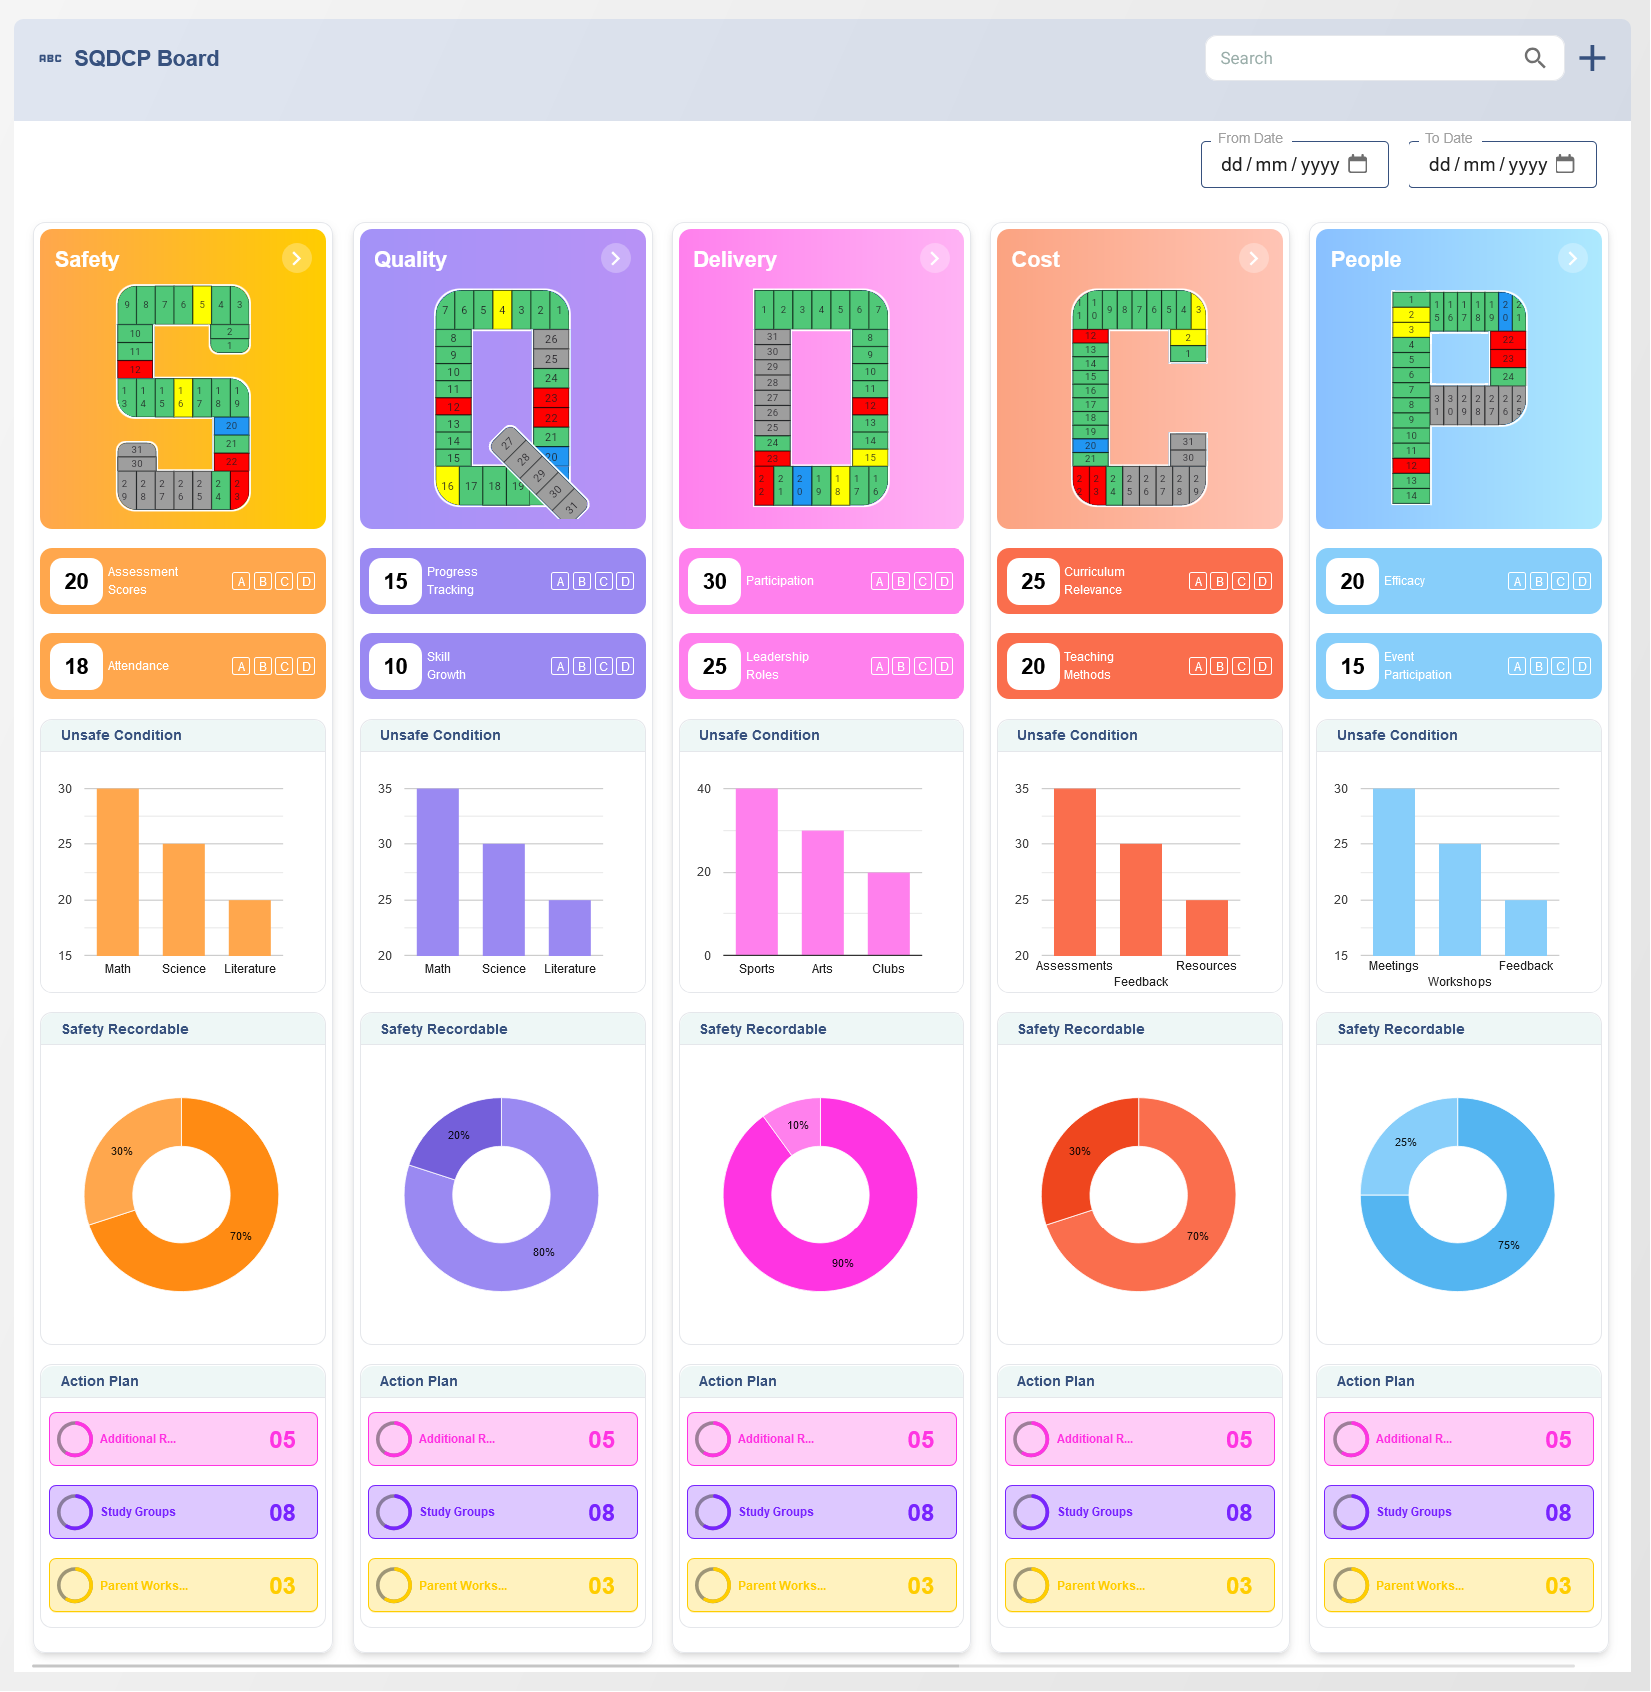
The SQCD visual management board is a structured framework for displaying performance metrics in a clear and visual manner. It allows teams to monitor their performance in areas critical to operational success:
- Safety: Tracks incidents, hazards, and adherence to safety protocols.
- Quality: Monitors defects, error rates, and quality control performance.
- Cost: Focuses on budget adherence, cost savings, and resource utilization.
- Delivery: Ensures timely completion of tasks and projects.
- People/Productivity: Evaluates workforce efficiency and engagement, if included.
By organizing data into these categories, the SQCD board provides a holistic view of operational performance, helping organizations prioritize and address areas of improvement.
Why Use an SQCD Visual Management Board?
Using an SQCD visual management board offers several advantages for teams and organizations:
- Clarity: Displays data in an easy-to-understand format, ensuring everyone on the team understands their objectives and performance.
- Accountability: Makes responsibilities clear and tracks ownership of tasks or issues.
- Focus: Keeps the team aligned with organizational priorities by highlighting the most critical performance indicators.
- Real-Time Problem Solving: Allows teams to identify and address problems as they arise.
- Continuous Improvement: Encourages incremental improvements by making progress and setbacks visible to all stakeholders.
How to Set Up an SQCD Visual Management Board
Creating an effective SQCD board involves several steps to ensure it aligns with the organization’s goals and workflows:
1. Define Key Metrics
Identify the specific metrics for each category (Safety, Quality, Cost, Delivery, and People/Productivity). For example:
- Safety: Number of incidents, near-misses, or safety audits completed.
- Quality: Defect rate, rework percentage, or customer complaints.
- Cost: Budget utilization, cost savings, or expense variance.
- Delivery: On-time delivery rate, lead time, or schedule adherence.
- People/Productivity: Absenteeism, training hours, or output per hour.
2. Design the Board Layout
Organize the board with sections for each category. Each section should include space for:
- Current Metrics: Display the latest performance data.
- Targets: Show the desired goal for each metric.
- Trends: Use charts or graphs to display performance over time.
- Actions: Track initiatives or corrective actions being taken to address issues.
3. Implement Color Coding
Use color coding to make the board intuitive. For instance:
- Green: Meeting or exceeding targets.
- Yellow: At risk or nearing thresholds.
- Red: Below targets or requiring immediate attention.
This visual cue helps teams quickly assess the status of each category.
4. Update the Board Regularly
Ensure the board is updated at regular intervals (e.g., daily, weekly, or monthly) depending on the workflow. Assign responsibility for maintaining the accuracy of the data displayed.
Using the SQCD Visual Management Board in Daily Operations
Once set up, the SQCD board becomes an integral part of daily operations. Here’s how to use it effectively:
1. Conduct Stand-Up Meetings
Hold regular stand-up meetings around the board. Use these meetings to review performance, discuss issues, and plan actions. Keep the meetings brief and focused.
2. Track Progress and Identify Gaps
Monitor progress against the defined metrics and identify gaps or areas needing improvement. For instance, if the delivery metric is falling short, investigate potential causes such as supply chain delays or capacity issues.
3. Foster Collaboration
Encourage team members to contribute to discussions about the board. This collaborative approach ensures that everyone feels invested in achieving targets and solving problems.
Benefits of the SQCD Visual Management Board
Implementing an SQCD visual management board leads to several tangible benefits:
- Improved Communication: Teams have a centralized platform to share updates and discuss performance.
- Enhanced Problem-Solving: Issues are identified early, allowing for quicker resolution.
- Increased Efficiency: Clear visibility into processes helps eliminate waste and optimize workflows.
- Greater Engagement: Team members are more involved in monitoring and improving performance.
- Alignment with Goals: The board keeps the team focused on organizational priorities.
Continuous Improvement with SQCD Visual Management Boards
The true value of an SQCD board lies in its ability to drive continuous improvement. By regularly reviewing performance and implementing corrective actions, teams can achieve sustained growth and efficiency. Over time, the board becomes a living document that evolves with the organization’s needs, fostering a culture of excellence.
SQCD Visual Management Board
What is an SQCD Visual Management Board?
An SQCD Visual Management Board is a tool used to monitor and manage key performance indicators related to Safety, Quality, Cost, and Delivery. It provides a clear visual representation of metrics and helps teams focus on continuous improvement and operational efficiency.
What does SQCD stand for in visual management?
SQCD stands for Safety, Quality, Cost, and Delivery. These are the core elements tracked on an SQCD board to ensure that teams meet organizational goals while maintaining operational excellence.
How does an SQCD board help in managing workflows?
An SQCD board helps manage workflows by clearly displaying performance metrics, highlighting areas that need attention, and allowing teams to track progress and resolve issues quickly. It fosters accountability and ensures that teams stay aligned with their objectives.
What are the main components of an SQCD board?
The main components of an SQCD board include visual indicators for Safety, Quality, Cost, and Delivery, graphs or charts showing trends, space for daily or weekly updates, and areas for highlighting problems or improvement actions.
Why is an SQCD board important for continuous improvement?
An SQCD board is important for continuous improvement because it highlights performance gaps and trends in real time. Teams can identify issues, discuss solutions, and implement corrective actions quickly, ensuring ongoing enhancement of processes and outcomes.
How can teams effectively use an SQCD board?
Teams can effectively use an SQCD board by updating it regularly, reviewing it during daily or weekly huddles, and using it to discuss progress, identify problems, and assign action items. It should be a central tool for tracking and improving performance.
What industries benefit most from using an SQCD board?
Industries such as manufacturing, logistics, healthcare, and construction benefit most from using an SQCD board. These industries rely on operational efficiency, safety standards, and quality control to meet their goals and serve their customers effectively.
How does an SQCD board promote team collaboration?
An SQCD board promotes team collaboration by providing a shared visual platform for discussing performance metrics and challenges. Regular reviews encourage open communication and teamwork to address issues and implement solutions together.
What types of metrics are displayed on an SQCD board?
Metrics displayed on an SQCD board typically include safety incident rates, quality defects, cost variances, on-time delivery rates, and other indicators that align with organizational objectives.
How often should an SQCD board be updated?
An SQCD board should be updated daily or weekly, depending on the needs of the team or project. Regular updates ensure that the board reflects the current status and helps teams address issues proactively.
What role does visual management play in an SQCD board?
Visual management is at the core of an SQCD board. By presenting information in a clear and easy-to-understand format, the board helps teams quickly identify issues, monitor progress, and make informed decisions without sifting through detailed reports.
How does an SQCD board improve decision-making?
An SQCD board improves decision-making by providing real-time data on performance metrics. Teams can use this data to identify problems, prioritize actions, and allocate resources effectively, leading to better outcomes.
What tools are used to implement an SQCD board?
Tools used to implement an SQCD board include whiteboards with magnetic strips or digital boards with templates for displaying metrics. Charts, graphs, and visual indicators are also common to make the data easy to interpret.
Can an SQCD board be digitized for remote teams?
Yes, an SQCD board can be digitized for remote teams using software tools that allow real-time updates and collaboration. Digital boards provide accessibility and enable teams to track and discuss metrics regardless of location.
What challenges might arise when implementing an SQCD board?
Challenges when implementing an SQCD board include resistance to change, inconsistent updates, and difficulty in identifying meaningful metrics. Training and clear communication can help overcome these obstacles and ensure successful adoption.