What Is a Production Dashboard and Why It’s Essential for SQDCP Monitoring
A production dashboard is a visual management tool that displays key performance indicators (KPIs) in real time to help teams monitor and improve operations. It collects data from various sources on the shop floor and presents it in a clear and easy-to-understand format. When used for SQDCP (Safety, Quality, Delivery, Cost, and People) monitoring, it becomes an essential part of daily operational control.
Real-Time Visibility Across Key Areas
The main purpose of a production dashboard is to give immediate visibility into the most important aspects of manufacturing. In SQDCP monitoring, this includes safety incidents, quality checks, delivery progress, production costs, and team performance. Instead of waiting for end-of-day or weekly reports, managers and team members can see what is happening as it occurs.
Enables Quick Decision-Making
With data updated in real time, production dashboards support fast and informed decision-making. If an issue arises—such as a missed delivery target or a spike in defects—it can be identified and addressed straight away. This helps prevent small problems from becoming larger ones, keeping the production process smooth and efficient.
Promotes Continuous Improvement
By tracking daily performance against SQDCP targets, a production dashboard encourages teams to focus on continuous improvement. It helps identify trends and patterns over time, so improvements can be planned and measured. Clear visual data also supports better communication and teamwork across departments.
In summary, a production dashboard is a vital tool for monitoring SQDCP metrics and driving operational excellence in any manufacturing environment.
How to Track Safety, Quality, Delivery, Cost & People (SQDCP) with a Single Dashboard
Managing SQDCP (Safety, Quality, Delivery, Cost, and People) in one place helps businesses streamline operations and improve performance. A single dashboard designed for SQDCP tracking brings all these critical elements together, making it easier to monitor, analyse, and act on daily performance data.
Centralised Visual Monitoring
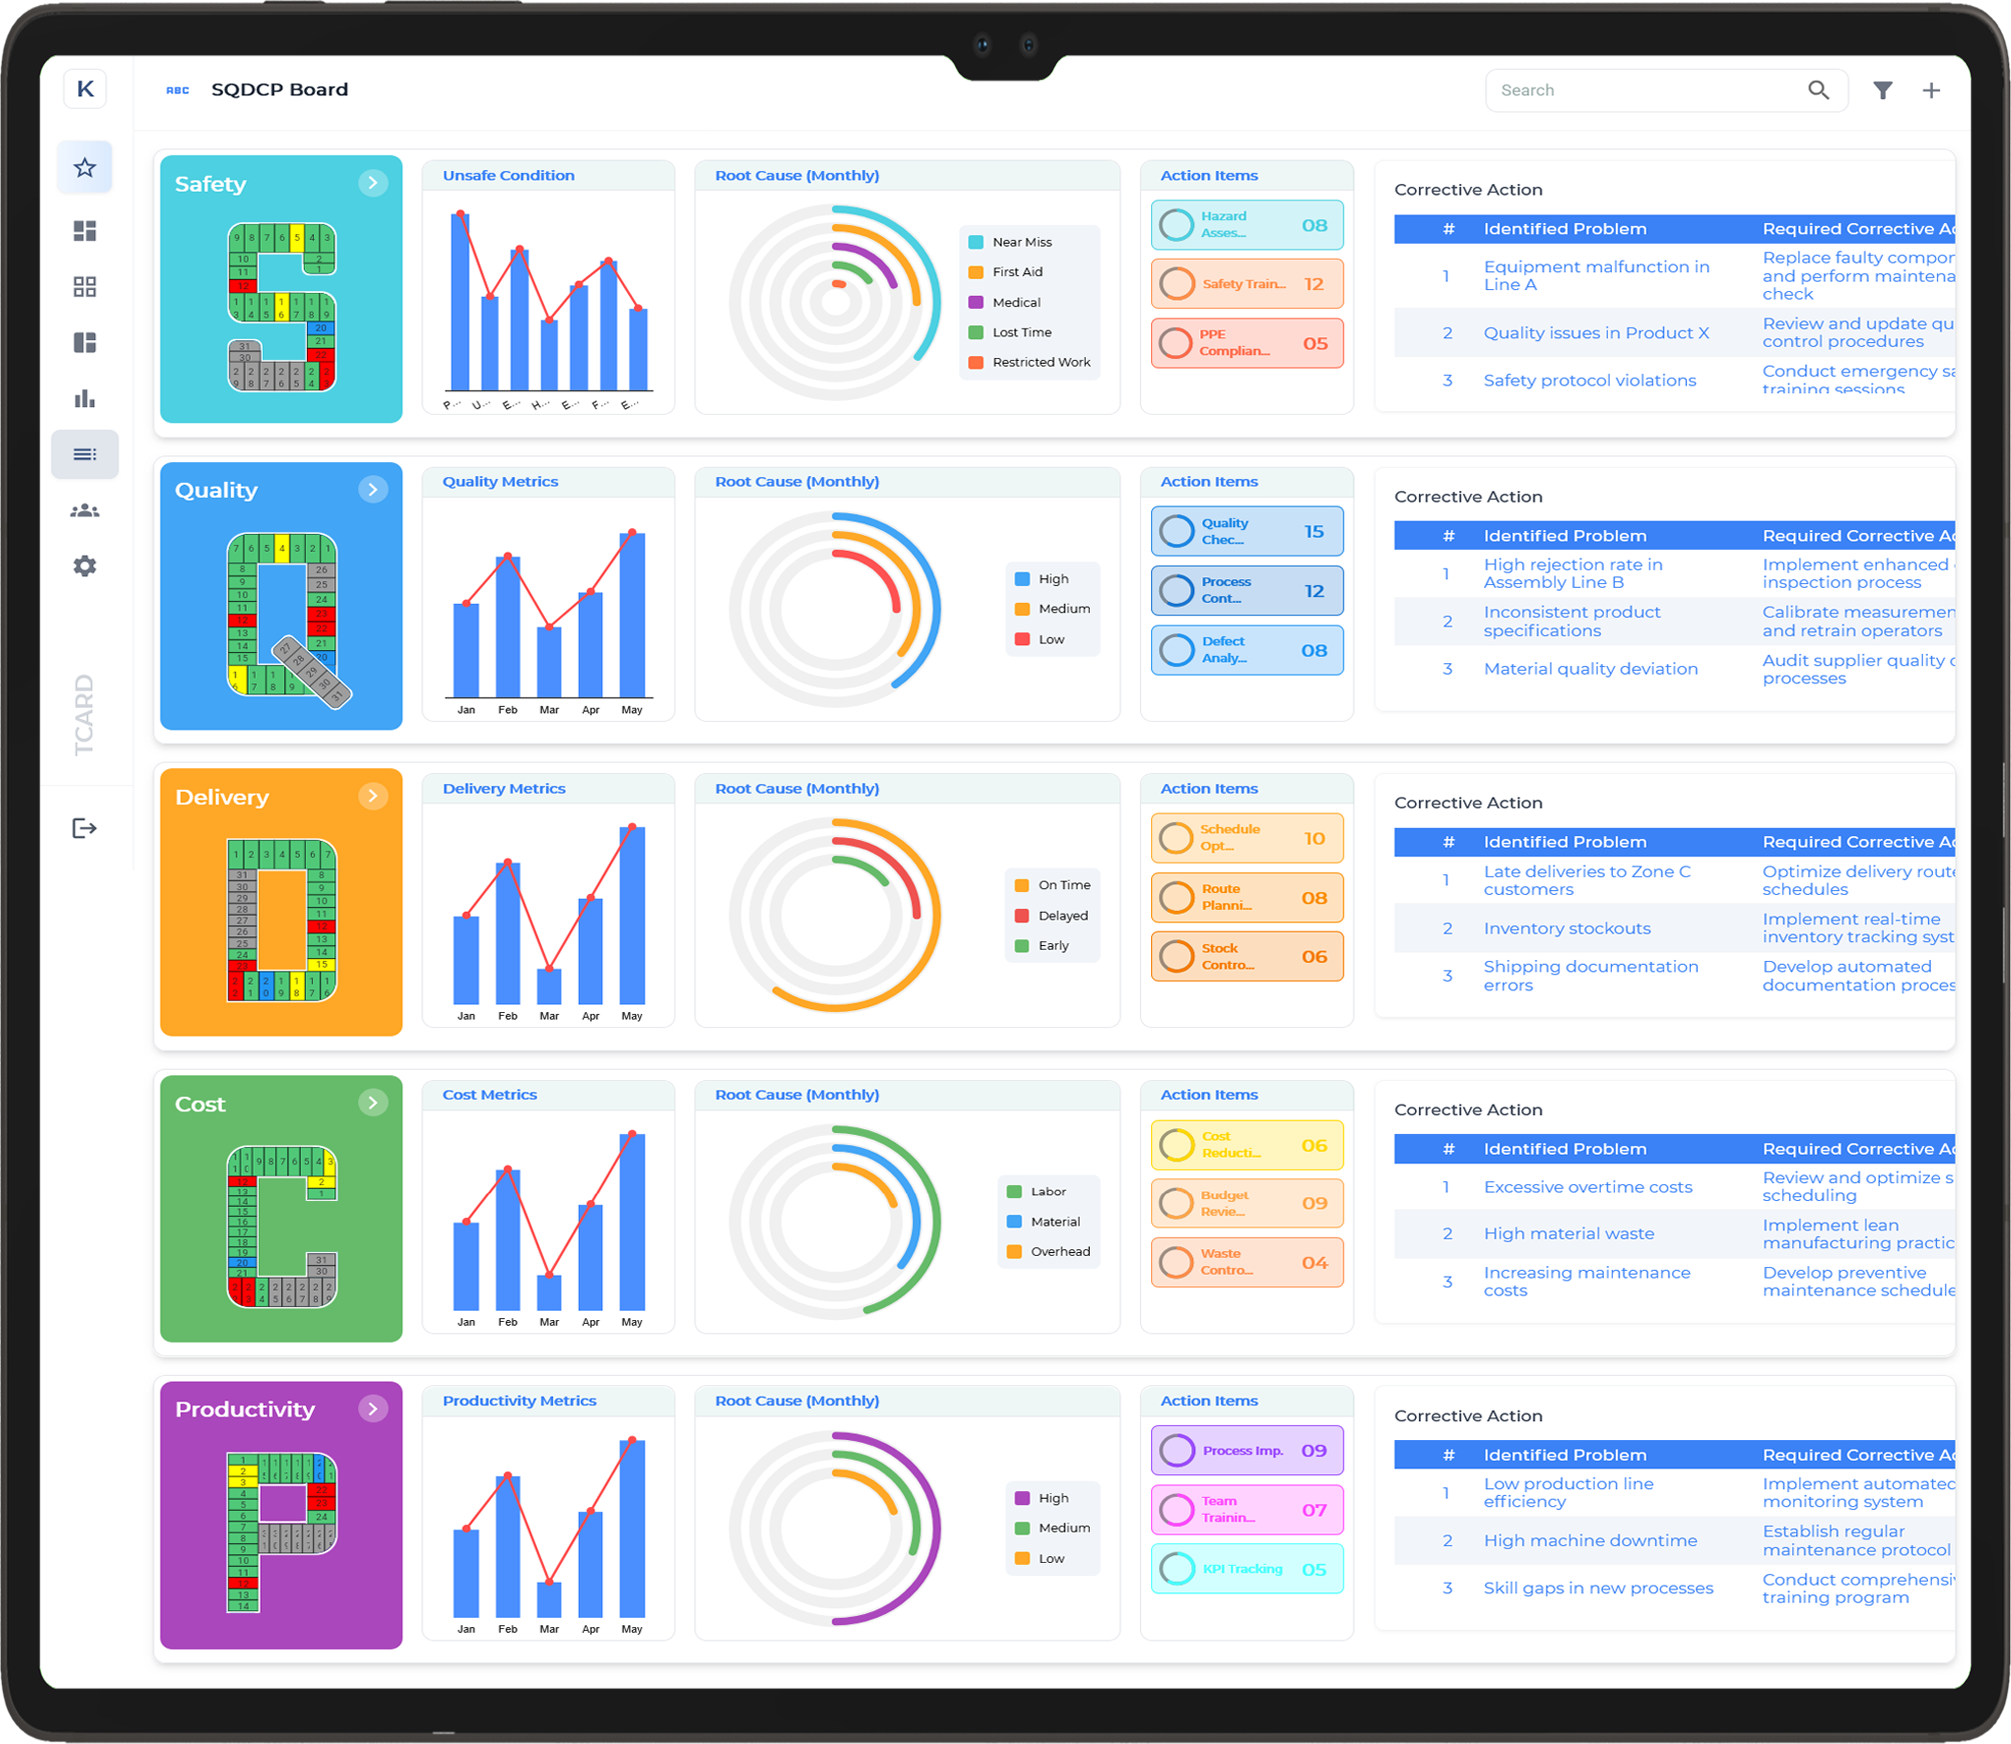
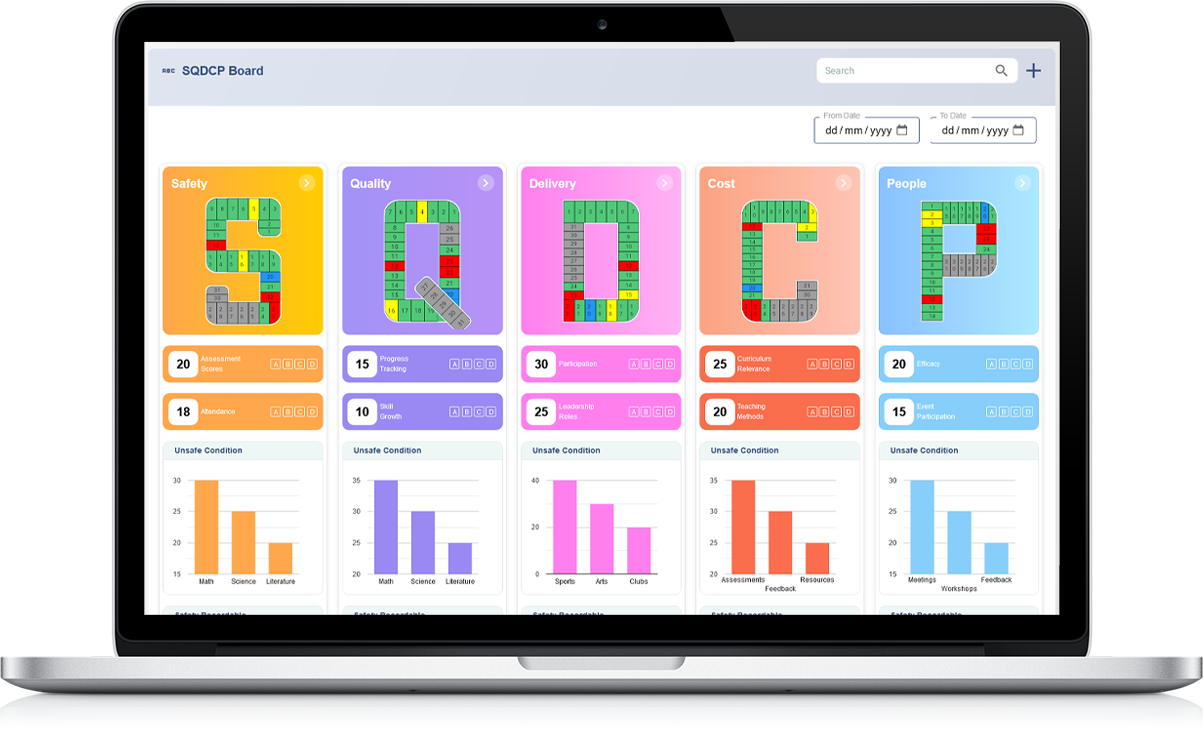
A single dashboard shows all SQDCP categories side by side. Safety data may include incidents or near-misses. Quality shows defect rates or inspection results. Delivery covers targets, output, and timeliness. Cost tracks resource use and production expenses. People metrics include attendance, training, or team engagement. When all these areas are visible in one place, teams can spot problems quickly and understand how one area may affect another.
Real-Time Updates and Alerts
Modern dashboards offer real-time updates, ensuring that teams always work with current information. Custom alerts can notify supervisors of any issues immediately—whether it’s a rise in defects or a delay in delivery. This quick visibility helps teams take action without delay and maintain consistent operations.
Supports Daily Meetings and Reviews
With all SQDCP data in one dashboard, daily team huddles become more focused. The team can review performance, discuss issues, and plan improvements using shared, up-to-date visuals. This encourages accountability and better collaboration across departments.
In short, a well-designed SQDCP dashboard helps businesses track and improve all key areas with clarity, speed, and teamwork, boosting both short-term actions and long-term goals.
The Role of Real-Time Data in Optimising Production Performance
Real-time data plays a vital role in boosting production performance across all industries. With instant access to accurate information, teams can make faster decisions, reduce waste, and keep operations running smoothly. This shift from traditional delayed reporting to live insights transforms how businesses respond to day-to-day challenges.
Faster Problem Detection and Response
Real-time data allows for immediate detection of issues such as equipment breakdowns, production delays, or quality failures. Instead of waiting for end-of-shift reports, teams are alerted instantly. This means quicker action can be taken to fix problems, reducing downtime and avoiding bigger disruptions.
Improved Efficiency Through Continuous Monitoring
With live updates, managers and operators can monitor production rates, material usage, and process flow as they happen. This helps identify slowdowns, overuse, or process gaps early on. Continuous monitoring ensures teams can fine-tune operations throughout the day to keep production on target.
Supports Smarter Decision-Making
Access to real-time data means decisions are based on the most current information, not yesterday’s results. Teams can spot trends, compare shifts, and understand which changes are having an impact. This builds a stronger foundation for ongoing improvements and better planning.
In summary, using real-time data in production helps businesses work more efficiently, respond faster, and achieve higher levels of output and quality. It creates a more agile and responsive workplace, supporting growth and competitiveness.
Key Metrics to Include in Your Daily SQDCP Production Dashboard
A well-designed SQDCP production dashboard helps track the most important aspects of daily operations. SQDCP stands for Safety, Quality, Delivery, Cost, and People. By focusing on these five areas, teams can monitor performance in real time and quickly address any issues that arise during production.
Safety Metrics
Start your dashboard with clear safety indicators. This may include the number of incidents, near misses, and days without accidents. Tracking safety daily promotes awareness and encourages a culture where risks are reported and addressed early.
Quality Metrics
Include data on defects, rework rates, and first-pass yield. This helps identify patterns in quality issues and ensures that corrective actions are taken swiftly. Highlighting quality keeps standards high and improves customer satisfaction.
Delivery Metrics
Track whether production is meeting daily schedules and delivery targets. Include measures such as on-time completion rates and any backlogs. This helps maintain service levels and customer trust.
Cost Metrics
Monitor key cost drivers like material waste, machine downtime, and overtime hours. Keeping these figures visible ensures better control of daily expenses and supports more efficient resource use.
People Metrics
Finally, show team attendance, shift coverage, and any training activities. Staff engagement and performance are essential for maintaining output and morale.
Including these key SQDCP metrics in your dashboard allows teams to stay aligned, respond quickly, and maintain a steady path toward operational excellence.
How a Daily Dashboard Helps Improve Operational Efficiency
A daily dashboard is a practical tool that gives teams a clear and quick overview of key business activities. It allows managers and workers alike to stay informed and act on data that truly matters. By showing up-to-date figures on one screen, it becomes easier to identify what’s working well and what needs attention.
Real-Time Visibility
One of the biggest benefits of a daily dashboard is the ability to view performance data in real time. Instead of waiting for weekly or monthly reports, teams can see live updates and act immediately. This fast access helps reduce delays and keeps operations moving smoothly.
Focus on Priorities
A well-organised dashboard highlights the most important areas, such as output levels, machine availability, staff attendance, and waste. This helps everyone stay focused on key targets and supports a more disciplined approach to daily work.
Better Decision-Making
With clear and accurate data available at a glance, teams can make faster and more confident decisions. Whether it's adjusting a shift plan, responding to a production delay, or spotting trends in quality issues, the dashboard gives the right insight at the right time.
Improved Team Communication
Daily dashboards also support better communication. When all team members see the same data, it creates shared awareness and encourages collaboration. Everyone works from the same facts, reducing misunderstandings and promoting action.
Overall, a daily dashboard is a simple but powerful way to improve operational efficiency through clarity, focus, and fast response.
Integrating SQDCP Metrics into Your Daily Operations for Continuous Improvement
Bringing SQDCP (Safety, Quality, Delivery, Cost, People) metrics into daily operations is a smart way to drive ongoing improvement in your business. These five key areas offer a complete picture of how well your operation is running, helping teams stay aligned with business goals.
Clear Focus on Daily Performance
When SQDCP is part of your daily routine, it becomes easier to track progress and respond quickly to issues. Daily reviews of each metric create a habit of staying alert and focused. For example, tracking safety daily encourages teams to keep the workplace risk-free, while daily delivery checks ensure that customer needs are being met on time.
Promoting Team Accountability
Displaying SQDCP metrics in team meetings or on visual boards encourages accountability. Everyone can see how their actions impact results. This shared understanding builds a stronger sense of ownership and teamwork, leading to better outcomes across departments.
Supporting Data-Driven Decisions
With SQDCP data updated daily, managers can make decisions based on real performance rather than assumptions. Patterns and trends become visible over time, making it easier to plan improvements, allocate resources, and solve recurring problems at the root level.
By making SQDCP a central part of your daily operations, you build a strong foundation for continuous improvement. This method supports better visibility, faster response, and long-term growth across your business.
Visualising SQDCP Data for Smarter Decision-Making
Using visual tools to display SQDCP (Safety, Quality, Delivery, Cost, People) data makes it easier for teams and managers to understand performance at a glance. Instead of reviewing long reports or spreadsheets, visual dashboards bring clarity to daily operations and help drive better decisions.
Clear Dashboards That Show What Matters
Displaying SQDCP metrics on easy-to-read charts or boards helps teams stay focused on what’s important. Colour-coded indicators, progress bars, and trend lines can highlight areas that are performing well and those that need attention. This makes it simple to spot patterns and act quickly when performance drops in any area.
Real-Time Insights for Faster Action
When SQDCP data is visual and updated in real time, teams can respond to issues without delay. For example, if a safety incident occurs or delivery targets slip, the change can be seen immediately, allowing quicker decisions and faster problem-solving.
Better Team Communication and Engagement
Visual displays help everyone in the business – from shop floor to management – understand the current status. This shared view improves communication and supports a culture of continuous improvement. It also encourages teams to take ownership of their performance and contribute to shared goals.
By visualising SQDCP data, your business gains better control, more informed choices, and a stronger path to operational excellence.
How Production Dashboards Drive Team Accountability and Engagement
Production dashboards are powerful tools that bring visibility to team performance, helping everyone stay focused on shared goals. By showing real-time progress and key figures, dashboards help improve both accountability and engagement across departments.
Creating a Clear View of Expectations
Dashboards provide a central location for tracking targets and outcomes. When teams can clearly see what is expected and how current performance compares, they are more likely to take ownership of their work. This transparency removes confusion and allows each team member to understand their role in the bigger picture.
Encouraging Ownership Through Data
When team members see their results updated in real time, it reinforces responsibility. Performance is no longer hidden or delayed — it’s right there for everyone to view. This encourages individuals to maintain high standards and support their colleagues when needed.
Boosting Team Motivation and Engagement
Visual progress can be a strong motivator. Watching numbers improve or targets being hit creates a sense of achievement and momentum. Dashboards can also be used to celebrate wins, highlight top performers, and build a more positive work environment.
With clear and real-time information, production dashboards help build a culture of trust, responsibility, and motivation — turning data into action and improving results over time.
Automated Reporting: How Dashboards Streamline Daily Monitoring
In today’s fast-paced working environments, staying on top of daily operations can be challenging. Automated dashboards offer a simple and effective way to track important data in real time, making daily monitoring easier, quicker, and more reliable.
Saving Time with Real-Time Updates
Manual reporting often takes hours and can lead to delays or errors. Dashboards automatically collect and display data, removing the need to pull reports by hand. This allows managers and team leaders to spend less time on admin and more time on making decisions that move the business forward.
Improving Accuracy and Reducing Errors
Automated dashboards reduce the chances of human error by pulling data directly from reliable sources. This ensures that the figures shown are always up to date and accurate. Teams can act with confidence, knowing they are using the latest information.
Keeping Everyone on the Same Page
Dashboards offer a single view of what’s happening across different areas. From production and delivery to safety and cost, all important metrics can be viewed at a glance. This improves communication and helps ensure that everyone is working with the same priorities.
With automated reporting, daily monitoring becomes faster, clearer, and more effective. Dashboards help teams stay informed, focused, and ready to respond — all without the burden of manual updates.
Benefits of Real-Time SQDCP Monitoring for Manufacturing Managers
Real-time SQDCP monitoring gives manufacturing managers a clear and immediate view of their operations. By tracking Safety, Quality, Delivery, Cost, and People in real time, managers can make faster and more informed decisions that directly improve performance on the shop floor.
Quick Response to Issues
With live data, managers can spot issues as soon as they occur. Whether it's a safety concern, a quality drop, or a delay in delivery, real-time alerts allow for immediate action. This reduces downtime and prevents small problems from growing into larger ones.
Improved Team Accountability
Real-time SQDCP dashboards help teams understand their daily goals and track progress against them. Managers can clearly see which areas are on track and which need attention. This creates a culture of responsibility and encourages quicker response from team members.
Better Decision-Making with Up-to-Date Information
Making decisions based on outdated data can lead to mistakes. Real-time monitoring ensures that every decision is backed by accurate, current information. This leads to smarter planning, improved productivity, and better use of resources.
For manufacturing managers, real-time SQDCP monitoring is a powerful tool. It streamlines operations, boosts efficiency, and supports continuous improvement by keeping everyone focused on what matters most — safety, quality, delivery, cost, and people.
Customising Your Production Dashboard to Fit Your Unique Workflow
Every manufacturing process is different, and customising your production dashboard is key to ensuring that your operations run as smoothly as possible. Tailoring your dashboard allows you to focus on the metrics that matter most to your team, boosting productivity and performance.
Identifying Key Metrics for Your Workflow
The first step in customising your production dashboard is identifying the key metrics that reflect the success of your operations. Whether you are tracking production volume, machine downtime, or employee performance, choose the data points that will give you the clearest picture of your workflow.
Customising Layout and Views
Your dashboard should be organised in a way that aligns with your team's priorities. By customising the layout, you can ensure that the most important information is always front and centre. You can also tailor the view based on roles—giving managers access to high-level data, while operators may see more granular, task-specific details.
Setting Alerts and Notifications
Customising alerts and notifications is another crucial feature. Set up automatic alerts to notify you when a metric falls outside of your predefined thresholds. This ensures that issues are flagged before they escalate, allowing for quicker resolution and preventing disruptions.
By customising your production dashboard to fit your unique workflow, you can optimise operations, improve decision-making, and ensure a more efficient production environment.
How to Analyse SQDCP Trends and Make Data-Driven Decisions
Analysing SQDCP (Safety, Quality, Delivery, Cost, and People) trends is essential for any business striving to improve performance and streamline operations. By understanding these trends, managers can make data-driven decisions that optimise production, reduce costs, and enhance overall efficiency.
Tracking Key Metrics
To start, ensure that you have clear, consistent data for each SQDCP category. Track safety incidents, quality defects, delivery times, cost overruns, and employee performance. Consistent data collection over time will reveal patterns and trends that are critical for informed decision-making.
Identifying Patterns and Trends
Once you have a sufficient data set, begin to analyse the trends. Look for recurring issues such as spikes in safety incidents or dips in quality. Use visual aids like graphs or charts to identify patterns more easily. For example, if safety incidents are increasing in a particular area, it may indicate a need for more training or process adjustments.
Making Data-Driven Decisions
With trends in hand, you can make more informed decisions. If, for example, you notice that delivery times are consistently delayed, you can investigate root causes and implement corrective actions. By aligning these decisions with business goals, you create a more efficient and productive environment.
By regularly analysing SQDCP trends, businesses can make proactive adjustments, reduce waste, and improve team performance, all leading to better operational outcomes.
The Impact of Daily SQDCP Dashboards on Reducing Downtime
Daily SQDCP (Safety, Quality, Delivery, Cost, and People) dashboards play a pivotal role in reducing downtime and improving overall operational efficiency in manufacturing environments. By providing real-time insights, these dashboards help managers quickly identify areas of concern, ensuring timely actions are taken to address potential disruptions.
Real-Time Monitoring for Early Detection
One of the primary benefits of SQDCP dashboards is their ability to provide up-to-the-minute data. This real-time monitoring allows businesses to identify issues as soon as they arise. For instance, if safety or quality issues emerge, they can be addressed immediately before they cause delays or shutdowns in production. Early detection of problems helps prevent larger, more costly breakdowns and reduces overall downtime.
Optimising Resource Allocation
By continuously tracking SQDCP metrics, businesses can optimise resource allocation and shift priorities quickly. If delivery deadlines are at risk or production processes are slowing down, adjustments can be made to allocate resources where they are most needed, ensuring minimal disruption to operations. This dynamic approach keeps production running smoothly and efficiently.
Enhancing Accountability and Performance
Daily dashboards also increase accountability among teams. With transparent data on safety, quality, and cost, employees are more likely to stay focused on their tasks and avoid mistakes that could lead to downtime. Additionally, visualising performance metrics can drive motivation, leading to more consistent work and reduced interruptions in production.
Incorporating SQDCP dashboards into daily operations can significantly lower downtime and improve production efficiency, ultimately leading to cost savings and higher productivity.
How to Use SQDCP Data to Identify Bottlenecks and Address Them Efficiently
Using SQDCP (Safety, Quality, Delivery, Cost, and People) data is a powerful way to identify and address bottlenecks in your production process. By tracking these key metrics in real-time, businesses can pinpoint issues quickly, ensuring that production remains smooth and efficient.
Monitoring Key Metrics for Early Warning
By continuously monitoring SQDCP data, businesses can identify potential bottlenecks before they escalate. For example, if safety incidents rise, it may indicate a need for improved training or equipment, which could be slowing down operations. Similarly, a drop in quality metrics could signal issues in the production line that are causing delays. Monitoring these indicators regularly provides early warnings of problems that may cause future bottlenecks.
Tracking Delivery and Cost Issues
Delivery delays and rising costs are common signs of bottlenecks. Using SQDCP data to track delivery times and costs allows businesses to spot inefficiencies in real-time. If delivery times are slipping, it could indicate that certain stages of production are taking longer than expected. Identifying these stages allows managers to reallocate resources, adjust schedules, or address underlying issues, ensuring faster delivery and reduced costs.
Optimising People and Resources
Another key aspect of SQDCP data is tracking people-related metrics, such as employee productivity and morale. A sudden dip in performance or engagement can often be a sign of bottlenecks in processes or communication. By addressing these issues early, businesses can prevent delays caused by underperforming teams, ensuring smoother operations.
By using SQDCP data to track performance, businesses can identify bottlenecks quickly, take corrective actions, and streamline operations to improve productivity and reduce delays.
Case Studies: Businesses Improving Performance with Daily SQDCP Dashboards
Daily SQDCP (Safety, Quality, Delivery, Cost, and People) dashboards have proven to be a game-changer for businesses aiming to improve operational performance. These dashboards provide real-time insights into key metrics, enabling companies to make informed decisions that drive efficiency and success.
Case Study 1: Enhancing Production Efficiency
A manufacturing company implemented daily SQDCP dashboards to monitor production line performance. By tracking safety incidents, quality issues, delivery delays, and costs in real-time, the company was able to identify and address inefficiencies quickly. The dashboard highlighted bottlenecks in the assembly line, allowing management to optimise staffing levels and reallocate resources, resulting in a 15% increase in overall production efficiency.
Case Study 2: Improving Employee Engagement
Another business in the service industry used SQDCP dashboards to track employee performance and engagement. By monitoring people metrics, they noticed a decline in productivity among certain teams, which was traced back to poor communication and lack of training. Using the insights from the dashboard, they implemented targeted training sessions, improved communication strategies, and saw a 20% increase in employee productivity.
Case Study 3: Reducing Downtime and Costs
A logistics company leveraged SQDCP dashboards to monitor delivery times and cost-related metrics. The data revealed inefficiencies in their route planning, causing delays and rising fuel costs. After adjusting their operations based on the dashboard insights, the company reduced delivery times by 25% and cut fuel expenses by 10%, ultimately saving thousands of pounds annually.
These case studies highlight the significant improvements businesses can achieve by implementing daily SQDCP dashboards to track key metrics and drive performance enhancements.