What Is OEE and Why Should You Track It with Software?
Understanding OEE in Manufacturing
OEE stands for Overall Equipment Effectiveness. It is a widely used metric in manufacturing to measure how efficiently a machine or process is running. OEE considers three key factors: availability (downtime), performance (speed losses), and quality (defects). The final OEE score is shown as a percentage, with 100% representing perfect production—no downtime, no speed loss, and no defects.
Why OEE Matters
Tracking OEE helps manufacturers identify where efficiency is lost. Whether it’s unplanned stops, slow cycles, or faulty products, OEE provides a clear picture of where improvements are needed. It supports better decision-making, helps reduce waste, and increases productivity by showing exactly how equipment is performing.
The Role of Software in OEE Tracking
Using software to track OEE makes the process more accurate and efficient. Manual calculations can be time-consuming and prone to error, but software collects real-time data directly from machines or operators. It automatically calculates OEE scores, highlights problem areas, and presents trends in clear dashboards.
Benefits of OEE Software
With OEE software, teams can see performance issues as they happen and respond quickly. It allows managers to set targets, monitor multiple machines, and track long-term progress. This real-time insight leads to faster improvements, better maintenance planning, and greater visibility across the shop floor.
How Simple OEE Tools Can Boost Manufacturing Efficiency
Understanding the Power of OEE
OEE, or Overall Equipment Effectiveness, is a key metric that helps manufacturers measure how well their machines are performing. It combines availability, performance, and quality into one easy-to-understand score. Even a small improvement in OEE can lead to big gains in productivity and cost savings.
Why Simple Tools Work Best
Many manufacturers think they need complex systems to track OEE, but simple tools can be just as effective—especially for small to mid-sized operations. Easy-to-use OEE tools reduce setup time, are less costly, and don’t require technical skills to operate. This makes it quicker for teams to get started and stay focused on improvements.
Making Performance Visible
Simple OEE tools often include clear dashboards and colour-coded indicators. These features help teams quickly see which machines are running well and which ones are causing delays or defects. This real-time visibility encourages quicker action and better team collaboration on the shop floor.
Supporting Continuous Improvement
With regular use, OEE tools help identify trends and root causes of downtime or poor performance. Teams can then focus their efforts where it matters most. Whether it’s adjusting a process, scheduling maintenance, or improving training, small changes based on OEE data lead to steady improvement over time.
Easy Setup: Getting Started with OEE Software in Minutes
Quick Installation for Fast Results
Modern OEE software is designed for easy setup, allowing manufacturers to get started in just a few minutes. There’s no need for complicated installations or long training sessions. Many platforms offer a simple web-based interface, so you can begin tracking performance with just a few clicks.
Basic Details to Begin
To start, you’ll need to enter a few basic details—such as machine names, shifts, and production targets. Once this setup is complete, your team can begin inputting data or connecting the software to machines for automatic data collection. This streamlined process means you can begin monitoring efficiency straight away.
User-Friendly Dashboards
Most OEE software tools come with built-in dashboards that show key performance indicators like availability, performance, and quality. These dashboards are often colour-coded and simple to read, helping teams understand machine performance at a glance without needing advanced technical skills.
Real-Time Monitoring and Alerts
As soon as the system is active, you can start viewing live OEE scores. The software helps teams see when a machine is down, running slowly, or producing defects. Some tools even offer alerts to notify operators or managers when thresholds are crossed, enabling faster reactions and better control.
Ideal for Small and Large Teams
Whether you're part of a small shop or a larger plant, OEE software offers flexible setup options. Its easy launch process allows any team to start tracking and improving performance without delays or technical challenges.
Understanding OEE Metrics: Availability, Performance, and Quality
What Are OEE Metrics?
OEE, or Overall Equipment Effectiveness, is made up of three key metrics—Availability, Performance, and Quality. These components help manufacturers understand how effectively their machines are running. By tracking each one separately, teams can identify the exact causes of production loss and take action to improve efficiency.
Availability: Reducing Downtime
Availability measures how often a machine is actually running compared to its scheduled time. Unplanned stoppages, breakdowns, and setup times reduce availability. If a machine is frequently offline, it impacts the overall OEE score. Improving maintenance and planning can help reduce these losses.
Performance: Maximising Speed
Performance looks at whether a machine is operating at its ideal speed. Even if a machine is available, it may be running slower than expected due to minor stoppages, bottlenecks, or slower cycles. Tracking performance helps spot these speed losses and improve overall throughput.
Quality: Reducing Waste
Quality measures the number of good products produced without rework or defects. If machines produce scrap or faulty items, quality suffers, even if availability and performance are high. Reducing defects and rework helps increase the number of saleable units and improves the quality score.
Why Each Metric Matters
Each of the three OEE metrics tells a different story. Together, they give a complete picture of how well equipment is performing. By breaking down OEE into these parts, teams can focus on the exact areas that need improvement.
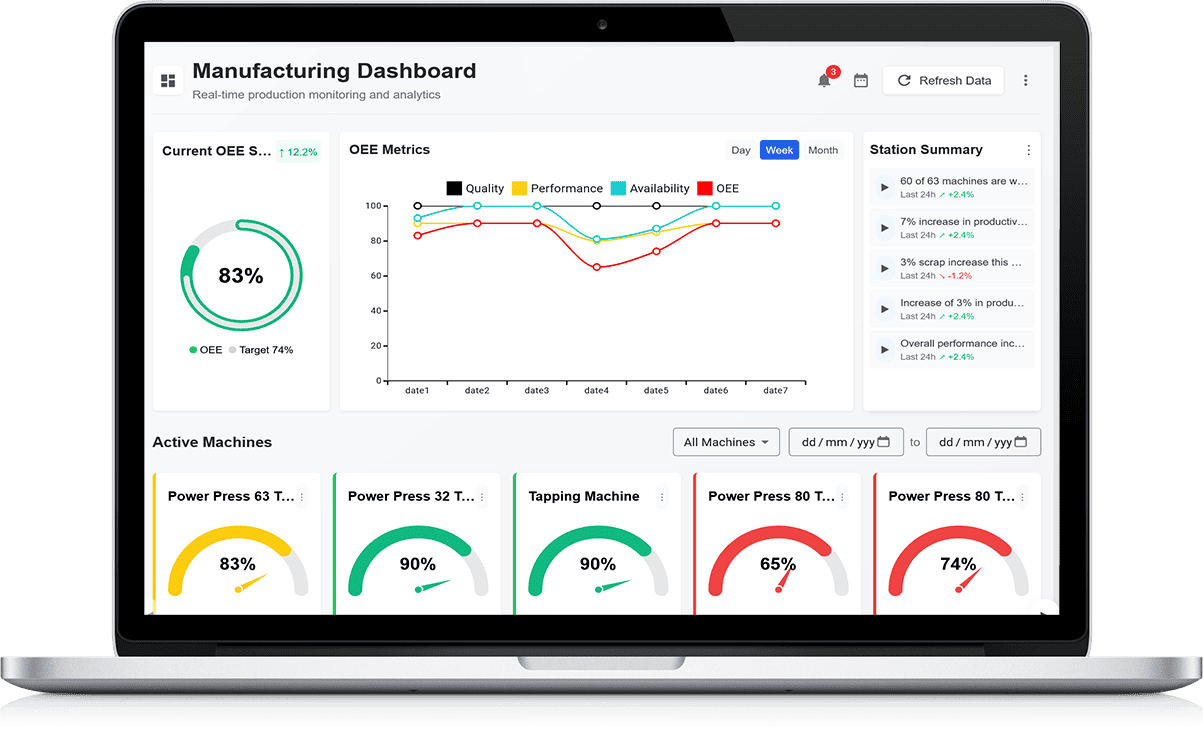
How to Read and Act on OEE Dashboards Without Needing a Data Analyst
Understanding the Basics of an OEE Dashboard
An OEE dashboard is designed to show how well your machines are performing. It combines three simple scores—availability, performance, and quality—into one overall percentage. A perfect score is 100%, meaning there are no stoppages, slowdowns, or defects. Most dashboards also show each part separately, helping you see where losses are coming from.
Look for Colour Indicators
Many OEE dashboards use colours to make data easier to read. Green usually means targets are met, amber shows minor issues, and red signals serious problems. This visual layout helps team members quickly see which machines or shifts need attention, even without deep data knowledge.
Spot Patterns Over Time
OEE dashboards often include graphs to show performance over time. Look for trends such as a drop in availability during certain shifts or a steady decline in quality. These patterns can reveal training gaps, maintenance needs, or issues with materials—without needing advanced analysis.
Use Filters and Drilldowns
Most tools allow you to filter by machine, shift, or date. Use these filters to narrow down where problems are happening. Some dashboards also offer drilldown features, letting you explore each metric in more detail and identify root causes faster.
Turn Insights into Actions
Once you’ve identified an issue, involve your team in solving it. Whether it’s scheduling maintenance, adjusting a process, or providing extra training, even simple steps based on OEE insights can make a big difference in performance.
Real-Time OEE Tracking: Know What’s Happening on Your Shop Floor
Why Real-Time Data Matters
Real-time OEE tracking allows manufacturers to monitor production performance as it happens. Instead of waiting until the end of a shift or day, teams can see live data on availability, performance, and quality. This means issues can be spotted and addressed immediately, helping to reduce downtime and avoid wasted production.
Instant Visibility into Machine Status
With real-time dashboards, operators and managers can view the status of every machine across the shop floor. If a machine stops unexpectedly or begins running below speed, the system flags it straight away. This visibility allows for quicker reactions and faster support, improving uptime and output.
Reducing Delays in Decision-Making
Delays in reporting often lead to delays in fixing problems. Real-time tracking eliminates this by providing current information at all times. Teams can make informed decisions on the spot, whether it’s adjusting staffing, starting maintenance, or investigating a defect spike.
Supporting Proactive Improvements
Continuous improvement thrives on fast feedback. Real-time OEE tracking helps identify trends and patterns during the day, not just after problems have built up. This proactive approach allows teams to make small adjustments before they turn into major setbacks.
Empowering Operators and Managers
When everyone has access to the same live information, collaboration improves. Operators can take immediate action, supervisors can support where needed, and managers can focus on the right areas. Real-time tracking keeps everyone aligned and working toward the same goals.
Using OEE Software to Identify Production Bottlenecks Instantly
Spotting Slowdowns as They Happen
OEE software helps manufacturers track equipment performance in real time, making it easier to identify production bottlenecks the moment they occur. When a machine runs slower than expected or stops unexpectedly, the system immediately reflects the drop in performance. This instant feedback allows teams to respond without delay, keeping production on track.
Analysing Each Stage of the Process
With OEE software, you can monitor every step in the production line. If one machine consistently causes delays or holds up the next step, it will show in the availability or performance score. By comparing scores across equipment, teams can easily see where problems are building up and take action to resolve them.
Real-Time Alerts and Dashboards
Many OEE tools offer live dashboards and automated alerts. When performance dips below a set threshold, the software notifies the team. These alerts are useful for avoiding missed targets and preventing minor issues from turning into full breakdowns or delays.
Data-Driven Root Cause Analysis
OEE software doesn’t just show where a bottleneck exists—it also helps uncover why it’s happening. By drilling down into machine-specific data, such as cycle times or stoppage frequency, teams can find the root cause and apply fixes that prevent future issues.
Better Planning and Scheduling
Understanding bottlenecks allows production planners to adjust shift loads and timelines. With accurate, real-time data from OEE software, teams can allocate resources more efficiently and avoid overloading problem areas.
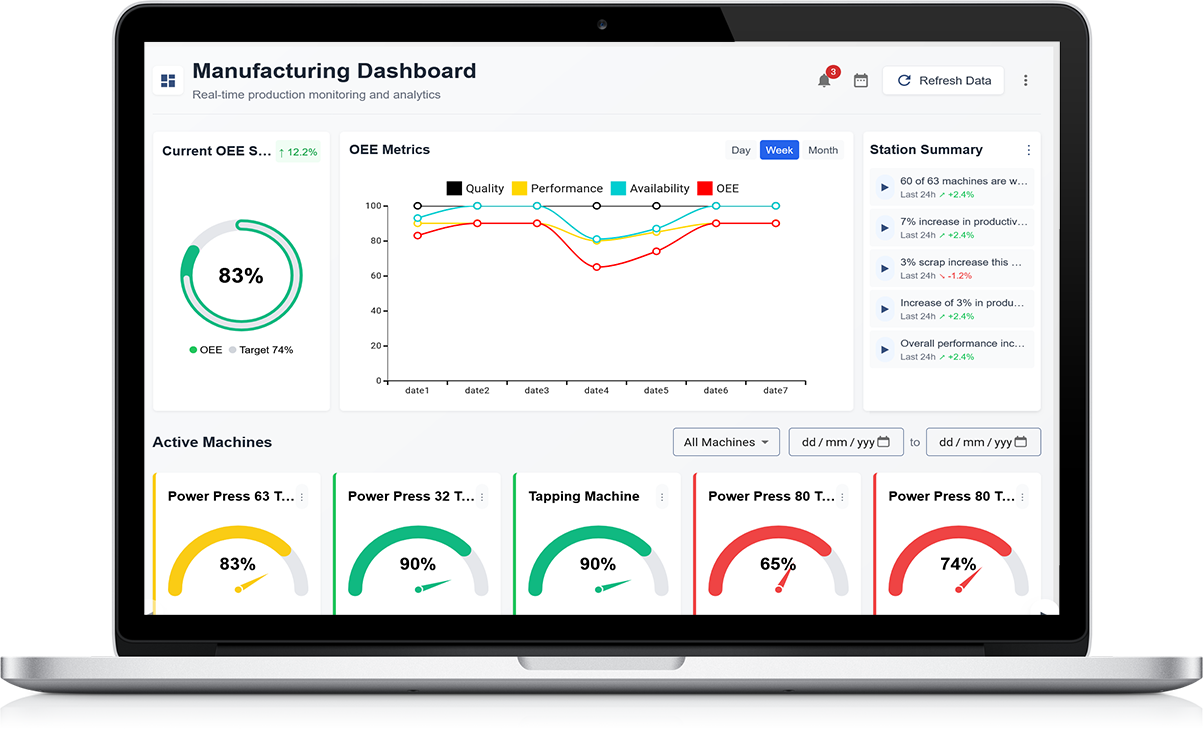
Clear Visuals and Colour-Coded Alerts for Smarter Decision Making
Making Performance Easy to Understand
In fast-paced environments like manufacturing or operations, quick decision-making depends on clear information. Visual dashboards and colour-coded alerts make it easy for teams to understand performance at a glance. Instead of reading through long reports, users can spot issues instantly with simple visuals and traffic light-style indicators.
Using Colour to Highlight Priority Areas
Colour-coded alerts are a powerful tool for drawing attention to the most urgent tasks. Green shows everything is running smoothly, amber signals a potential issue, and red highlights a serious problem that needs immediate action. This system helps teams prioritise their responses and focus on what matters most.
Improving Speed and Accuracy in Decision Making
With live visuals and alerts, managers and team leaders can make faster, more accurate decisions. Whether it’s a machine running below target, a missed shift KPI, or a sudden quality drop, colour indicators help teams react quickly—often before issues become costly.
Enhancing Communication Across Teams
Visual tools support clearer communication between departments. Everyone sees the same performance data in the same way, reducing confusion and helping align actions. From the shop floor to management, shared visuals lead to better teamwork and faster results.
Supporting Proactive Problem Solving
Instead of waiting for end-of-day reports, colour-coded dashboards alert teams to issues as they happen. This real-time visibility encourages a proactive approach, where small problems are addressed early, helping to maintain efficiency and prevent bigger disruptions.
Empowering Operators and Team Leaders with Simple OEE Insights
OEE Insights Made Easy
Overall Equipment Effectiveness (OEE) can sometimes seem complex, but it doesn’t need to be. By breaking OEE down into simple, easy-to-read metrics—availability, performance, and quality—operators and team leaders can quickly understand how well their machines are running. These clear insights give frontline teams the confidence to take action without needing deep technical knowledge.
Improving Day-to-Day Decision Making
Simple OEE dashboards show the current status of machines using colour indicators and visual charts. This real-time feedback allows teams to spot changes in performance instantly. If a machine is underperforming, the team can step in, investigate the issue, and correct it before it causes delays or waste.
Boosting Accountability and Ownership
When operators can see how their work directly affects key metrics, they’re more engaged and motivated. Easy-to-understand OEE reports give them ownership of the process. They no longer need to wait for end-of-shift reviews—they can react in the moment, helping improve efficiency throughout the day.
Supporting Team Leaders with Better Oversight
For team leaders, OEE software offers a clear overview of performance across multiple lines or shifts. This helps them manage resources, support their team, and plan improvements. By using simple OEE insights, leaders can coach staff effectively and identify patterns that may need longer-term attention.
Driving a Culture of Continuous Improvement
When performance data is easy to access and understand, it becomes part of the daily routine. Simple OEE insights empower every level of the team to look for ways to improve and work together toward shared goals.
Cloud-Based OEE Software: Access Data Anytime, Anywhere
Work Smarter with Real-Time Access
Cloud-based OEE (Overall Equipment Effectiveness) software allows manufacturers to track performance from any location. Whether you're on the shop floor, in a meeting room, or working remotely, you can access live data using a laptop, tablet, or phone. This flexibility helps managers and teams stay informed and take action quickly, without needing to be physically present.
No Complex Installations or Delays
With cloud-based tools, there’s no need for lengthy setup or expensive hardware. The software runs through a secure internet connection, making it faster and easier to get started. Updates happen automatically in the background, so you always have the latest features without extra effort.
See Live Dashboards Across All Sites
Cloud-based OEE software makes it simple to monitor multiple locations from one central system. Managers can view dashboards showing availability, performance, and quality in real time, even across different plants. This unified view supports better planning, problem-solving, and collaboration between teams.
Improve Team Communication and Accountability
Because the data is available to everyone with permission, teams can work from a shared source of truth. Operators, supervisors, and senior leaders all see the same figures, reducing confusion and improving trust. Real-time insights also help teams stay accountable and focused on performance goals.
Stay Connected and Make Better Decisions
Access to live OEE data helps teams respond faster to issues, identify trends sooner, and make more confident decisions. Whether you're reviewing yesterday’s shift or watching production live, cloud-based OEE software keeps you connected and in control—wherever you are.
How to Integrate OEE Software with Existing Machines and Systems
Start with a Clear Understanding of Your Current Setup
Before integrating OEE software, review how your current machines and systems operate. Check what data they already collect—such as cycle times, downtimes, and production counts. Knowing this helps you choose the best integration method and ensures the software can collect accurate performance data.
Choose the Right Connection Method
There are several ways to connect OEE software to your machines. These include manual data entry, sensor-based input, or linking with existing control systems. The choice depends on your equipment’s age, level of automation, and available ports. Many systems use simple plug-and-play devices or local network connections for smooth integration.
Use Gateways or Interfaces Where Needed
Older machines can still be connected using external sensors or gateways. These tools collect data from the equipment and send it to the OEE software in real time. This approach allows you to modernise your tracking without replacing existing machinery.
Ensure Compatibility with Current Systems
OEE software should work alongside your current platforms—such as maintenance, planning, or quality systems. Choose software that supports standard data formats and open communication protocols to make integration easier. This reduces duplication of effort and keeps all systems aligned.
Work with IT and Production Teams
Successful integration involves both technical and operational support. Involve your IT team to manage secure connections and data flow. At the same time, include production staff to ensure the software captures the right metrics and fits smoothly into daily routines.
From Spreadsheets to Automation: The Case for Switching to Digital OEE Tools
Why Spreadsheets Fall Short for OEE Tracking
Many manufacturers still rely on spreadsheets to track Overall Equipment Effectiveness (OEE), but this manual approach can be slow, error-prone, and difficult to manage. Entering data by hand often leads to delays, inconsistent reporting, and a lack of real-time visibility. Teams may spend more time updating sheets than analysing the results.
Benefits of Switching to Digital OEE Tools
Digital OEE tools automate data collection, saving time and improving accuracy. These platforms gather real-time performance information directly from machines or operators. The software then calculates OEE scores instantly, highlighting trends and problem areas through easy-to-read dashboards. This helps teams act faster and make better decisions based on live data.
Improved Visibility and Team Collaboration
With digital tools, everyone—from the shop floor to senior management—can access the same performance data. Visual dashboards with colour-coded indicators make it easier to see where improvements are needed. This shared view encourages stronger teamwork and more focused problem-solving during daily reviews or shift meetings.
Scalable for Growth
As operations grow, spreadsheets become harder to manage. Digital OEE software scales effortlessly across multiple machines, lines, or sites. It supports consistent reporting and makes it easier to compare performance across teams. For growing businesses, automation ensures you stay in control without adding unnecessary admin work.
Common Mistakes in Tracking OEE (And How User-Friendly Software Fixes Them)
Manual Data Entry Errors
One of the most common issues in tracking OEE is relying on manual data entry. When operators input numbers by hand, there's a higher risk of mistakes, missing data, or delayed updates. These errors can lead to inaccurate OEE results and poor decision-making. User-friendly software solves this by automating data collection, ensuring accuracy and saving time.
Confusing or Incomplete Metrics
OEE consists of three main elements: availability, performance, and quality. A frequent mistake is measuring only one or two parts, giving a misleading view of equipment effectiveness. Good OEE software keeps all three clearly visible and easy to understand, helping teams get a full picture of performance.
Lack of Real-Time Visibility
Waiting until the end of a shift or day to review OEE data can delay important actions. By the time a problem is found, the damage is already done. With live dashboards and alerts, user-friendly tools give teams real-time feedback. This lets them act quickly to prevent further losses.
Overcomplicated Systems
Some tracking methods are too complex, making it hard for teams to use them consistently. Simple, well-designed software uses clear visuals, colour indicators, and easy navigation. This helps operators and managers stay engaged, understand the data quickly, and take the right steps to improve OEE.
Case Study: UK Manufacturer Improves Output with Intuitive OEE Software
Background
A mid-sized UK-based manufacturer producing industrial components faced challenges with machine downtime, inconsistent reporting, and lack of real-time visibility into daily performance. Their existing tracking methods relied on manual logs and spreadsheets, which delayed issue detection and slowed decision-making.
The Need for a Better Solution
The production team wanted a smarter, more reliable way to monitor equipment efficiency and identify problems as they happened. Their goals were to improve machine availability, reduce product defects, and increase output without adding extra pressure on the operators.
Implementation of OEE Software
The company adopted an intuitive OEE software platform that could be installed quickly and integrated easily with their current machinery. The setup required minimal training, and within days, the team was capturing live data directly from the shop floor. Dashboards were displayed in team areas, making performance transparent for every shift.
Results and Impact
Within three months, the manufacturer reported a 15% improvement in overall equipment effectiveness. Downtime dropped due to faster issue response, and teams were able to track quality trends early in the process. Managers praised the visual dashboards for helping them plan maintenance more effectively and keep teams focused on daily goals.
Operator Engagement
Operators also felt more involved, as the live OEE scores gave them real-time feedback on their performance. This encouraged a stronger sense of ownership, leading to quicker reactions and better teamwork across departments.
What to Look for in Easy-to-Use OEE Software for Your Team
Simple Setup and Fast Implementation
One of the first things to look for in OEE software is how quickly it can be set up. A good system should require minimal training and allow your team to get started without needing technical expertise. Look for tools that offer an easy onboarding process and can integrate smoothly with your existing machines or processes.
Clear and Visual Dashboards
Effective OEE software should present data in a way that’s easy to understand. Visual dashboards with colour indicators and simple graphs help your team see performance issues at a glance. This allows for faster decisions on the shop floor and ensures that everyone—from operators to managers—can stay aligned.
Real-Time Data and Alerts
Real-time tracking is essential for spotting issues as they happen. Choose software that updates instantly and offers alerts when performance drops. These features help reduce downtime and prevent small problems from turning into major delays.
Customisable to Fit Your Needs
No two teams are the same, so it’s important that your OEE software can be tailored to your operations. Look for options that let you adjust metrics, layout, and reporting formats so the tool fits how your team works—not the other way around.
Easy Reporting and Sharing
The ability to generate quick, clear reports is another must-have. Your software should make it simple to export data, track trends, and share insights with your wider team. This helps improve accountability and supports continuous improvement efforts.