Kanban is a highly effective visual management system that helps teams visualize work, limit work in progress (WIP), and ensure smooth workflow across various stages of a process. One of the core principles of Kanban is continuous improvement. Continuous improvement refers to the ongoing effort to improve products, services, or processes by making incremental adjustments over time. Kanban encourages a culture of continual learning and refinement to enhance productivity, reduce waste, and improve quality. To achieve this, Kanban provides a set of tools and practices that help teams monitor their performance and identify areas for improvement.
1. Kanban Board
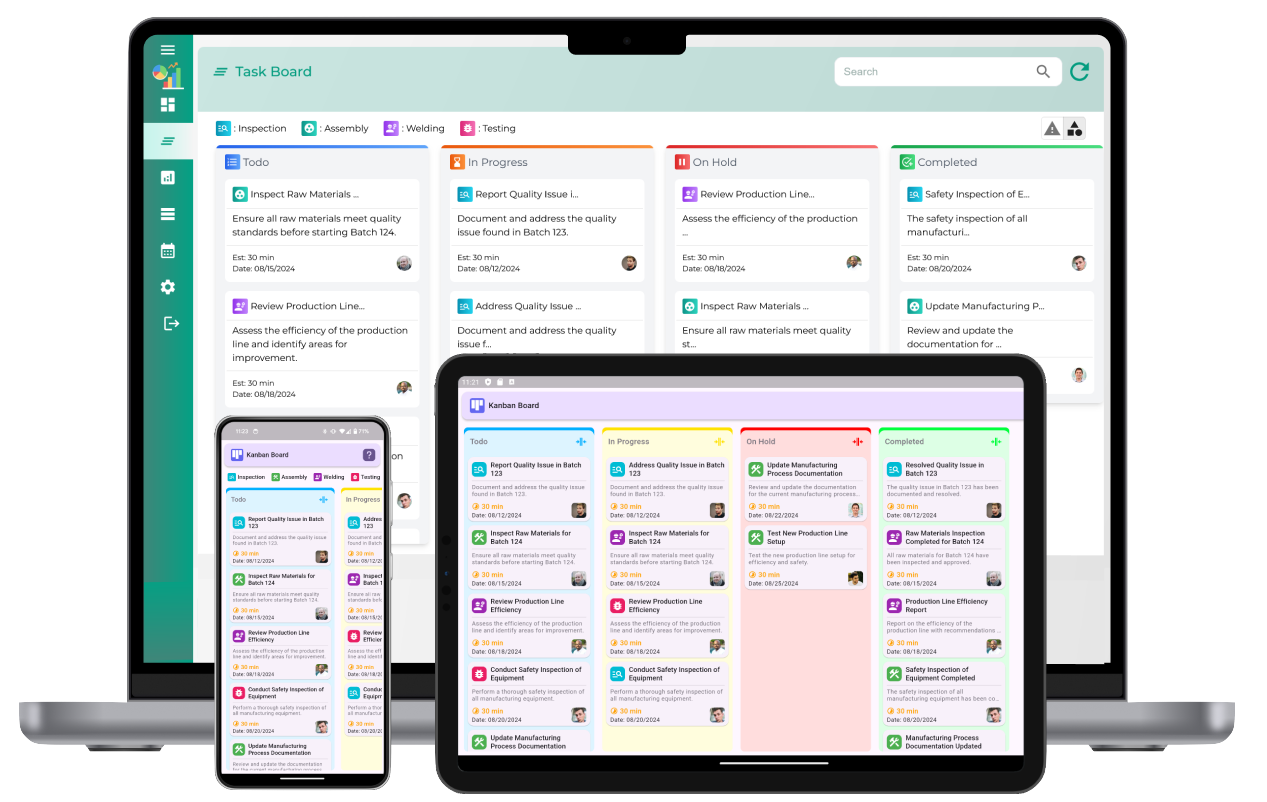
The Kanban board is the primary tool used to visualize work and track its progress. It displays tasks, typically represented as cards, as they move through various stages of a workflow. A typical Kanban board is divided into columns that represent different stages such as "To Do," "In Progress," and "Done." Teams can customize the columns to reflect their unique workflow or project stages. The Kanban board offers several benefits that contribute to continuous improvement:
- Visualizing Workflow: The board allows team members to see the status of every task at a glance. This transparency promotes a shared understanding of what needs to be done and helps identify potential bottlenecks in the process.
- Tracking Work in Progress: By tracking the movement of tasks through the board, teams can assess how efficiently work is flowing. If tasks are piling up in one stage, it signals a bottleneck that needs attention.
- Improved Communication: The Kanban board serves as a central communication tool. It is accessible to all team members, providing a shared space where updates and changes to tasks can be easily communicated.
2. Work In Progress (WIP) Limits
Limiting work in progress (WIP) is one of the most effective tools for continuous improvement in Kanban. WIP limits restrict the number of tasks that can be in any given stage at a time. By enforcing these limits, teams can focus on completing tasks before starting new ones, which helps prevent work from accumulating in any stage of the process.
Setting WIP limits encourages teams to prioritize work, focus on completing tasks efficiently, and prevent task overload. The key benefits of WIP limits include:
- Better Focus: When WIP limits are in place, team members are encouraged to focus on fewer tasks at a time, which leads to better task completion and higher quality work.
- Faster Delivery: By limiting the number of tasks in progress, teams can complete tasks faster, leading to shorter cycle times and quicker delivery of value.
- Identifying Bottlenecks: WIP limits highlight where tasks are getting stuck. If a particular stage is consistently full, it indicates a bottleneck that can be addressed to improve flow.
3. Cumulative Flow Diagram (CFD)
The Cumulative Flow Diagram (CFD) is a graphical tool used to visualize the flow of work across different stages over time. It shows the number of tasks in each column of the Kanban board (such as "To Do," "In Progress," and "Done") at different points in time. The CFD is a powerful tool for monitoring workflow performance and identifying trends or problems.
By analyzing the CFD, teams can gain valuable insights into their workflow, such as:
- Cycle Time Analysis: The CFD provides a clear view of how long tasks spend in each stage. By analyzing cycle time, teams can identify where delays occur and take action to reduce bottlenecks.
- Workload Distribution: The CFD helps teams visualize the distribution of work across different stages. If tasks are piling up in a particular stage, it indicates an imbalance that can be addressed by adjusting WIP limits or improving process flow.
- Predictability: The CFD enables teams to forecast future performance based on historical data. This predictive capability helps teams plan and make informed decisions about their workflow.
4. Flow Metrics
Flow metrics are key performance indicators (KPIs) used to measure how efficiently work is moving through the Kanban system. These metrics provide teams with real-time data that helps them track their progress, assess their performance, and identify areas for improvement. Some of the most common flow metrics in Kanban include:
- Cycle Time: Cycle time measures the time it takes for a task to move from the "To Do" stage to the "Done" stage. Shortening cycle time is a key goal of continuous improvement in Kanban.
- Lead Time: Lead time refers to the total time it takes for a task to move through the entire workflow, from start to finish. By reducing lead time, teams can improve their ability to deliver work quickly and consistently.
- Throughput: Throughput measures the number of tasks completed within a specific time period. Increasing throughput indicates that the team is delivering more value in less time.
- Work In Progress (WIP) Count: WIP count measures the total number of tasks that are in progress at any given time. By tracking WIP, teams can ensure that they are not overloading the system and can make adjustments as needed.
5. Kaizen (Continuous Improvement) Meetings
Kaizen is the Japanese term for "continuous improvement," and it is a central philosophy in the Kanban system. Kaizen meetings are regular meetings where teams reflect on their performance, discuss areas for improvement, and develop action plans to optimize their workflow. These meetings are an important tool for fostering a culture of continuous improvement in the Kanban system.
Kaizen meetings typically focus on the following areas:
- Identifying Problems: Team members review the workflow to identify issues or inefficiencies that may be hindering performance. This could include bottlenecks, delays, or communication problems.
- Discussing Solutions: The team collaborates to develop solutions to the identified problems. This may involve adjusting WIP limits, improving communication, or making changes to the Kanban board.
- Tracking Progress: The team tracks the effectiveness of the improvements made during previous Kaizen meetings. This ensures that the team is continually refining their process and making measurable progress toward their goals.
6. Retrospectives
Retrospectives are another key tool for continuous improvement in Kanban. A retrospective is a meeting where team members reflect on a completed work cycle or iteration to evaluate what went well, what didn’t, and what could be improved. Retrospectives provide a structured opportunity for teams to assess their performance and take actionable steps to improve future workflows.
Retrospectives typically involve the following activities:
- Reviewing Completed Work: The team reviews the tasks completed during the previous cycle, identifying successes and challenges.
- Identifying Improvement Opportunities: The team discusses areas where they can improve, whether it's related to communication, processes, or tools.
- Actionable Commitments: The team agrees on concrete actions that will be taken to improve the process, ensuring that improvements are made in future cycles.
Kanban continuous improvement tools
What is a Kanban board?
A Kanban board is a visual tool used to manage and track the flow of work within a process, providing a clear overview of tasks and their current status.
How does a Kanban system improve workflow?
A Kanban system improves workflow by visualizing work items, limiting work-in-progress, and promoting smooth, continuous flow, reducing delays and inefficiencies.
What are the key principles of Kanban?
The key principles of Kanban include visualizing the workflow, limiting work-in-progress, managing flow, making process policies explicit, and seeking continuous improvement.
How does Kanban support continuous improvement?
Kanban supports continuous improvement by enabling teams to review and refine their processes regularly, identifying inefficiencies, and implementing small changes to optimize flow.
What is a work-in-progress (WIP) limit in Kanban?
A work-in-progress (WIP) limit in Kanban is a constraint that limits the number of tasks allowed in any given stage of the workflow, preventing overloading and ensuring focus on completing tasks before starting new ones.
How does WIP limitation help improve processes in Kanban?
WIP limitation helps improve processes by encouraging teams to focus on completing tasks before starting new ones, which reduces delays, ensures higher quality, and improves throughput.
What are the benefits of using Kanban in team management?
Kanban improves team management by promoting transparency, enhancing communication, reducing bottlenecks, improving focus, and providing clear insights into task progress and performance.
What is the difference between Kanban and Scrum?
Kanban is a flow-based system focusing on visualizing work and continuous improvement, while Scrum is an iterative framework that organizes work into fixed-length sprints with predefined roles and ceremonies.
What are the common types of Kanban boards?
The common types of Kanban boards include physical boards (using sticky notes) and digital boards (using software tools), each allowing teams to track tasks, set WIP limits, and manage workflow.
What is a Kanban pull system?
A Kanban pull system is where work items are pulled into the next stage only when there is capacity, preventing overloading and ensuring smooth flow from one process stage to the next.
How can Kanban be used for personal productivity?
Kanban can be used for personal productivity by organizing tasks in a simple visual board, setting priorities, and focusing on completing tasks before taking on new ones, improving efficiency and reducing overwhelm.
What are the visual elements of a Kanban board?
Visual elements of a Kanban board include columns (representing process stages), cards (representing tasks), and WIP limits (to constrain the number of tasks in each column), all designed to provide clarity and track progress visually.
How do you track performance in Kanban?
Performance in Kanban is tracked through metrics such as lead time (time to complete a task), cycle time (time spent in a stage), throughput (number of tasks completed), and WIP (work in progress) to identify bottlenecks and optimize flow.
How can teams manage bottlenecks using Kanban?
Teams can manage bottlenecks using Kanban by monitoring flow, identifying stages with excessive WIP or delays, and making adjustments to optimize process efficiency, such as redistributing tasks or adjusting WIP limits.
What tools can be used to analyze Kanban flow data?
Kanban flow data can be analyzed using various metrics and visualizations like cumulative flow diagrams, lead time/cycle time charts, and throughput analysis, helping teams identify inefficiencies and areas for improvement.