Kanban charts are an essential tool for tracking and managing tasks in a visual and systematic way. By representing work items in a flow, Kanban helps teams optimize their processes, manage workloads, and achieve greater efficiency. In Kanban systems, work items are represented as cards that move through different stages, allowing teams to visualize progress and bottlenecks in real time.
What is a Kanban Chart?
A Kanban chart is a visual representation of a workflow that helps teams track work items as they move through various stages of a process. The chart is divided into columns, each representing a different phase of work. Work items, typically represented by cards, are moved across the columns as they progress through these stages. The primary goal of a Kanban chart is to improve efficiency, reduce bottlenecks, and ensure that tasks are completed in a timely manner.
The typical columns in a Kanban chart are:
- Backlog: This is where all incoming tasks or work items are initially placed before they are prioritized.
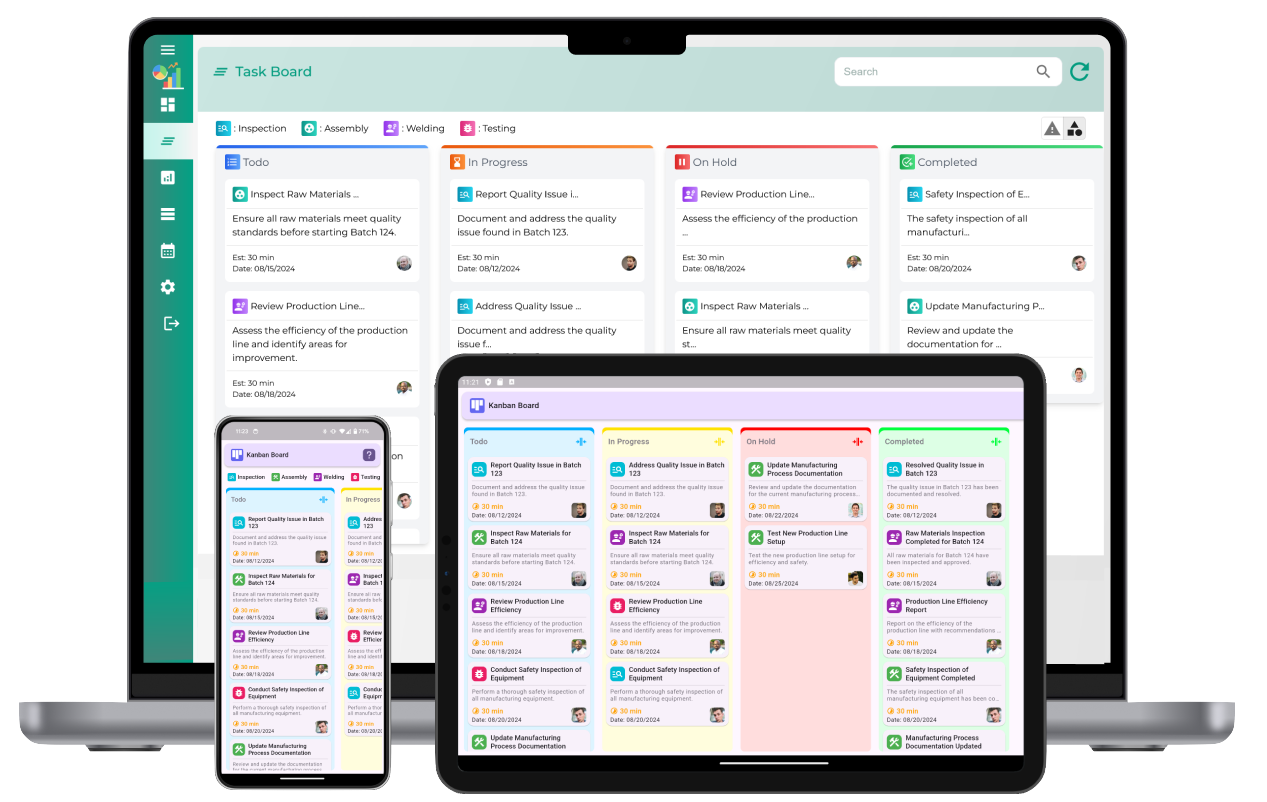
- To Do: Tasks that are ready to be worked on are moved to this column. These tasks have been prioritized and are awaiting attention.
- In Progress: Work items that are actively being worked on are placed here. This column reflects tasks that are currently in progress.
- Completed: Once tasks are finished, they move into the "Completed" column, indicating that the work is done and ready for review or delivery.
How Does a Kanban Chart Work?
Kanban charts work by visualizing the flow of tasks from one stage to another. The system operates on the principle of limiting work in progress (WIP), which ensures that no more tasks are started than can be handled at any given time. This practice helps prevent task overload, improves focus, and reduces the chances of bottlenecks in the workflow.
The basic principle of the Kanban chart can be summarized as follows:
- Visualizing Workflow: The chart provides a clear picture of the entire workflow, helping teams see exactly where each task is in the process.
- Limiting Work in Progress (WIP): By limiting the number of tasks in each stage, teams ensure that tasks are completed before new ones are started, improving focus and efficiency.
- Managing Flow: The chart helps teams monitor the flow of tasks across stages, identifying any bottlenecks or areas where work is getting stuck.
- Continuous Improvement: Kanban charts promote continuous improvement by encouraging teams to analyze the flow of work and identify opportunities for process optimization.
Tracking Progress in Kanban
Tracking progress in a Kanban system is crucial for managing tasks effectively and ensuring that work is completed efficiently. By tracking progress, teams can identify bottlenecks, optimize workflows, and ensure that projects stay on track. Here are several strategies for tracking progress in Kanban:
1. Monitor Task Movement
The most fundamental way to track progress in Kanban is to monitor how tasks move from one column to another. As tasks progress through the workflow, they should be moved to the next stage in a timely manner. If tasks are getting stuck in one column for too long, it may indicate a bottleneck or issue that needs to be addressed.
For example, if many tasks are piling up in the "In Progress" column, it could suggest that the team is struggling to complete tasks quickly enough. Conversely, if tasks are not entering the "In Progress" column due to a lack of available work, it could suggest that there is a backlog of unassigned work that needs attention.
2. Use Work In Progress (WIP) Limits
WIP limits are an essential part of the Kanban methodology. They help prevent bottlenecks and ensure that teams are not overwhelmed with too many tasks at once. By setting a WIP limit for each column, teams can focus on completing existing tasks before starting new ones.
WIP limits are an effective way to track progress because they force teams to monitor how much work is being done in each stage. If the WIP limit is exceeded, the team must address the issue before taking on additional tasks. This creates a natural feedback loop that helps improve productivity and ensures that tasks are completed efficiently.
3. Measure Lead Time and Cycle Time
Lead time and cycle time are two important metrics used to track progress in Kanban:
- Lead Time: The total time it takes for a work item to move from the "Backlog" column to the "Completed" column. Lead time includes both active work time and waiting time.
- Cycle Time: The time it takes for a work item to move through the "To Do," "In Progress," and "Completed" stages. Cycle time measures the time spent actively working on a task, excluding waiting time.
By measuring lead time and cycle time, teams can gain insights into how quickly work is being completed and where delays are occurring. This data can help teams identify inefficiencies and optimize their workflow.
4. Analyze Bottlenecks
One of the key benefits of using Kanban charts is the ability to identify and address bottlenecks in the workflow. A bottleneck occurs when work items accumulate in a particular stage, indicating that the process is not flowing smoothly. Bottlenecks can occur for various reasons, such as lack of resources, insufficient capacity, or task dependencies.
By closely monitoring the movement of tasks and analyzing where work is getting stuck, teams can pinpoint bottlenecks and take corrective action. This might involve reallocating resources, adjusting WIP limits, or implementing process improvements to streamline the workflow.
5. Continuous Improvement with Feedback Loops
Kanban is based on the principle of continuous improvement. As teams track progress and analyze their workflow, they should regularly gather feedback to identify opportunities for optimization. This feedback can come from team members, stakeholders, or even the data itself, such as cycle time or lead time.
By incorporating feedback loops into the process, teams can make incremental improvements that enhance the efficiency of the workflow and reduce delays. This ongoing refinement helps teams stay agile and responsive to changes in demand or project requirements.
Kanban Charts & How to Track Progress in Kanban
What is a Kanban chart?
A Kanban chart is a visual tool used to manage and track work as it progresses through stages in a process. It uses columns and cards to represent tasks and workflow, helping teams visualize and manage the flow of work efficiently.
How do Kanban charts help in tracking progress?
Kanban charts help track progress by visually showing the status of tasks as they move through different stages. This provides real-time insights into work completion and allows teams to identify bottlenecks and delays quickly, improving overall workflow efficiency.
What are the key components of a Kanban chart?
The key components of a Kanban chart include columns, which represent different stages of the workflow, and cards, which represent individual tasks. The cards move across columns as work progresses, providing a visual representation of task status.
How does a Kanban chart visualize work progress?
A Kanban chart visualizes work progress by displaying tasks in columns that represent stages in the workflow, such as "To Do," "In Progress," and "Completed." As tasks move from one stage to the next, their progress is immediately visible to the team.
How do you set up a Kanban chart?
To set up a Kanban chart, create columns that represent the stages of your workflow, such as "To Do," "In Progress," and "Done." Then, create cards for each task and move them through the columns as work progresses. You can use physical boards or digital tools to implement this system.
What are the different types of Kanban charts?
Common types of Kanban charts include basic Kanban boards (with columns for task stages), cumulative flow diagrams (which track work over time), and velocity charts (which measure the rate at which work is completed). These charts provide different perspectives on work progress and efficiency.
How do Kanban charts help with prioritization?
Kanban charts help prioritize tasks by allowing users to move high-priority cards to the top of the board or color-code tasks to indicate priority levels. This makes it clear which tasks need immediate attention and which can be addressed later.
Can Kanban charts track multiple projects at once?
Yes, Kanban charts can track multiple projects at once by creating separate boards or columns for each project. This allows teams to monitor and manage multiple workflows simultaneously while maintaining clear visibility of each project’s progress.
What is the role of columns in a Kanban chart?
Columns in a Kanban chart represent different stages of the workflow. Each column provides a visual cue about the current status of tasks, such as "To Do," "In Progress," or "Completed." Tasks move from one column to another as they progress through the workflow.
How do you track bottlenecks using Kanban charts?
Bottlenecks are tracked using Kanban charts by observing stages where tasks accumulate or get delayed. If tasks are not moving from one column to another quickly, it indicates a bottleneck, which can then be addressed by adjusting workflows or allocating additional resources.
Can you use Kanban charts for personal task management?
Yes, Kanban charts are effective for personal task management. You can create a board with columns representing personal task stages and track your progress on various tasks. This helps you stay organized and visualize your work as it moves through each stage.
How can you improve team performance using Kanban charts?
Team performance can be improved by using Kanban charts to track progress, identify bottlenecks, and balance workloads. The visual nature of Kanban helps teams stay focused on priorities, optimize workflows, and collaborate effectively, leading to faster task completion and better overall performance.
How do you measure cycle time using Kanban charts?
Cycle time can be measured by tracking the time it takes for a task to move from the "To Do" column to the "Completed" column. This data helps identify how long tasks typically take to complete and provides insights into workflow efficiency and areas for improvement.
What role does the "Work in Progress" (WIP) limit play in Kanban charts?
The Work in Progress (WIP) limit sets a maximum number of tasks that can be in a given column at once. This prevents overloading team members and ensures a smooth flow of work. WIP limits help identify bottlenecks and maintain focus on completing tasks before starting new ones.
How do Kanban charts help in maintaining continuous flow?
Kanban charts help maintain continuous flow by visually displaying work as it progresses and ensuring that tasks are moved through stages efficiently. The use of WIP limits, task prioritization, and real-time updates helps prevent work from stalling and keeps the workflow steady and uninterrupted.