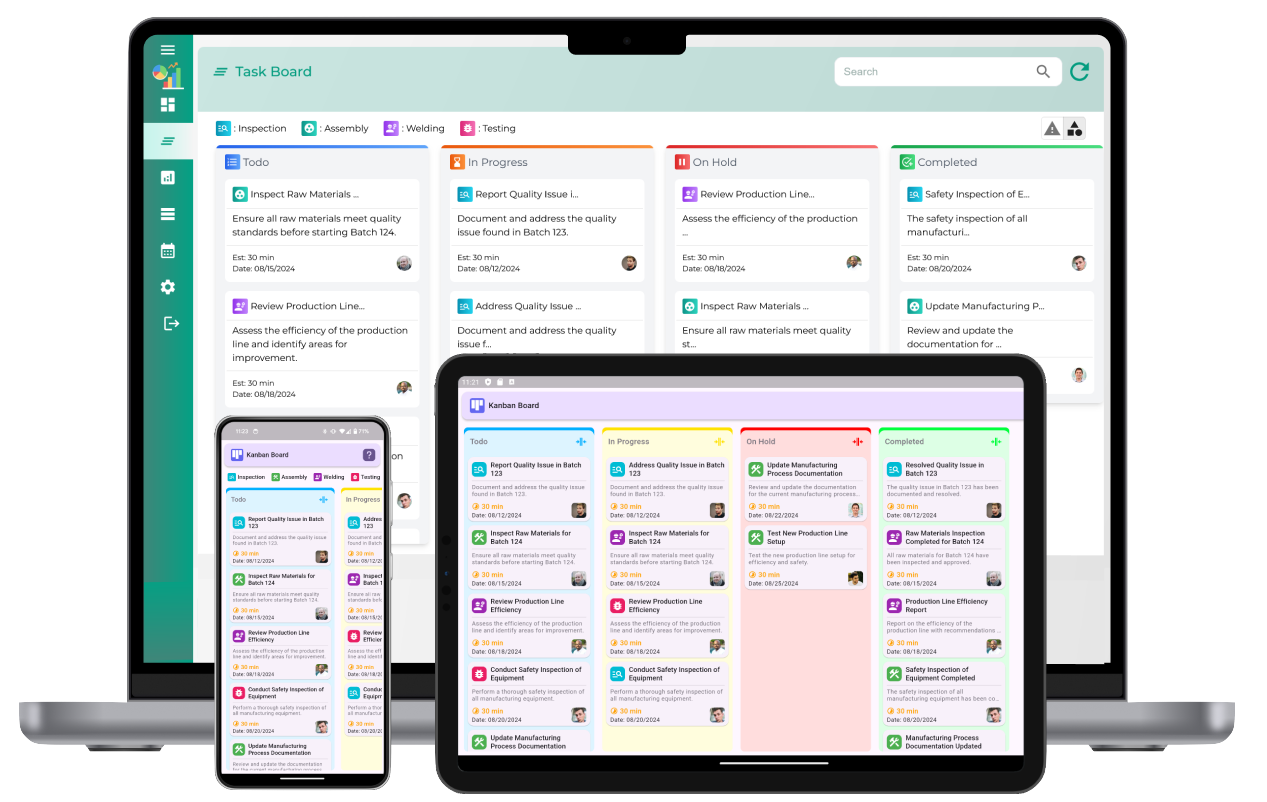
Kanban Board reports are essential tools that help teams monitor progress, analyze performance, and make data-driven decisions for optimizing workflows. A Kanban board organizes tasks in columns to represent different stages of a workflow. Reports generated from the board provide insights into key metrics like cycle time, lead time, and work-in-progress (WIP) limits, which help identify bottlenecks, measure productivity, and ensure efficient task completion.
What are Kanban Board Reports?
Kanban board reports are analytical tools that extract data from a Kanban board to provide a visual representation of performance and workflow efficiency. These reports track metrics related to task movement, completion rates, and overall workflow performance. By using Kanban board reports, teams can better understand how work progresses through each stage and address areas that need improvement. Key types of Kanban reports include cumulative flow diagrams, cycle time reports, and WIP reports, each offering unique insights into specific aspects of task management.
Types of Kanban Board Reports
Kanban board reports can vary depending on the needs of the team and the type of data being analyzed. Here are some of the most commonly used reports:
1. Cumulative Flow Diagram (CFD)
Definition: The Cumulative Flow Diagram is a graphical representation of tasks in each stage of the workflow over time. It helps teams visualize the distribution of tasks across stages and identify trends in work progression.
Benefits: By observing the flow of tasks, teams can identify bottlenecks where tasks may be piling up, showing where adjustments are needed to maintain steady progress. This report also highlights if there is a need to increase resources for certain stages.
2. Cycle Time Report
Definition: The Cycle Time Report measures the time taken for a task to move from the “In Progress” stage to “Completed.” Cycle time is a critical metric for assessing task completion speed.
Benefits: Lower cycle times indicate faster task processing. By regularly monitoring cycle time, teams can work on reducing delays, ultimately improving overall workflow efficiency. It also provides insight into team performance, helping to identify areas for improvement.
3. Lead Time Report
Definition: Lead time measures the total time taken from when a task is created until it is completed, tracking the entire lifecycle of a task from request to delivery.
Benefits: A shorter lead time often means better efficiency in meeting deadlines and customer expectations. Monitoring lead time helps teams address issues early in the process, ensuring timely task completion.
4. Work-in-Progress (WIP) Report
Definition: The WIP Report monitors the number of tasks in each stage of the workflow, particularly focusing on tasks currently in progress.
Benefits: By limiting WIP, teams can avoid overloading specific stages and improve task focus. WIP reports are valuable for balancing workloads and ensuring tasks do not accumulate in certain stages.
5. Throughput Report
Definition: The Throughput Report calculates the number of tasks completed in a specific time period, such as a week or month.
Benefits: Throughput provides insight into team productivity and the overall task completion rate. High throughput rates indicate that the team is meeting goals, while lower rates may suggest issues that need addressing.
6. Blocker Clustering Report
Definition: The Blocker Clustering Report identifies tasks that are frequently blocked, tracking the frequency and reasons for blockages.
Benefits: Blockers slow down task progression, so identifying recurring blockers allows teams to address and prevent them in the future. This report supports continuous improvement and ensures smoother workflows.
Benefits of Using Kanban Board Reports
Kanban board reports offer numerous advantages that help teams optimize productivity and achieve better workflow management. Key benefits include:
1. Enhanced Workflow Visibility
Kanban board reports offer a clear view of task progression, helping teams visualize how work moves through each stage. This visibility enables quick identification of areas that require improvement.
2. Data-Driven Decision Making
With data on cycle time, WIP, and throughput, Kanban reports empower teams to make decisions based on real-time data rather than assumptions. This leads to more informed choices regarding resource allocation and process adjustments.
3. Improved Task Prioritization
By tracking lead times and cycle times, teams can identify tasks that require immediate attention. Kanban reports help prioritize work based on urgency, complexity, and time constraints, ensuring smooth progress.
4. Reduced Bottlenecks
Reports like the Cumulative Flow Diagram highlight stages where tasks accumulate, indicating bottlenecks. By identifying and addressing these, teams can improve efficiency and reduce delays.
5. Continuous Process Improvement
Kanban board reports support continuous improvement by identifying trends and areas for optimization. Teams can track performance over time, implement changes, and measure their impact on overall workflow.
How to Implement Effective Kanban Board Reporting
To maximize the benefits of Kanban board reports, teams should follow these best practices:
- Set Clear Goals: Identify what you want to achieve with each report. For example, a Cycle Time Report might aim to reduce average task completion time by a specific percentage.
- Use Consistent Metrics: Establish consistent metrics across projects to make data analysis easier and ensure comparability between different workflows.
- Analyze Reports Regularly: Set a schedule to review reports periodically. Regular analysis helps teams stay proactive and make timely adjustments to workflows.
- Encourage Team Participation: Involve team members in the reporting process. By encouraging them to review reports, they can take ownership of their contributions and stay engaged in continuous improvement.
- Focus on Continuous Improvement: Use insights from reports to implement gradual changes. Track how these changes impact the workflow and continue refining processes over time.
Challenges of Using Kanban Board Reports
While Kanban board reports offer numerous advantages, teams may face some challenges, including:
- Overwhelming Data: Too much data can be overwhelming. Focus on key metrics and avoid overloading the team with unnecessary details.
- Inconsistent Updates: Accurate reporting relies on consistent task updates. Ensure team members regularly update task statuses to maintain report accuracy.
- Potential Resistance to Analysis: Not everyone may be open to performance tracking. Foster a positive environment where reports are viewed as tools for improvement, not judgment.
Kanban Board Reports
What are Kanban board reports?
Kanban board reports analyze workflow data to provide insights on process efficiency, productivity, and bottlenecks. These reports help teams optimize performance and improve workflow.
Why are Kanban reports important?
Kanban reports are important as they provide data on task flow, help teams identify inefficiencies, measure key metrics, and enable better decision-making to enhance productivity.
What types of reports are commonly used in Kanban?
Common Kanban reports include cumulative flow diagrams, cycle time reports, lead time reports, throughput reports, and work-in-progress (WIP) reports, each offering specific workflow insights.
How does a cumulative flow diagram work in Kanban reporting?
A cumulative flow diagram shows task status across stages over time, highlighting workflow stability and helping to identify bottlenecks by analyzing task accumulation in each stage.
What is a cycle time report in Kanban?
A cycle time report measures the time taken for a task to move from start to completion, helping teams evaluate process efficiency and estimate timelines for similar future tasks.
How does a lead time report help in Kanban?
Lead time reports track the time from task initiation to final completion, providing insight into process speed and helping teams predict task duration for better planning.
What insights can a throughput report provide?
Throughput reports measure the number of tasks completed in a period, allowing teams to assess productivity, set realistic goals, and track performance trends over time.
How do Kanban reports help identify bottlenecks?
Kanban reports highlight stages where tasks accumulate, indicating potential bottlenecks. By analyzing these, teams can address issues that delay workflow and improve efficiency.
Can Kanban reports improve team productivity?
Yes, Kanban reports provide data on task flow and identify areas for improvement, helping teams streamline processes, reduce delays, and enhance overall productivity.
How does a work-in-progress (WIP) report work in Kanban?
A WIP report shows the number of tasks in each stage at any given time. It helps manage workload by ensuring tasks move consistently and limits excess work in any phase.
What is the purpose of a burn-down chart in Kanban?
A burn-down chart tracks the progress of task completion over time, offering a visual of work remaining and helping teams manage time to meet deadlines effectively.
How can Kanban reports support continuous improvement?
Kanban reports identify workflow inefficiencies, measure improvements, and provide data for refinement. Regularly analyzing them enables ongoing adjustments for better performance.
Can Kanban reports be customized?
Yes, many Kanban systems allow for customizable reports. Teams can tailor reports to focus on specific metrics, workflows, or time periods relevant to their unique processes.
What role does a flow efficiency report play in Kanban?
Flow efficiency reports measure the ratio of active work time to waiting time, showing how efficiently tasks progress through stages and helping to improve process flow.
How do Kanban reports aid in decision-making?
Kanban reports provide data-driven insights on task progress, productivity, and areas for improvement, enabling managers to make informed decisions to optimize workflows.