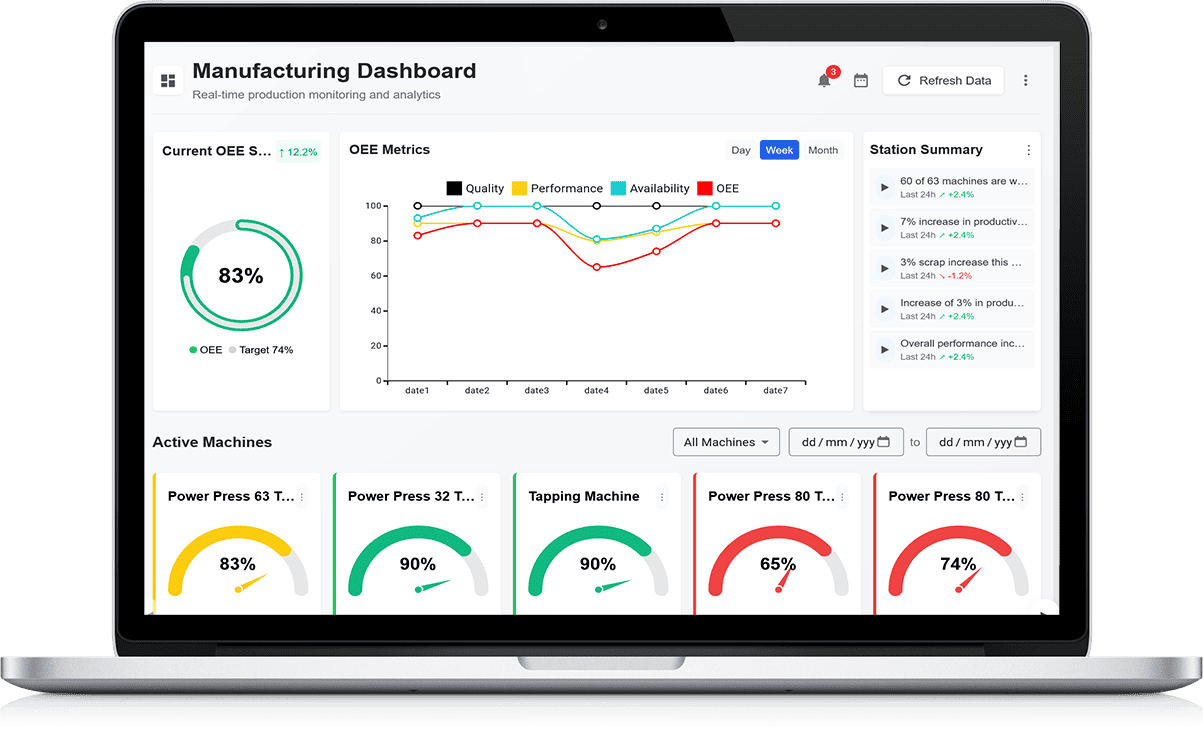
What Is an Inventory Management Dashboard in Manufacturing?
Understanding Inventory Dashboardse in Manufacturing
An inventory management dashboard in manufacturing is a central visual tool that displays real-time and historical inventory data in one place. It helps manufacturers monitor stock levels, material movement, and inventory status across the entire production environment. Instead of relying on spreadsheets or manual reports, teams can view accurate data through charts, tables, and indicators that are easy to understand.
Connecting Inventory to Production Activities
The dashboard links inventory data directly with production operations. It shows how raw materials, work-in-progress, and finished goods move through the manufacturing process. This connection allows planners and supervisors to understand whether inventory supports production schedules or creates bottlenecks.
Improving Visibility and Control
By providing a single source of truth, the dashboard improves transparency across departments. Production, procurement, and warehouse teams can all work with the same data, reducing confusion and miscommunication. Managers gain better control over stock usage and replenishment decisions.
Supporting Better Decision-Making
With clear and timely insights, manufacturers can make faster and more informed decisions. Inventory Dashboardse help identify excess stock, shortages, or slow-moving items, supporting efficient operations and reduced waste.
Why Real-Time Inventory Visibility Is Critical for Manufacturers
Eliminating Delays and Guesswork
Real-time inventory visibility allows manufacturers to see current stock levels instantly, without waiting for manual updates. This removes guesswork and delays that often lead to poor decisions, production stoppages, or unnecessary ordering.
Preventing Production Disruptions
When inventory data is updated in real time, teams can quickly identify material shortages before they impact production. This helps manufacturers maintain smooth operations and meet delivery commitments without last-minute disruptions.
Supporting Faster Response to Changes
Manufacturing environments change rapidly due to demand shifts or supply delays. Real-time visibility enables quick adjustments to production plans, purchasing decisions, and inventory allocation, keeping operations flexible and resilient.
Improving Cross-Team Coordination
When all teams have access to live inventory data, collaboration improves. Production, purchasing, and warehouse teams stay aligned, reducing errors and ensuring materials are available when and where they are needed.
Key Metrics Tracked in a Manufacturing Inventory Dashboard
Stock Levels and Inventory Value
One of the most important metrics tracked is current stock levels across raw materials, work-in-progress, and finished goods. Dashboards also display inventory value, helping manufacturers understand capital tied up in stock.
Inventory Turnover and Usage Rates
Inventory turnover shows how quickly materials move through production. Monitoring usage rates helps identify slow-moving or excess stock that may require action to avoid waste or obsolescence.
Reorder Points and Safety Stock
Dashboards track reorder levels and safety stock thresholds to ensure materials are replenished on time. Alerts help teams act before shortages occur, supporting uninterrupted production.
Inbound and Outbound Movements
Tracking incoming deliveries and outgoing shipments provides visibility into material flow. This helps manufacturers plan storage, production schedules, and dispatch activities more effectively.
Reducing Stockouts and Overproduction with Live Inventory Data
Maintaining the Right Stock Balance
Live inventory data helps manufacturers maintain optimal stock levels by showing exactly what is available at any moment. This balance reduces the risk of running out of critical materials or producing more than required.
Improving Production Planning Accuracy
Accurate inventory data supports better production planning. Planners can schedule jobs confidently, knowing materials are available, which reduces last-minute changes and production delays.
Reducing Excess Inventory Costs
Overproduction leads to excess storage, handling, and holding costs. Live data allows manufacturers to match production closely with demand, minimising unnecessary stock build-up.
Supporting Proactive Inventory Decisions
With real-time insights, teams can take proactive action, such as adjusting order quantities or production volumes, preventing issues before they impact operations.
Improving Inventory Accuracy Across the Shop Floor
Reducing Manual Data Errors
Manual inventory tracking often leads to inaccuracies. Dashboards that capture data automatically from shop floor activities reduce errors and ensure records reflect actual stock conditions.
Enhancing Traceability and Control
Improved accuracy allows manufacturers to trace materials throughout the production process. This helps identify discrepancies quickly and maintain tighter control over inventory movement.
Supporting Operator Accountability
Clear inventory data encourages accountability among shop floor teams. Operators understand the importance of accurate reporting, supporting reliable stock records and smoother workflows.
Building Trust in Inventory Data
Accurate inventory information builds confidence across departments. Teams rely on the data for planning and decision-making, reducing disputes and rework.
Optimising Raw Material, WIP, and Finished Goods Inventory
Balancing Inventory Across All Stages
An inventory dashboard helps manufacturers balance stock across raw materials, work-in-progress, and finished goods. This ensures materials flow smoothly without creating bottlenecks or excess stock.
Reducing Work-in-Progress Delays
Monitoring WIP levels helps identify slow-moving processes. Manufacturers can take corrective action to improve flow and reduce lead times.
Improving Finished Goods Availability
Optimised finished goods inventory ensures customer orders can be fulfilled on time without excessive storage. Dashboards support better alignment between production output and demand.
Supporting Lean Manufacturing Goals
By optimising inventory at each stage, manufacturers reduce waste, improve efficiency, and support lean operational practices.
Using Dashboards to Improve Demand Planning and Forecasting
Turning Data into Forecasting Insights
Inventory dashboards combine historical and real-time data to support accurate demand planning. Trends in usage and stock movement help manufacturers anticipate future requirements.
Improving Forecast Accuracy
With clear visibility into inventory patterns, planners can create more reliable forecasts. This reduces reliance on assumptions and improves production and purchasing decisions.
Aligning Inventory with Market Demand
Dashboards help align inventory levels with actual demand, preventing shortages during peak periods and excess stock during slow periods.
Supporting Long-Term Planning
Accurate forecasting supported by dashboards enables manufacturers to plan capacity, procurement, and inventory strategies more effectively, ensuring sustainable and efficient operations.
Controlling Inventory Costs with Data-Driven Insights
Understanding True Inventory Cost Drivers
Inventory costs are influenced by more than just purchase prices. Storage, handling, obsolescence, and stock write-offs all contribute to rising costs. Data-driven insights help organisations clearly understand where these costs originate and how they change over time. By analysing stock levels, turnover rates, and demand patterns, businesses gain visibility into inefficient inventory practices that often go unnoticed.
Reducing Waste and Unnecessary Holding Costs
Accurate inventory data allows teams to identify excess stock and reduce over-ordering. When decision-makers can see real-time stock positions, they can adjust purchasing and production plans to avoid unnecessary holding costs. This approach reduces wasted space, lowers insurance and handling expenses, and prevents capital from being tied up in unused inventory.
Supporting Smarter Financial Decisions
Data-driven insights connect inventory performance directly to financial outcomes. Managers can evaluate how inventory decisions affect cash flow, margins, and working capital. This clarity supports better budgeting and forecasting while ensuring inventory strategies remain aligned with wider business goals.
Enhancing Production Planning with Integrated Inventory Dashboards
Aligning Inventory with Production Needs
Integrated inventory dashboards give production teams immediate visibility into material availability. This alignment ensures production schedules are based on accurate stock data rather than assumptions. When inventory and production planning work together, delays caused by missing materials are significantly reduced.
Improving Scheduling and Resource Allocation
Dashboards provide planners with a clear overview of current stock, incoming supplies, and usage rates. This information supports realistic production schedules and better resource allocation. Teams can plan workloads confidently, reduce last-minute changes, and avoid production downtime caused by inventory shortages.
Supporting Consistent Output and Delivery
With reliable inventory visibility, organisations can maintain consistent production output. This stability improves delivery performance and strengthens customer confidence. Integrated dashboards also help identify risks early, allowing planners to adjust before problems impact operations.
Identifying Slow-Moving and Excess Stock Quickly
Spotting Inventory That Ties Up Capital
Slow-moving and excess stock often consume valuable space and working capital. Without clear visibility, these items can remain unnoticed for long periods. Inventory dashboards highlight low-turnover items, enabling teams to take action before stock becomes obsolete.
Supporting Proactive Inventory Decisions
By identifying slow-moving items early, organisations can adjust purchasing, production, or sales strategies. Actions such as reducing order quantities or reallocating stock across locations help prevent further accumulation and minimise losses.
Improving Inventory Health
Regular monitoring of stock movement improves overall inventory health. Teams can maintain balanced stock levels, improve turnover rates, and ensure inventory supports operational needs rather than restricting them.
Supporting Lean Manufacturing with Visual Inventory Management
Making Inventory Status Easy to Understand
Visual inventory management supports lean manufacturing by making stock levels clear and easy to interpret. Dashboards present complex data in simple visual formats, allowing teams to identify issues quickly without lengthy analysis.
Reducing Waste and Overproduction
Lean principles focus on eliminating waste, including excess inventory. Visual tools help teams maintain optimal stock levels and avoid overproduction. Clear visibility encourages disciplined inventory control and supports just-in-time practices.
Encouraging Continuous Improvement
Visual management fosters a culture of continuous improvement. Teams can easily track progress, discuss issues, and implement improvements that strengthen efficiency and reduce waste across operations.
Standardising Inventory Reporting Across Plants and Warehouses
Creating Consistent Inventory Metrics
Standardised reporting ensures all plants and warehouses measure inventory performance using the same definitions and metrics. This consistency allows leaders to compare performance accurately and identify best practices.
Improving Data Accuracy and Trust
When reporting standards are consistent, data accuracy improves and confidence in reports increases. Teams spend less time reconciling numbers and more time focusing on improvement actions.
Supporting Centralised Decision-Making
Standardised inventory reports provide leadership with a reliable, organisation-wide view. This visibility supports better coordination, planning, and strategic decision-making across multiple locations.
Integrating Inventory Dashboards with ERP and Manufacturing Systems
Creating a Connected Data Environment
Integration ensures inventory dashboards receive accurate, up-to-date data from operational systems. This connection reduces manual data entry and improves reporting reliability.
Enhancing Visibility Across Operations
Integrated systems allow teams to see how inventory interacts with production, purchasing, and logistics. This broader visibility supports better coordination and faster responses to changing conditions.
Supporting Scalable Inventory Management
As organisations grow, integrated dashboards support scalable inventory management. New locations and processes can be added without disrupting reporting or control.
Enabling Faster Decisions with Automated Alerts and KPIs
Responding Quickly to Inventory Issues
Automated alerts notify teams when stock levels exceed limits or fall below critical thresholds. This early warning system prevents small issues from becoming major problems.
Using KPIs to Guide Action
Clear KPIs provide a focused view of inventory performance. Teams can prioritise actions based on real data rather than assumptions, improving response speed and accuracy.
Improving Operational Agility
Faster decision-making improves operational agility. Organisations can adapt quickly to demand changes and maintain control over inventory performance.
Measuring the Business Impact of an Inventory Management Dashboard
Linking Inventory Performance to Business Results
Inventory dashboards help organisations measure how inventory decisions affect costs, service levels, and cash flow. This visibility connects operational performance with financial outcomes.
Demonstrating Value Through Measurable Results
Improved stock accuracy, reduced excess inventory, and better planning can all be measured and tracked. These results demonstrate the tangible value of effective inventory management.
Supporting Continuous Improvement and Growth
By measuring impact consistently, organisations can refine inventory strategies and support sustainable growth. Dashboards provide the insight needed to improve performance over time.