What Is OEE Software and How Does It Support Industrial Production?
Understanding the Purpose of OEE Software
OEE software is a digital tool designed to measure and improve the efficiency of manufacturing equipment. It calculates Overall Equipment Effectiveness (OEE) by analysing availability, performance, and quality. This helps production teams understand how well their machines are operating and where time or resources may be lost.
Real-Time Data for Better Decision Making
One of the main advantages of using OEE software is access to real-time performance data. This allows teams to react quickly to any drop in output or increase in downtime. Instead of waiting for manual reports, staff can view live insights and take immediate action to resolve issues before they grow.
Improving Production Efficiency
OEE software helps identify hidden inefficiencies that affect output. Whether it’s frequent short stops, speed losses, or quality defects, the system makes it easier to spot and fix these problems. Over time, this leads to higher productivity and more consistent performance on the shop floor.
Supporting Continuous Improvement
Industrial teams can use the data collected by OEE software to drive ongoing improvements. By tracking trends and comparing past performance, managers can implement changes based on facts rather than guesswork. This leads to smarter investments and better resource planning.
Enhancing Team Collaboration
With shared dashboards and reports, everyone from operators to supervisors stays informed and aligned. OEE software ensures transparency, encourages accountability, and supports a culture focused on operational excellence.
Breaking Down OEE: Understanding Availability, Performance, and Quality
What Is OEE?
OEE, or Overall Equipment Effectiveness, is a key measurement used to assess how efficiently a manufacturing process is running. It combines three core elements—availability, performance, and quality—to give a clear picture of equipment productivity. By understanding each part, teams can identify specific areas to improve.
Availability: Uptime vs Downtime
Availability refers to the amount of scheduled production time that equipment is actually running. It takes into account both planned and unplanned downtime. If machines are often idle due to maintenance or unexpected breakdowns, the availability score will be lower. Improving this area means reducing stoppages and keeping production flowing smoothly.
Performance: Speed of Production
Performance measures how quickly equipment operates compared to its maximum possible speed. If a machine is running slower than expected or stops frequently, this impacts the performance rate. Monitoring speed losses, minor stops, and delays helps teams find ways to optimise the production pace.
Quality: Output That Meets Standards
Quality focuses on the number of good units produced compared to total output. Any item that needs to be reworked or discarded affects the quality score. By reducing defects and maintaining consistent standards, manufacturers can improve overall quality and reduce waste.
Putting It All Together
When availability, performance, and quality are measured together, OEE gives a complete view of equipment effectiveness. Tracking these areas helps manufacturers pinpoint problems and make targeted improvements that lead to higher output and better results.
Real-Time Monitoring: Keeping Your Production Lines Running Smoothly
Why Real-Time Monitoring Matters
Real-time monitoring helps production teams spot issues as they happen, not after they’ve caused delays. By watching equipment activity live, it’s easier to prevent downtime, avoid bottlenecks, and respond to problems before they grow into major setbacks. This constant visibility plays a key role in keeping operations steady and efficient.
Instant Alerts for Quick Action
With real-time data, alerts can be set up to notify operators of changes in machine status, unexpected stops, or performance drops. These alerts allow staff to act fast, whether it’s fixing a minor issue or adjusting workflow to avoid delays. A faster response means less waste and more productivity.
Improving Team Coordination
Live monitoring tools give all team members access to the same information, which encourages better communication. When everyone sees the same updates in real time, decisions can be made quickly and with confidence. This shared awareness helps teams stay aligned and avoid confusion.
Better Use of Maintenance Resources
Real-time insights also support smarter maintenance. By tracking patterns and performance trends, teams can schedule maintenance when it’s actually needed, reducing unplanned stops. This avoids unnecessary checks and helps keep machines running longer and smoother.
Boosting Long-Term Performance
In the long run, real-time monitoring leads to better results. It builds a culture of awareness and control, where problems are caught early and improvements happen continuously. Smooth production lines start with the right information at the right time.
How OEE Software Helps Pinpoint Downtime Causes Quickly
Understanding the Impact of Downtime
Downtime can seriously affect production output, reduce efficiency, and raise costs. The first step to solving this issue is knowing exactly when and why machines stop. OEE software provides detailed visibility, helping teams detect the root causes of downtime with speed and accuracy.
Automatic Data Collection
Unlike manual tracking, OEE software captures data automatically from equipment. It records each stop, its time, and frequency without human error. This makes the information more reliable and easy to analyse, giving a true picture of equipment performance.
Identifying Patterns and Trends
OEE dashboards help spot recurring issues, such as frequent short stops or long changeovers. By highlighting trends over time, teams can uncover hidden problems and make informed decisions to fix them. This leads to better planning and fewer unexpected disruptions.
Quick Root Cause Analysis
Many systems include tools to tag downtime reasons. Whether it’s mechanical failure, material shortage, or operator delay, users can assign specific causes to each stop. This makes it easier to perform root cause analysis and apply long-term solutions instead of just quick fixes.
Improving Response Time
With real-time alerts and live tracking, teams can act the moment a machine goes down. Faster responses reduce the length of downtime and limit its impact. Over time, this improves reliability and boosts overall equipment efficiency.
Tracking Equipment Efficiency Across Multiple Production Lines
Why Cross-Line Efficiency Tracking Matters
When managing several production lines, it’s important to track the efficiency of each one to maintain consistent output and reduce losses. By monitoring performance across all lines, teams can compare productivity, spot issues early, and balance workloads more effectively.
Standardised Metrics for Clear Comparison
Using a consistent set of metrics such as availability, performance, and quality allows managers to fairly compare lines. This helps identify which lines are running well and which may need attention. Standard reporting improves clarity and supports informed decision-making.
Centralised Monitoring and Control
With digital tools, teams can view real-time data from all production lines in one place. This makes it easier to monitor status, track output, and spot downtime instantly. Central dashboards reduce the need for manual checks and support faster responses.
Spotting Line-Specific Trends
Each production line may face different challenges—some might struggle with frequent stops, while others may deal with speed losses. Tracking data over time helps uncover line-specific patterns, making it easier to apply targeted improvements and avoid repeating issues elsewhere.
Boosting Overall Equipment Effectiveness
By monitoring multiple lines together, businesses can raise their total equipment effectiveness. This balanced approach ensures no line is overlooked and encourages continuous improvements throughout the production process, supporting better output and lower waste.
Reducing Waste and Defects with Data-Driven Insights
Understanding the Source of Waste
To reduce waste effectively, it’s important to know exactly where it comes from. By using data collected during production, teams can spot patterns that point to recurring issues. Whether it’s excess material use, faulty equipment, or inefficient processes, clear insights help target the root cause.
Tracking Defects in Real Time
Monitoring production data as it happens allows for quicker reactions to problems. If a defect appears, teams can identify when and where it occurred, then take immediate steps to stop it from affecting more units. This reduces scrap and rework, saving time and resources.
Measuring Quality Consistently
Quality data gives a clear picture of how well equipment and processes are performing. With this information, managers can ensure that standards are met across shifts and batches. Any drop in quality can be flagged early, helping to maintain high output and customer satisfaction.
Making Smart Improvements Over Time
Data doesn’t just help in the moment—it supports long-term improvement. By analysing trends, businesses can spot areas where small changes lead to better results. This supports continuous improvement and helps build more efficient, reliable processes.
Boosting Productivity Through Insight
Reducing waste and defects means fewer delays, less material loss, and stronger performance. Data-driven decisions create a smarter, leaner operation that gets the best out of every production run.
How to Use OEE Dashboards to Drive Daily Improvements
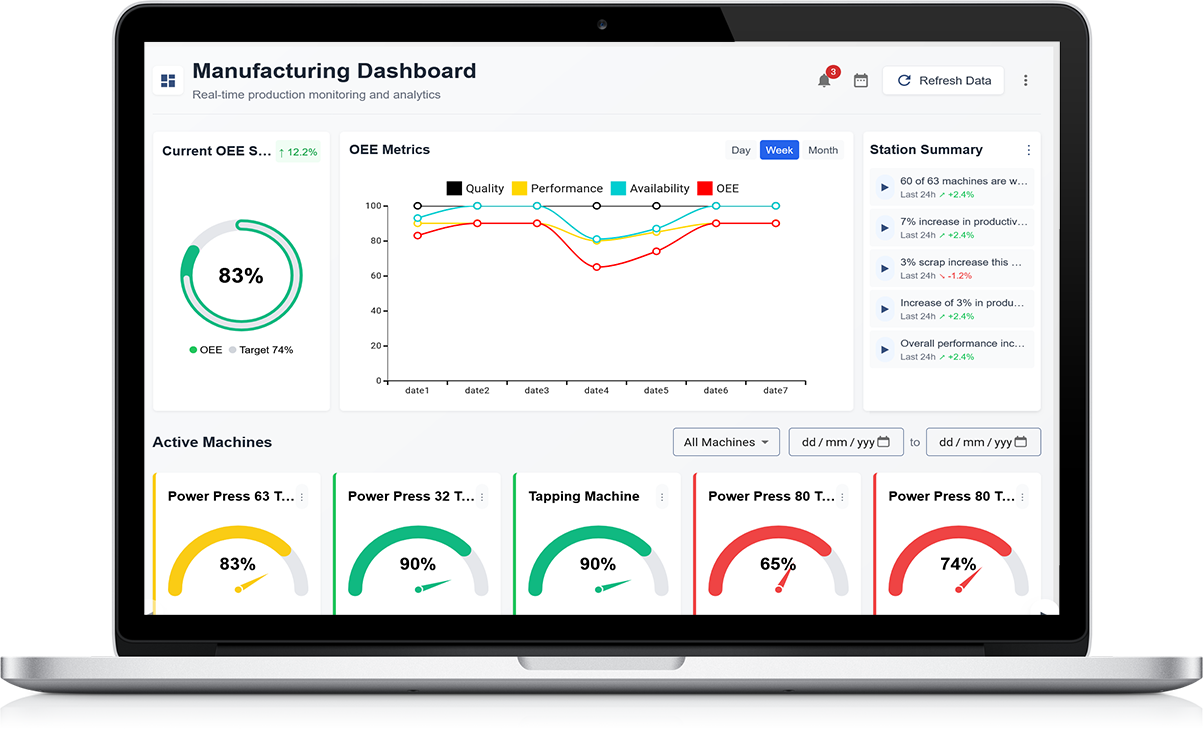
Making Performance Visible
OEE dashboards make equipment performance clear and easy to understand. By displaying real-time data on availability, performance, and quality, teams can see exactly how each machine or process is running. This visibility helps everyone stay focused on goals and respond quickly to issues.
Spotting Problems Early
With daily use, OEE dashboards help identify small problems before they grow. Drops in output, slowdowns, or quality defects become easy to spot when you can compare today's performance with previous days. Quick action helps reduce downtime and prevent waste.
Setting Clear Daily Targets
Dashboards can show daily targets and actual performance side by side. This makes it easier for teams to stay aligned with production goals and push for better results. When targets are met, it builds confidence; when they’re missed, it opens the door to improvement.
Encouraging Team Involvement
When teams use OEE dashboards in their daily meetings or shift handovers, it supports collaboration. Operators, supervisors, and managers can all view the same data and suggest ways to make things better. Everyone takes ownership of performance and results.
Building a Culture of Continuous Improvement
Using OEE dashboards every day supports ongoing progress. Small, regular changes based on data lead to better efficiency, fewer issues, and stronger performance over time. It turns daily monitoring into a key tool for improvement.
Comparing Shifts and Sites: Using OEE for Benchmarking Performance
Why Benchmarking Matters
Benchmarking helps identify what’s working well and where improvements are needed. Using OEE to compare shifts or different sites offers a clear view of overall performance and highlights differences in availability, performance, and quality across operations.
Understanding Shift Variations
OEE data makes it easy to compare how different shifts perform. Some teams may experience more downtime or slower speeds. By reviewing these metrics daily, managers can uncover trends, provide extra support where needed, and share best practices across all shifts.
Site-to-Site Comparison
When multiple sites are involved, comparing OEE results helps standardise processes. Sites that consistently perform well can serve as models for others. Differences in layout, maintenance schedules, or training may explain variations—and addressing these can lift overall efficiency.
Encouraging Healthy Competition
Publishing OEE results for each shift or site can foster a healthy sense of competition. When teams know where they stand, they’re more motivated to improve. Friendly challenges between shifts or locations often lead to shared learning and stronger results.
Driving Continuous Improvement
Regular benchmarking with OEE data helps create a culture focused on progress. By tracking improvements over time and comparing results, organisations can make better decisions and reach higher levels of performance across the board.
Integrating OEE Software with Your Existing Manufacturing Systems
Making Systems Work Together
Integrating OEE software with your current manufacturing systems helps bring all your data together in one place. Whether it’s data from machines, production logs, or shift records, connecting these systems ensures that nothing is missed and gives you a full picture of your operations.
Real-Time Data Flow
When OEE software is integrated with other systems, it can collect and update data in real time. This means performance, downtime, and quality issues are tracked as they happen. This live connection supports faster decision-making and quicker responses on the shop floor.
Saving Time and Reducing Errors
Manual data entry takes time and often leads to mistakes. By linking OEE software with existing systems, data is pulled automatically. This saves time for operators and ensures accuracy in reporting, which improves trust in the results.
Supporting Smarter Planning
With complete and connected data, production managers can plan more effectively. They can spot trends, track progress, and prepare maintenance based on real equipment performance. It also supports clear reporting and better communication between departments.
Future-Ready Setup
Integrating OEE software lays the foundation for future improvements. As your operations grow, a connected system makes it easier to scale and add new tools. It ensures your production environment remains efficient, flexible, and ready for continuous improvement.
How to Set Actionable Production Targets Using OEE Metrics
Understanding OEE as a Starting Point
Overall Equipment Effectiveness (OEE) is a key tool for setting clear and measurable production goals. It combines availability, performance, and quality into one figure, helping you see exactly where improvements are needed. Before setting targets, it’s important to understand your current OEE score and how each part contributes to it.
Break Down the Metrics
To set effective targets, look closely at each OEE component. If availability is low due to frequent stoppages, aim to reduce downtime. If performance is lagging, consider improving cycle times. If quality is below standard, set goals to lower defect rates. Focusing on one area at a time keeps goals achievable.
Set Realistic and Clear Goals
Targets should be challenging yet realistic. For example, increasing overall OEE by 5% over the next quarter is a clear goal. You can also break this into smaller weekly or monthly steps to track progress more easily. Use past performance to guide what’s possible.
Make It a Team Effort
Involve your team when setting targets. When everyone understands the goals and how they affect daily work, they are more likely to stay focused and engaged. Share progress regularly and celebrate small wins to keep momentum going.
Track, Adjust, Improve
Use your OEE data to track progress against the targets. If something isn’t working, adjust your plan. Continuous monitoring and small changes over time lead to bigger improvements and better production results.
Using OEE Trends to Support Preventive and Predictive Maintenance
Why OEE Trends Matter
Tracking Overall Equipment Effectiveness (OEE) over time gives valuable insights into how your machines perform. These trends help identify patterns that could signal wear, recurring faults, or declining performance. By reviewing this data regularly, you can make smarter decisions about when maintenance is truly needed.
Supporting Preventive Maintenance
Preventive maintenance focuses on scheduled checks and servicing to avoid breakdowns. OEE trends can help fine-tune these schedules by showing how performance or availability drops just before issues occur. This means you can service machines at the right time—before failure but without wasting resources on unnecessary checks.
Enabling Predictive Maintenance
Predictive maintenance goes a step further. It uses OEE data to forecast problems before they happen. If quality consistently drops on one machine after a certain number of hours, for example, you can predict when it will next need attention. This allows for timely interventions that reduce unexpected downtime.
Reducing Costs and Downtime
By using OEE trends to guide maintenance, you reduce the risk of sudden breakdowns and costly repairs. Planned downtime is always more efficient than emergency stops. Over time, this approach leads to better productivity and lower maintenance costs.
Better Long-Term Planning
Regularly analysing trends helps build a clear picture of equipment health. This supports smarter long-term planning, including budgeting for upgrades or replacements, based on real data rather than guesswork.
Creating a Culture of Continuous Improvement with OEE Visibility
Building Awareness Through Visibility
When Overall Equipment Effectiveness (OEE) data is clearly displayed and accessible, it creates greater awareness among team members. People begin to understand how their actions affect performance, availability, and quality. This visibility becomes the first step toward lasting improvement across the shop floor.
Encouraging Ownership and Engagement
Teams are more likely to take responsibility for outcomes when they can see real-time performance data. OEE visibility encourages ownership by showing how small changes in daily operations can have a big impact on results. With clear metrics, workers feel more involved and motivated to contribute to improvements.
Identifying Opportunities Together
Visible OEE trends open the door to team-based problem solving. Rather than relying on management alone, all staff can spot issues, raise suggestions, and take part in developing solutions. This promotes collaboration and builds a shared commitment to progress.
Driving Small, Regular Improvements
Continuous improvement doesn’t require dramatic changes. With OEE data always available, teams can focus on making small, regular improvements. These incremental changes add up over time, leading to steady gains in efficiency and quality.
Creating a Long-Term Improvement Mindset
Embedding OEE visibility into daily routines helps shift thinking from reactive to proactive. When improvement becomes part of everyday work, it builds a strong foundation for long-term success and a culture where better is always possible.
Customisable Reporting for Operators, Supervisors, and Managers
Tailored Insights for Every Role
In a production environment, different team members need different information to do their jobs effectively. Customisable reporting ensures that operators, supervisors, and managers each receive the right data in a format that suits their responsibilities. This keeps everyone aligned while supporting quick, informed decisions.
Real-Time Reports for Operators
Operators benefit from real-time updates that show how their machines are performing. Clear dashboards can highlight output levels, stoppages, or quality issues, helping them respond quickly and keep production running smoothly. The right report empowers operators to take ownership of their work.
Performance Overviews for Supervisors
Supervisors need a broader view across teams or lines. Reports that summarise efficiency, downtime, and task completion help supervisors manage resources and spot areas needing attention. With the right insights, they can support operators and adjust priorities as needed.
Strategic Data for Managers
Managers require higher-level insights that support planning, forecasting, and improvement initiatives. Reports focusing on trends, targets, and long-term performance give managers the tools they need to make decisions that drive growth and efficiency across the operation.
Improving Communication and Results
When reports are tailored to each role, communication improves. Everyone understands what’s expected and how their work contributes to wider goals. This leads to better performance, stronger teamwork, and a culture of continuous improvement.
Case Studies: Real Examples of OEE Software Transforming Production Output
Boosting Line Efficiency in a Manufacturing Plant
One production facility introduced OEE software to monitor its bottling line, where downtime and quality losses were frequent. By tracking real-time availability and performance, the team quickly identified frequent micro-stoppages caused by inconsistent feed rates. With this insight, adjustments were made to machine settings, which improved overall efficiency by 15% within three months.
Reducing Downtime in a Packaging Department
A packaging team struggled with unexpected breakdowns and a lack of clear data on machine usage. After adopting OEE software, they gained visibility into exact downtime causes. The system flagged repeated issues with a specific conveyor unit. Targeted maintenance and better scheduling reduced unplanned downtime by 40%, increasing production hours without extra shifts.
Improving Quality Rates on Assembly Lines
An assembly department faced challenges with defective products and quality rework. OEE reporting highlighted a drop in quality during late shifts. This led to additional training for team members and a more consistent inspection process. As a result, the defect rate dropped by 25% in six weeks, with a noticeable rise in customer satisfaction scores.
Conclusion: Data-Driven Success
These case studies show that OEE software offers more than just numbers—it provides actionable insights that help teams make better decisions, reduce waste, and improve output. With accurate tracking and clear reporting, businesses can unlock real gains in productivity.