What Are Visual Management Tools and Why Are They Essential for Improvement?
Visual management tools are essential instruments used by businesses to enhance efficiency, communication, and continuous improvement. These tools leverage visual signals such as charts, graphs, and boards to convey important information in an easily understandable format. By providing real-time insights into key processes, these tools allow teams to monitor performance, identify issues, and make informed decisions quickly.
1. Enhancing Communication
One of the key benefits of visual management tools is that they improve communication within teams. Instead of relying on lengthy reports or emails, visual tools present information in a concise and clear manner. This allows employees to instantly understand the current state of operations, including progress, issues, or areas that require attention, promoting quicker decision-making and smoother collaboration.
2. Enabling Real-Time Monitoring
Visual management tools allow for real-time tracking of key metrics. Whether it's a production dashboard, a task board, or a performance chart, these tools help teams stay on top of ongoing tasks and goals. By continuously monitoring performance, businesses can proactively address potential problems before they escalate, leading to more efficient operations.
3. Supporting Continuous Improvement
Visual management tools are integral to continuous improvement practices like lean and Six Sigma. By visualising data such as cycle times, production rates, or defect counts, teams can spot trends and areas for improvement. This empowers organisations to make data-driven decisions that foster ongoing improvement and help achieve operational excellence.
In summary, visual management tools are vital for enhancing communication, enabling real-time monitoring, and supporting continuous improvement. By making complex data accessible and actionable, they help organisations achieve better results with greater efficiency.
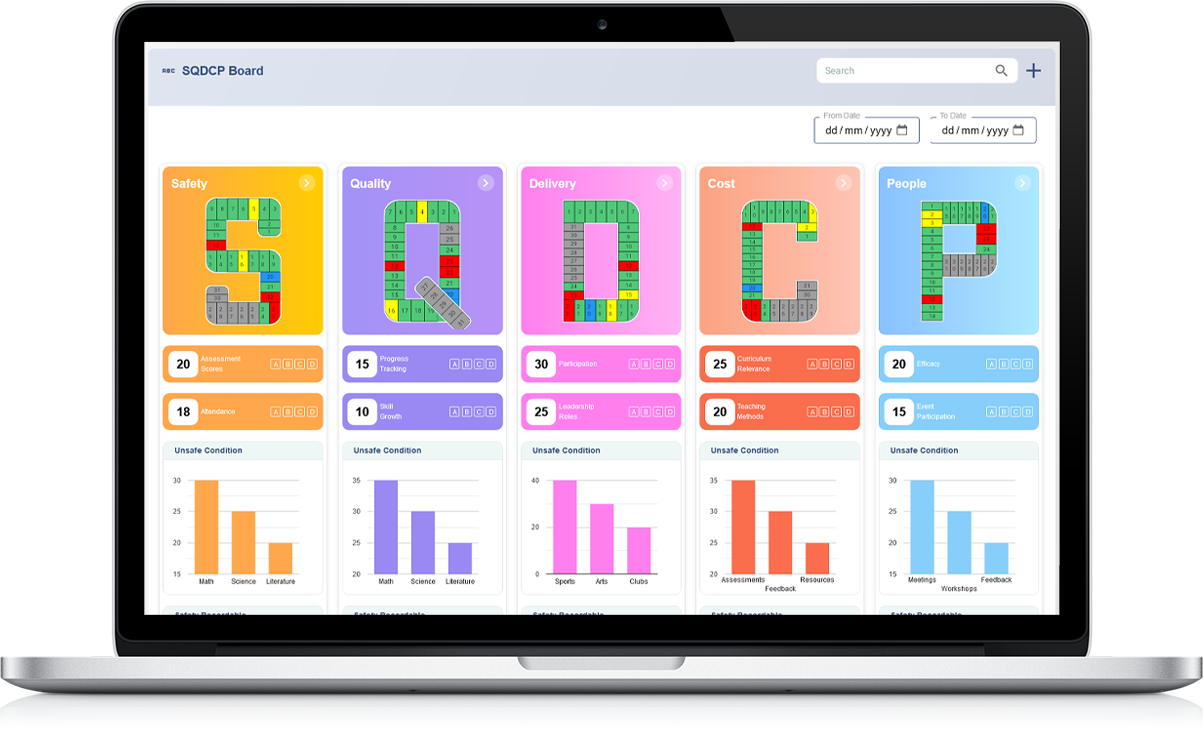
Understanding SQDCP: The Five Pillars of Operational Performance
SQDCP is a powerful framework used by businesses to track and enhance their operational performance. The acronym stands for Safety, Quality, Delivery, Cost, and People, and each pillar represents a key area of focus that contributes to overall operational efficiency and success. Together, these five pillars create a balanced approach to achieving sustainable improvement across all aspects of a business.
1. Safety
Safety is the foundation of SQDCP. A safe working environment not only protects employees but also reduces downtime caused by accidents or injuries. Prioritising safety helps businesses maintain high levels of productivity and minimise the risk of disruptions. It’s essential for fostering a culture of care and responsibility within the organisation.
2. Quality
Quality refers to the standard of products or services delivered to customers. Maintaining high quality is crucial for customer satisfaction and brand reputation. By focusing on quality, businesses can reduce defects, minimise waste, and ensure that products meet the required specifications, leading to improved customer loyalty and long-term success.
3. Delivery
Delivery is about meeting customer expectations for timeliness and consistency. Ensuring on-time delivery is vital for customer retention and building trust. By optimising delivery processes, businesses can improve efficiency, reduce lead times, and enhance overall customer satisfaction.
4. Cost
Cost management is essential for maintaining profitability. By focusing on cost control, businesses can identify areas for savings, optimise resource allocation, and improve financial performance. Effective cost management contributes to competitive pricing and higher margins.
5. People
The final pillar, People, refers to the workforce’s involvement and engagement in the business’s success. Empowering employees through training, clear communication, and recognition helps to boost morale, productivity, and innovation. A motivated and skilled workforce is key to achieving excellence in all other pillars.
In conclusion, SQDCP provides a comprehensive approach to operational performance, with each pillar playing a vital role in driving business success and continuous improvement.
How Visual Tools Drive Team Awareness and Ownership of KPIs
Visual tools are a powerful way to drive team awareness and ownership of Key Performance Indicators (KPIs) within an organisation. By making KPIs easily accessible and visible to all team members, visual management systems encourage greater engagement, accountability, and alignment with business goals. These tools transform complex data into clear, actionable insights, allowing teams to track their performance in real-time.
1. Clear and Immediate Visibility
Visual tools such as dashboards, charts, and scoreboards provide clear, immediate visibility of KPIs. When team members can easily see the progress toward targets, they become more focused on achieving these goals. The visibility of real-time performance helps employees stay aligned with organisational priorities and adjust their actions quickly if necessary.
2. Increased Engagement and Accountability
When teams can track their own performance, they take ownership of the results. Visual tools foster a sense of responsibility as employees can see how their efforts impact the overall success of the organisation. This leads to increased engagement, as team members become more proactive in achieving their KPIs and solving problems when targets are not met.
3. Enhancing Communication and Collaboration
Visual tools also promote better communication and collaboration among team members. By having a shared view of KPIs, team members can discuss challenges, share insights, and offer support to one another. This open communication ensures that everyone is working towards the same objectives, creating a cohesive and motivated team environment.
In summary, visual tools are essential for driving team awareness and ownership of KPIs. They not only provide clarity and visibility but also foster a culture of accountability and collaboration that leads to better performance and continuous improvement.
From Whiteboards to Digital Displays: Modern Visual Management in Action
Visual management has evolved significantly, transitioning from traditional whiteboards and paper charts to advanced digital displays. This shift is revolutionising how businesses track performance, engage teams, and drive operational excellence. Modern visual management tools offer real-time data visualisation, providing a dynamic and efficient way to monitor key metrics and encourage team collaboration.
1. The Power of Digital Displays
Digital displays are transforming the workplace by offering interactive and real-time updates on performance metrics. These displays can be customised to showcase a variety of KPIs, from production rates to customer satisfaction scores. Unlike static whiteboards, digital tools automatically update, reducing the risk of human error and ensuring that teams always have the most accurate information at their fingertips.
2. Benefits Over Traditional Whiteboards
While traditional whiteboards serve their purpose, they often require manual updates and can become cluttered over time. Digital displays, on the other hand, offer cleaner, more organised presentations of data. They can also be integrated with other systems to pull in live data from production lines, databases, and customer feedback, making the information more accessible and actionable for decision-makers.
3. Promoting Real-Time Decision Making
With digital visual management tools, businesses can make decisions faster. Managers can instantly see performance trends, identify issues, and adjust strategies as necessary. This immediate access to critical data empowers teams to act quickly, reducing delays and improving overall efficiency.
In conclusion, the move from whiteboards to digital displays is an important step forward in visual management. By embracing modern technologies, businesses can create more efficient, transparent, and responsive operations that drive continuous improvement.
How Visual Management Sparks Engagement on the Shop Floor
Visual management plays a pivotal role in fostering engagement on the shop floor. By making critical performance data and key metrics easily accessible, visual management tools help teams stay informed and motivated. This transparent approach allows everyone, from line workers to managers, to clearly see how their work contributes to the company’s goals. When employees are aware of their progress and know exactly where to focus their efforts, they become more involved in improving performance.
1. Promoting Transparency
Transparency is one of the biggest benefits of visual management. By displaying real-time data, such as production rates, safety metrics, and quality scores, on visual boards or screens, everyone on the shop floor can immediately see how the team is performing. This openness fosters a sense of ownership and accountability among workers, as they can easily track progress and take action when necessary.
2. Encouraging Team Collaboration
Visual management tools also promote collaboration. When KPIs and progress are visible to all team members, it creates opportunities for open discussions and problem-solving. Employees can easily identify areas that need improvement and work together to find solutions. This collaborative approach builds a sense of unity and helps teams feel more invested in achieving their goals.
3. Driving Continuous Improvement
By using visual management to track performance, teams can quickly spot areas for improvement. Whether it’s reducing downtime, improving quality, or enhancing safety, visual tools keep everyone focused on continuous improvement. When employees can see the impact of their actions on key metrics, they’re more likely to take proactive steps to improve processes and contribute to overall success.
In summary, visual management sparks engagement on the shop floor by promoting transparency, encouraging collaboration, and driving continuous improvement. It empowers employees to take ownership of their work and actively contribute to the success of the team.
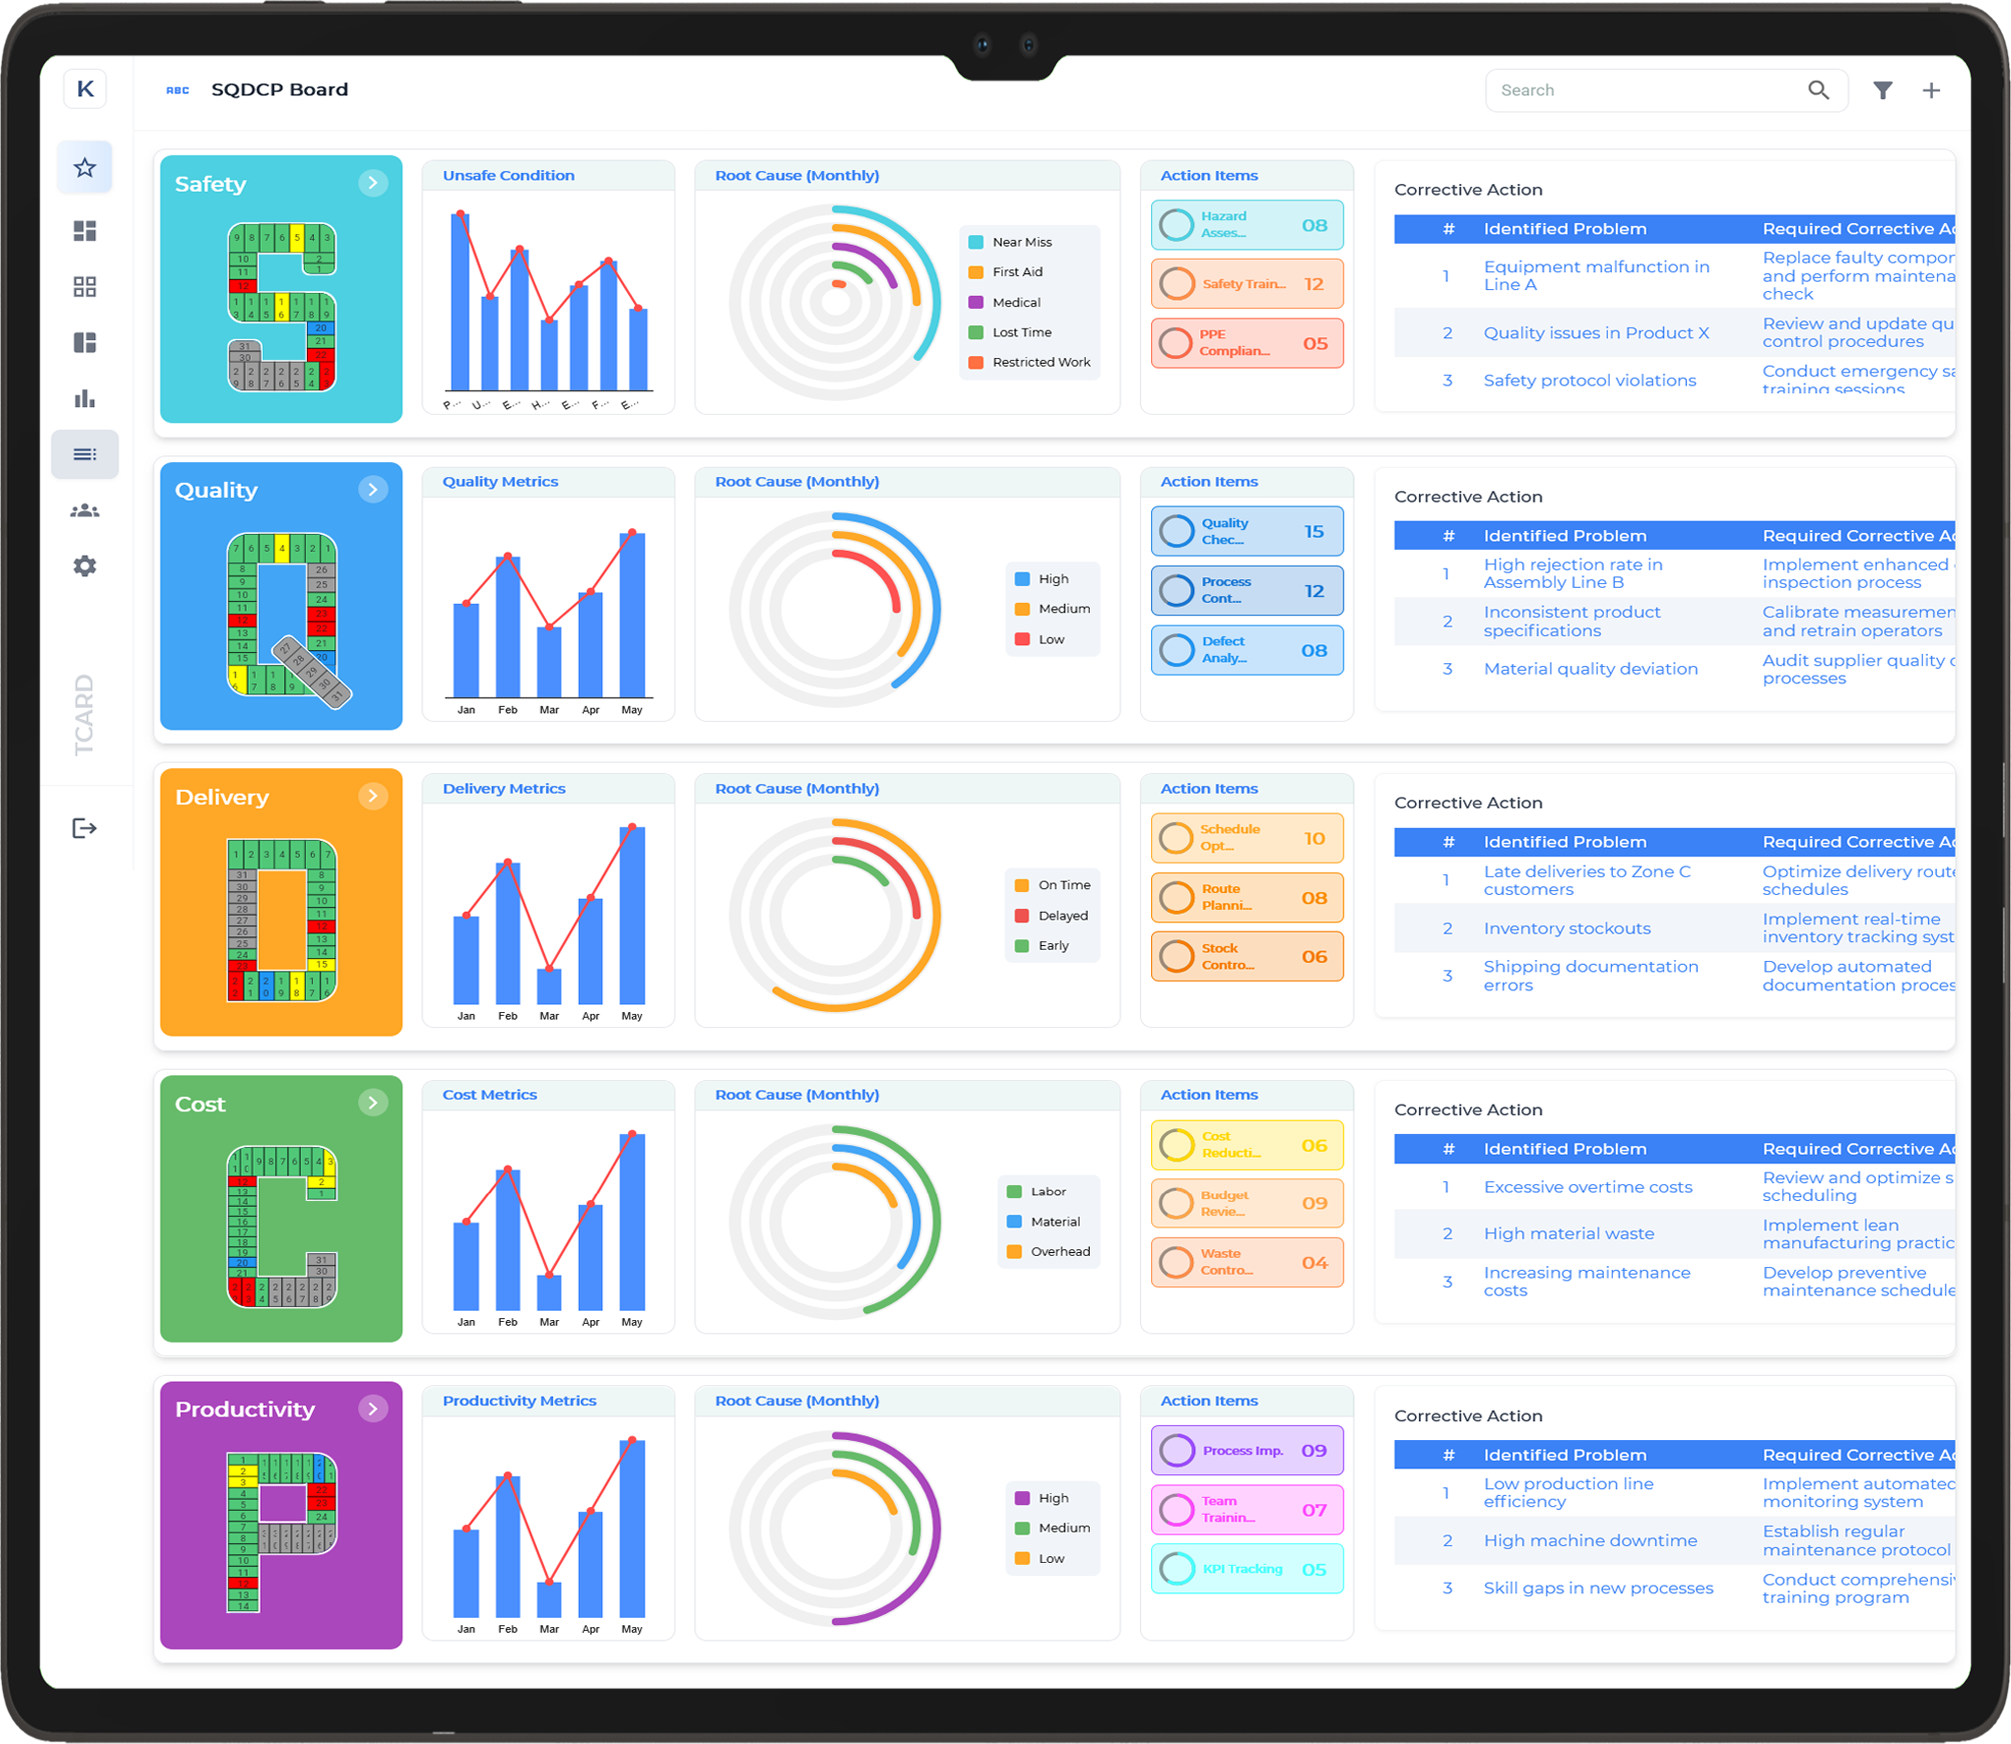
Why SQDCP Boards Are More Than Just Charts on a Wall
SQDCP boards (Safety, Quality, Delivery, Cost, and People) are much more than just charts on a wall. They are powerful tools that drive continuous improvement in businesses by offering a clear, visual representation of key performance indicators (KPIs). These boards are not merely decorative; they play a vital role in aligning teams, tracking progress, and fostering a culture of accountability.
1. Real-Time Performance Monitoring
One of the primary benefits of an SQDCP board is its ability to provide real-time updates on performance. Unlike traditional reports that are often out of date by the time they are reviewed, these boards present the most current data, allowing teams to react quickly to issues and opportunities. Whether it's tracking safety incidents or monitoring quality metrics, SQDCP boards ensure that teams are always aware of their current performance.
2. Visual Engagement
These boards use visual cues like colour coding, graphs, and charts to make complex data easy to understand. Visual management helps all team members, regardless of their role or expertise, grasp key information at a glance. This simplicity encourages everyone to take ownership of their responsibilities and focus on achieving goals.
3. Fostering a Culture of Improvement
SQDCP boards are not static; they evolve as teams improve their processes. By regularly updating and reviewing the board, organisations create an environment of continuous improvement. These boards serve as a daily reminder of the areas that need attention and help highlight successes, motivating teams to keep progressing.
In conclusion, SQDCP boards are essential for fostering accountability, improving communication, and driving performance. They go beyond being simple charts, acting as a vital tool for operational excellence and continuous improvement.
Making Continuous Improvement Visible, Measurable, and Achievable
Continuous improvement is a cornerstone of success in any organisation. However, to truly benefit from it, businesses must make their efforts visible, measurable, and achievable. By using simple yet effective strategies, organisations can track progress, highlight areas for improvement, and ensure that continuous improvement becomes an ingrained part of their culture.
1. Visualising Progress with Clear Indicators
One of the first steps to making continuous improvement visible is by using visual tools like dashboards or performance boards. These tools can display key performance indicators (KPIs), such as production rates, quality standards, and customer satisfaction scores. By showing real-time data in an easily digestible format, businesses can ensure everyone is aligned and aware of progress at any given moment. This transparency fosters accountability and encourages employees to stay focused on their goals.
2. Setting Measurable Targets
Continuous improvement requires clear and measurable targets. By setting specific, quantifiable goals for different aspects of the business—whether in production, customer service, or efficiency—organisations can track progress over time. These measurable targets make it easier to identify areas for improvement and celebrate successes when targets are met, motivating teams to keep pushing forward.
3. Achieving Consistency Through Regular Review
To ensure continuous improvement is not just a one-off effort, regular review meetings are crucial. By assessing the progress made toward improvement goals on a consistent basis, organisations can make adjustments, tackle challenges, and sustain momentum. These reviews also provide opportunities for employees to suggest new ideas or raise concerns, creating a dynamic approach to improvement.
In conclusion, making continuous improvement visible, measurable, and achievable ensures that progress is not just made, but sustained. Through clear indicators, measurable goals, and regular reviews, businesses can build a culture of ongoing success.
The Power of Colour-Coding and Symbols in Visual Communication
Colour-coding and symbols are powerful tools in visual communication, helping organisations convey complex information quickly and clearly. By using distinct colours and recognisable symbols, businesses can improve the understanding of data, streamline decision-making processes, and enhance overall communication within teams.
1. Enhancing Clarity Through Colour
Colour-coding is a simple yet effective method for distinguishing different types of information. For example, using red to indicate urgent tasks or issues, green for completed tasks, and yellow for items that need attention creates an immediate visual hierarchy. This method allows team members to process information at a glance, reducing confusion and enabling quicker responses to key issues. The use of colour also helps to highlight trends, such as performance gains or declines, making them more noticeable and easier to interpret.
2. Using Symbols for Quick Recognition
Symbols play a crucial role in visual communication by offering instant recognition and understanding. Simple shapes like arrows, checkmarks, or exclamation marks can represent a wide range of ideas, from progress to warnings. When paired with colour, symbols enhance the clarity of visual displays, guiding viewers to the right conclusions without requiring lengthy explanations. For example, a green checkmark could signify task completion, while a red triangle might indicate a potential risk or problem.
3. Streamlining Decision-Making
Colour-coding and symbols help streamline decision-making by making essential information easily accessible. Instead of sifting through pages of data or lengthy reports, teams can make quicker, more informed decisions based on visual cues. This approach not only saves time but also reduces the likelihood of mistakes or missed details, ultimately improving efficiency and productivity.
In conclusion, colour-coding and symbols are essential elements of effective visual communication. By using these tools strategically, organisations can enhance clarity, speed up decision-making, and create a more organised and productive work environment.
Tracking Safety, Quality, Delivery, Cost, and People Metrics Made Simple
Tracking key performance metrics is vital for any organisation looking to improve operations and ensure long-term success. Focusing on Safety, Quality, Delivery, Cost, and People (SQDCP) provides a clear, comprehensive view of how a business is performing in critical areas. By effectively tracking these metrics, organisations can make informed decisions that lead to better outcomes, enhanced productivity, and a more engaged workforce.
1. Safety: Prioritising Employee Wellbeing
Safety is the foundation of any successful organisation. Tracking safety metrics, such as accident rates or safety audits, ensures that workplaces remain safe and compliant. A strong safety record not only protects employees but also helps reduce downtime and potential legal issues, which can have a significant financial impact.
2. Quality: Ensuring Product Excellence
Quality metrics are crucial in monitoring product or service standards. By tracking defects, returns, or customer complaints, businesses can identify areas for improvement and take proactive steps to maintain high-quality standards. This leads to greater customer satisfaction and loyalty, directly contributing to business success.
3. Delivery: Meeting Customer Expectations
On-time delivery is a key indicator of operational efficiency. Tracking delivery metrics, such as lead times or shipping accuracy, helps businesses ensure that they meet customer expectations consistently. By identifying delays and bottlenecks in the process, organisations can optimise their supply chain and improve customer satisfaction.
4. Cost: Maintaining Financial Health
Cost metrics are essential for keeping financial performance in check. By tracking production costs, waste, or energy consumption, businesses can identify opportunities to reduce costs and improve profitability. Maintaining control over costs ensures that the company operates efficiently and remains competitive in the market.
5. People: Empowering Employees
People metrics focus on employee performance, engagement, and development. By tracking employee satisfaction, turnover rates, and training progress, businesses can create a more motivated and skilled workforce. Investing in people leads to improved productivity, higher retention, and a positive work culture.
In conclusion, tracking SQDCP metrics simplifies the process of monitoring performance across various aspects of business operations. By consistently measuring and improving these key areas, organisations can ensure continuous growth and success.
Daily Stand-Up Meetings with SQDCP: Keeping Everyone Aligned
Daily stand-up meetings are a vital practice in modern organisations, particularly when using the SQDCP (Safety, Quality, Delivery, Cost, People) framework. These brief, focused meetings keep teams aligned, address issues quickly, and ensure everyone is on the same page regarding priorities and goals. The inclusion of SQDCP metrics in these meetings makes performance tracking more visible and actionable.
1. Reviewing Key Metrics in Real Time
Incorporating SQDCP into daily stand-ups means reviewing key performance indicators (KPIs) every day. Safety metrics, such as accident rates or near misses, ensure that the workplace remains safe. Quality metrics highlight product or service standards, and delivery metrics ensure on-time performance. By reviewing these metrics daily, teams can identify potential issues early, preventing larger problems from arising.
2. Promoting Accountability and Engagement
Daily stand-ups that focus on SQDCP also promote accountability. Each team member shares their progress on their tasks, allowing the group to see how individual actions align with broader organisational goals. This openness fosters engagement, encourages team collaboration, and ensures that everyone is aware of their roles in achieving safety, quality, and delivery targets.
3. Quick Problem-Solving
Stand-up meetings with SQDCP metrics allow for immediate problem-solving. If a team member flags a delivery issue or quality concern, it can be addressed on the spot. This quick resolution prevents delays, ensuring that safety, quality, and costs remain on track. The focus on cost also ensures that any cost-related challenges are raised early, helping the team stay within budget.
In conclusion, daily stand-up meetings with SQDCP provide a simple but effective method to keep teams aligned, engaged, and focused on continuous improvement. These regular check-ins support smoother operations, better decision-making, and a more collaborative work environment.
Visual Tools: A Powerful Ally in Lean and Kaizen Initiatives
In the world of Lean and Kaizen initiatives, visual tools play an essential role in enhancing communication, improving workflow, and driving continuous improvement. These tools help to simplify complex processes, make performance data accessible, and foster collaboration across teams. By using visual management systems, organisations can optimise efficiency and create a culture of ongoing improvement.
1. Clear Communication Through Visual Displays
One of the core principles of Lean and Kaizen is eliminating waste and improving flow. Visual tools, such as performance boards, dashboards, and visual metrics, provide an easy way for teams to track and understand key information at a glance. These tools reduce the need for lengthy reports or meetings and ensure that critical data—such as safety, quality, and delivery performance—are visible to all team members in real-time.
2. Identifying Issues and Root Causes Quickly
Visual tools are invaluable in identifying problems early. For example, in a Lean environment, a visual control board can show which processes are experiencing bottlenecks or delays. This visibility allows teams to address issues promptly and investigate the root causes, which is a key aspect of the Kaizen methodology. By continuously monitoring performance with visual tools, organisations can make small, incremental improvements that lead to significant gains over time.
3. Fostering Collaboration and Engagement
Visual tools make collaboration easier by presenting data in a way that everyone can understand. Whether through colour-coded charts or easy-to-read graphs, visual tools help teams stay engaged and focused on common goals. These tools also facilitate open discussions during team meetings, enabling collective problem-solving and promoting a sense of ownership and accountability among employees.
In conclusion, visual tools are a cornerstone of Lean and Kaizen practices. By providing clear, real-time data, identifying issues quickly, and fostering collaboration, these tools help organisations streamline operations and continuously improve performance.
Real-Time Problem-Solving with Clear Visual Cues
In fast-paced environments, the ability to identify and solve problems in real-time is crucial to maintaining efficiency and productivity. Clear visual cues are an invaluable tool for immediate problem-solving, enabling teams to quickly identify issues, track progress, and take necessary actions. By incorporating visual management systems, organisations can streamline their workflows and ensure faster resolution of challenges.
1. Instant Identification of Issues
Visual cues, such as colour-coded signals, charts, or boards, provide immediate feedback on the status of tasks and processes. For example, a red indicator can signal a problem, while green shows that everything is on track. This allows teams to quickly identify bottlenecks or deviations from the expected outcomes, eliminating the need for time-consuming discussions or manual checks.
2. Empowering Teams for Quick Action
By using visual cues to highlight issues, team members are empowered to take immediate action. Visual management systems ensure that everyone is on the same page, making it easier to address problems without delay. Whether it's adjusting priorities, reallocating resources, or implementing corrective actions, clear visual cues enable teams to respond quickly and effectively to challenges as they arise.
3. Enhancing Collaboration and Communication
Visual cues facilitate better communication across teams, ensuring that everyone is aware of the current state of operations. In a collaborative environment, visual tools like performance boards or dashboards provide a common reference point, making it easier for team members to coordinate efforts and solve problems together. This transparent communication fosters a culture of teamwork and continuous improvement.
In conclusion, real-time problem-solving is made much more efficient with clear visual cues. These tools help teams quickly identify issues, take swift action, and collaborate more effectively, ultimately improving overall productivity and performance.
Digital SQDCP Boards vs Manual Ones: What Works Best for You?
When it comes to tracking key metrics like Safety, Quality, Delivery, Cost, and People (SQDCP), businesses have two primary options: digital or manual boards. Each approach has its benefits and limitations, and choosing the right one depends on the needs and structure of your organisation. Understanding the differences can help determine which method will work best for you.
1. Digital SQDCP Boards: Real-Time Insights and Automation
Digital SQDCP boards offer significant advantages when it comes to speed, accessibility, and accuracy. With real-time data updates, these boards provide immediate visibility into performance across all areas of your operations. They can be accessed from anywhere, allowing remote teams to stay aligned and up-to-date. Additionally, many digital solutions come with built-in automation, which reduces the risk of errors and ensures consistency in data collection. By integrating with other systems, digital boards can streamline processes and provide valuable insights for continuous improvement.
2. Manual SQDCP Boards: Simplicity and Hands-On Control
On the other hand, manual SQDCP boards offer a more tactile and straightforward approach. These boards are often used in smaller operations or where digital tools may not be as easily accessible. Manual boards are also cost-effective, as they don’t require software or devices. While they lack the real-time capabilities of digital boards, they can still effectively track key metrics. Manual boards also provide a more hands-on method of engagement, making them ideal for teams that prefer physical interaction with their performance data.
3. Choosing the Best Option
Ultimately, the choice between digital and manual SQDCP boards depends on your organisational needs. If you have a larger team, complex data, or need real-time updates, a digital board may be more suitable. However, if simplicity and direct control are priorities, a manual board could work just as well. Assessing the scale of your operations, the resources available, and your desired level of automation will help you make the right decision for your business.
Case Study: How Visual Management Transformed a UK Factory Floor
A leading UK manufacturing company faced ongoing challenges with inefficiency and poor communication on the factory floor. To address these issues, the company introduced visual management tools, transforming operations and boosting productivity. Here's how visual management made a significant impact on their processes.
1. Introducing Clear Visual Cues
The first step in the transformation was the installation of visual boards that displayed key performance metrics, including safety, quality, delivery, and production targets. Colour-coded charts and real-time data updates allowed teams to immediately identify areas requiring attention. This transparency not only kept everyone informed but also created a sense of accountability among workers and management alike.
2. Improving Communication Across Teams
Before visual management, communication between shifts and departments was often unclear. The introduction of visual boards, displaying critical performance metrics and shift updates, bridged the communication gap. Teams were able to quickly assess progress, share relevant information, and align efforts. This led to more efficient coordination and fewer delays in production.
3. Achieving Continuous Improvement
As a result of the visual management system, the company saw significant improvements in production efficiency. The ability to monitor performance in real time meant that issues were flagged and addressed faster, preventing downtime. Furthermore, teams became more engaged, contributing to a culture of continuous improvement as they could clearly see the direct impact of their actions on performance metrics.
The implementation of visual management on the factory floor not only improved communication and efficiency but also fostered a more proactive, engaged workforce. This case study highlights the power of visual tools in driving operational success and continuous improvement.
Step-by-Step: How to Set Up an SQDCP Visual Board in Your Workplace
Setting up an SQDCP (Safety, Quality, Delivery, Cost, and People) visual board in your workplace is an effective way to improve performance, foster collaboration, and monitor key metrics in real time. Here’s a simple, step-by-step guide to help you set up a functional and efficient SQDCP board for your team.
1. Define Your Key Metrics
The first step in setting up an SQDCP visual board is to determine the key metrics you want to track. These should be aligned with your business objectives. For example, Safety might include incident reports, Quality could track product defects, Delivery might focus on lead times, Cost could monitor expenses, and People could measure employee engagement or performance.
2. Choose Your Board Format
Decide whether you want a physical board or a digital board. A physical board works well for smaller teams or workplaces, while a digital board offers flexibility and real-time updates, especially for larger teams or remote workers. Ensure the board is easily accessible to everyone involved in the process.
3. Use Colour-Coding and Clear Labels
Colour-coding is essential for easy identification of issues. For instance, green could indicate that everything is on track, yellow for caution, and red for urgent issues. Label each section clearly to represent the SQDCP categories, and make sure the board is updated regularly to reflect the most accurate information.
4. Update Regularly and Review Progress
Once your SQDCP visual board is set up, ensure that it is updated consistently. Make it a part of daily or weekly meetings where team members can review the board, discuss challenges, and identify areas for improvement. This promotes transparency and keeps everyone on track.
Setting up an SQDCP visual board is a simple yet powerful tool to enhance communication, monitor performance, and drive continuous improvement in your workplace.