What is an SQDCP Report?
Overview of SQDCP Report
An SQDCP report is a structured document used to track key performance indicators in a workplace. It focuses on five critical areas: Safety, Quality, Delivery, Cost, and People. This report helps teams monitor progress, identify issues, and implement improvements.
Purpose of an SQDCP Report
The primary goal of an SQDCP report is to provide a clear and real-time view of operational performance. It allows management and employees to assess efficiency, maintain quality, and enhance productivity while ensuring a safe working environment.
Benefits of Using an SQDCP Report
Regular use of SQDCP reports promotes transparency, accountability, and continuous improvement. By tracking trends and addressing concerns early, businesses can improve workflows, reduce costs, and maintain high standards in daily operations.
How Does the Balanced Scorecard Integrate with SQDCP Reporting?
Understanding the Balanced Scorecard and SQDCP
The Balanced Scorecard is a strategic management tool that tracks key performance areas, including financial, customer, internal processes, and learning and growth. SQDCP reporting, on the other hand, focuses on Safety, Quality, Delivery, Cost, and People, ensuring operational efficiency. Integrating these two methods creates a comprehensive performance monitoring system.
Aligning Strategic and Operational Goals
By combining the Balanced Scorecard with SQDCP reporting, businesses can align long-term strategic objectives with daily operational metrics. The Balanced Scorecard provides a high-level view, while SQDCP ensures continuous monitoring of essential performance areas. This integration enhances decision-making and drives sustainable improvements.
Enhancing Performance Tracking
Both systems use measurable data to evaluate performance. The Balanced Scorecard identifies key business objectives, while SQDCP reporting tracks real-time progress in critical operational areas. Together, they offer a structured approach to identifying strengths, weaknesses, and improvement opportunities.
Supporting Continuous Improvement
The integration of these tools fosters a culture of continuous improvement. SQDCP data provides insights into operational issues, while the Balanced Scorecard helps adjust strategic goals accordingly. This approach enables organisations to enhance efficiency, reduce waste, and maintain high standards.
Driving Business Success
Using both the Balanced Scorecard and SQDCP reporting ensures a balanced approach to performance management. Organisations can track long-term progress while maintaining real-time control over daily operations, leading to sustained growth and improved efficiency.
What Are the Key Components of an SQDCP Report?
Introduction to SQDCP Reporting
An SQDCP report is a structured way to track key performance areas in operations. It focuses on five critical elements: Safety, Quality, Delivery, Cost, and People. This report helps organisations monitor efficiency, identify issues, and drive continuous improvement.
Safety (S)
Safety measures track workplace incidents, hazards, and compliance with safety regulations. It includes accident reports, near-miss incidents, and corrective actions taken to ensure a secure work environment.
Quality (Q)
Quality metrics measure product or service standards, defect rates, and customer complaints. This section ensures that quality control processes are followed to maintain high performance and customer satisfaction.
Delivery (D)
Delivery performance focuses on meeting deadlines, order fulfilment rates, and on-time deliveries. This component helps businesses optimise supply chains and improve operational efficiency.
Cost (C)
Cost tracking involves monitoring expenses, waste reduction, and budget adherence. By controlling costs, organisations can improve profitability while maintaining operational efficiency.
People (P)
People metrics focus on workforce performance, engagement, and training. It includes absenteeism, skill development, and employee satisfaction to ensure a motivated and productive team.
How Can a Balanced Scorecard Improve SQDCP Reporting?
Enhancing Performance Tracking
A Balanced Scorecard provides a structured framework for measuring key business areas. When combined with SQDCP reporting, it ensures that Safety, Quality, Delivery, Cost, and People metrics align with overall organisational goals. This helps in tracking performance effectively and identifying areas for improvement.
Aligning Metrics with Strategic Goals
The Balanced Scorecard ensures that SQDCP data is not just operational but also strategic. By linking SQDCP indicators to broader business objectives, companies can focus on long-term improvements rather than just daily performance.
Providing a Holistic View
While SQDCP reporting focuses on specific operational areas, a Balanced Scorecard offers a comprehensive perspective. It integrates financial, customer, process, and employee development metrics, providing deeper insights into business performance.
Improving Decision-Making
With a Balanced Scorecard, SQDCP reporting becomes more actionable. Managers can use the combined data to make informed decisions, set realistic targets, and implement corrective actions efficiently.
Driving Continuous Improvement
The combination of SQDCP and a Balanced Scorecard fosters a culture of continuous improvement. By regularly reviewing performance metrics, organisations can optimise processes, reduce inefficiencies, and enhance productivity.
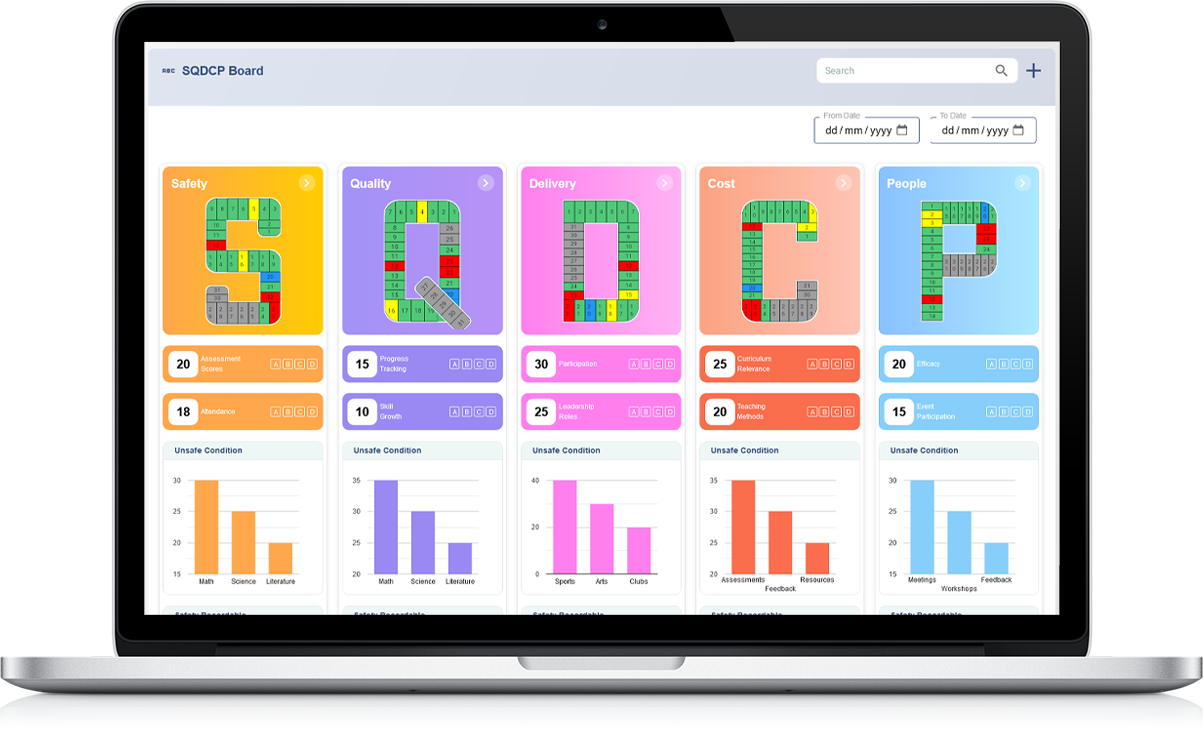
How Do You Use an SQCDP Board?
Understanding the SQCDP Board
An SQCDP board is a visual management tool used to monitor key performance indicators related to Safety, Quality, Cost, Delivery, and People. It provides a structured way to track progress, identify issues, and drive continuous improvement in workplaces.
Setting Up the Board
To use an SQCDP board effectively, it should be placed in a visible location where teams can easily access and update it. The board is typically divided into five sections representing SQCDP categories, with space to record daily, weekly, or monthly performance data.
Updating Performance Metrics
Each category on the board should be updated regularly with real-time data. For example:
- Safety: Record incidents, hazards, or near-misses.
- Quality: Track defects, errors, or rework rates.
- Cost: Monitor expenses, waste, or budget deviations.
- Delivery: Measure on-time performance and efficiency.
- People: Track attendance, engagement, and training.
Analysing Trends and Taking Action
Teams should review the board daily to identify trends and issues. Using colour coding (such as green for good performance and red for concerns) makes it easier to spot problem areas. Discussions during team meetings should focus on problem-solving and action plans.
Driving Continuous Improvement
By regularly using an SQCDP board, teams can proactively address challenges, improve efficiency, and enhance overall performance, making it an essential tool for workplace management.
What Data Sources Are Used for SQDCP Reports?
Understanding SQDCP Reports
SQDCP reports track key performance areas, including Safety, Quality, Delivery, Cost, and People. These reports rely on accurate data from multiple sources to help businesses monitor performance, identify trends, and drive continuous improvement.
Primary Data Sources
Several data sources contribute to SQDCP reports, ensuring they provide a clear and reliable picture of operational performance.
1. Safety Data
Safety data comes from incident reports, near-miss records, workplace inspections, and compliance audits. This information helps identify risks and ensure a safer working environment.
2. Quality Data
Quality metrics are sourced from defect tracking systems, customer complaints, product inspections, and process audits. These records help monitor product and service quality.
3. Delivery Performance
Delivery performance data is gathered from production schedules, order tracking systems, and customer feedback. This ensures on-time delivery and efficiency in operations.
4. Cost Tracking
Cost-related data is obtained from financial reports, expense tracking, waste reduction records, and budget variance reports. This helps in controlling operational costs.
5. Workforce Metrics
People-related data includes employee attendance, productivity reports, training records, and engagement surveys. This ensures workforce efficiency and well-being.
Ensuring Accurate and Timely Data
Using real-time data collection tools and regular updates improves the accuracy and effectiveness of SQDCP reports, helping businesses make informed decisions and drive continuous improvements.
How Do You Set KPIs for an SQDCP Report?
Understanding KPIs in SQDCP Reporting
Key Performance Indicators (KPIs) in an SQDCP report help measure performance in five critical areas: Safety, Quality, Delivery, Cost, and People. Setting the right KPIs ensures effective monitoring and continuous improvement.
1. Safety KPIs
Safety KPIs focus on workplace conditions and employee well-being. Common metrics include incident rates, near-miss reports, safety training completion, and compliance with safety protocols.
2. Quality KPIs
Quality KPIs measure product and process efficiency. These include defect rates, customer complaints, rework percentages, and first-pass yield to ensure high-quality output.
3. Delivery KPIs
Delivery performance is critical for meeting customer expectations. Key metrics include on-time delivery rates, order fulfillment accuracy, lead times, and production cycle efficiency.
4. Cost KPIs
Cost KPIs track financial efficiency and waste reduction. Common indicators include cost per unit, waste reduction percentages, budget variance, and operational expenses.
5. People KPIs
People KPIs assess workforce engagement and productivity. Metrics include employee attendance, training completion rates, retention rates, and productivity levels.
Aligning KPIs with Business Goals
Effective SQDCP KPIs align with overall business objectives, ensuring measurable improvements. Regular review and data-driven adjustments help maintain operational excellence and continuous improvement.
What Tools Can Be Used to Create SQDCP Reports with a Balanced Scorecard?
Understanding SQDCP Reporting and the Balanced Scorecard
The SQDCP report tracks key performance areas: Safety, Quality, Delivery, Cost, and People. Integrating it with a Balanced Scorecard provides a structured approach to measuring performance, aligning daily operations with strategic goals.
1. Spreadsheet Software
Spreadsheet tools are commonly used for SQDCP reporting. They allow easy data entry, visual representation with charts, and formula-based calculations to track trends and performance metrics.
2. Business Intelligence Platforms
Business intelligence tools help automate data collection and generate real-time insights. These platforms support dashboards that display SQDCP metrics alongside Balanced Scorecard objectives for quick analysis.
3. Customised Reporting Software
Some organisations use tailored software to align SQDCP reports with strategic goals. These tools provide advanced reporting capabilities, automated alerts, and trend analysis for better decision-making.
4. Performance Management Systems
These systems track key performance indicators (KPIs) and ensure SQDCP reporting aligns with the Balanced Scorecard. They help in monitoring goals, improving processes, and ensuring continuous progress.
Ensuring Effective Reporting
Choosing the right tool depends on business needs, data complexity, and reporting frequency. Combining SQDCP with a Balanced Scorecard enhances decision-making and drives operational excellence.
How Frequently Should SQDCP Reports Be Updated?
Importance of Regular SQDCP Reporting
Updating SQDCP reports at the right frequency ensures accurate tracking of Safety, Quality, Delivery, Cost, and People metrics. Regular updates help teams monitor progress, identify issues early, and maintain operational efficiency.
1. Daily Updates for Real-Time Monitoring
Daily updates are ideal for dynamic work environments where quick decision-making is needed. Tracking key metrics every day helps identify trends, address safety concerns, and ensure smooth workflow operations.
2. Weekly Reports for Performance Reviews
Updating SQDCP reports weekly allows managers to review short-term trends and assess improvements. Weekly reviews help teams reflect on performance, adjust strategies, and plan corrective actions before issues escalate.
3. Monthly Reports for Strategic Planning
Monthly updates provide a broader view of performance trends. These reports help in setting goals, measuring overall progress, and making informed business decisions. They also support continuous improvement initiatives.
4. Quarterly and Annual Reviews
For long-term analysis, quarterly and annual updates help in assessing major improvements, setting new targets, and aligning SQDCP metrics with business goals. These reports assist leadership in strategic planning.
Choosing the Right Update Frequency
The ideal update frequency depends on business needs and operational demands. A combination of daily, weekly, and monthly updates ensures accurate tracking and continuous process improvement.
What Visualisation Methods Are Best for SQDCP Reporting?
Importance of Visualising SQDCP Reports
Effective visualisation of SQDCP reports makes it easier to track Safety, Quality, Delivery, Cost, and People metrics. Clear visuals help teams identify trends, detect issues, and make data-driven decisions quickly.
1. Colour-Coded Dashboards
Using colour-coded dashboards improves clarity and helps teams focus on critical areas. Green indicates positive performance, yellow signals caution, and red highlights urgent issues that require immediate attention.
2. Bar Charts for Trend Analysis
Bar charts are useful for comparing SQDCP metrics over time. They provide a clear visual representation of progress, making it easier to see performance improvements or declines.
3. Line Graphs for Continuous Monitoring
Line graphs help in tracking changes in key metrics over time. They are useful for identifying patterns, fluctuations, and long-term performance trends.
4. Heat Maps for Identifying Problem Areas
Heat maps visually highlight high-risk areas within the SQDCP framework. This method helps in quickly spotting performance gaps and prioritising corrective actions.
5. Pie Charts for Proportional Data
Pie charts effectively display the distribution of different SQDCP components, such as cost allocation or resource utilisation, allowing teams to make balanced decisions.
Choosing the Right Visualisation
Selecting the best visualisation method depends on the data being presented. A combination of charts, dashboards, and graphs ensures a clear, data-driven approach to SQDCP reporting.
How Do You Ensure Data Accuracy in SQDCP Reports?
Importance of Accurate SQDCP Reporting
Accurate SQDCP reports are essential for effective decision-making. Reliable data helps teams track Safety, Quality, Delivery, Cost, and People performance, ensuring continuous improvement.
1. Standardised Data Collection Methods
Using a consistent approach for data collection ensures uniformity. Clearly defined procedures and templates prevent errors and maintain accuracy across all reports.
2. Regular Data Audits
Conducting periodic audits helps identify discrepancies. Cross-checking information against original sources ensures that reports reflect the correct data.
3. Automated Data Entry Systems
Manual data entry increases the risk of human errors. Implementing automated tools reduces mistakes and enhances efficiency in reporting.
4. Clear Performance Metrics
Establishing clear measurement criteria ensures that all data aligns with predefined performance indicators. This avoids misinterpretation and inconsistencies in reporting.
5. Data Validation Processes
Using validation checks before finalising reports helps detect anomalies. Comparing results with previous reports and expected benchmarks improves reliability.
6. Training and Accountability
Providing proper training to employees involved in data collection enhances accuracy. Assigning accountability ensures that responsible individuals verify and maintain data integrity.
What Are the Common Challenges in SQDCP Reporting?
1. Inconsistent Data Collection
One of the biggest challenges in SQDCP reporting is inconsistency in data collection. Without standardised procedures, different teams may record data in varied formats, leading to discrepancies and unreliable reports.
2. Lack of Real-Time Updates
Delayed data entry can impact decision-making. If SQDCP reports are not updated in real time, teams may work with outdated information, affecting productivity and efficiency.
3. Human Errors in Data Entry
Manual data input increases the risk of mistakes, such as incorrect values or missing details. Errors in reporting can lead to incorrect analysis and poor decision-making.
4. Limited Data Visualisation
Presenting SQDCP data in complex tables or text-heavy formats makes it difficult to interpret. Without effective visual tools, teams may struggle to identify trends and take proactive action.
5. Lack of Employee Engagement
For SQDCP reporting to be effective, employees need to be actively involved. If teams do not understand the importance of the reports, they may not provide accurate or timely data.
6. Difficulty in Measuring Performance
Without clear performance indicators, evaluating progress becomes challenging. Undefined goals and unclear benchmarks can reduce the effectiveness of SQDCP reporting.
How Can SQDCP Reports Drive Continuous Improvement?
1. Identifying Performance Gaps
SQDCP reports help organisations track key performance areas, highlighting inefficiencies in safety, quality, delivery, cost, and productivity. By identifying recurring issues, teams can focus on areas that need immediate attention.
2. Data-Driven Decision Making
Regular SQDCP reporting provides accurate data that helps leaders make informed decisions. Instead of relying on assumptions, teams can use real-time insights to implement targeted improvements.
3. Enhancing Process Standardisation
Tracking SQDCP metrics ensures consistency in operations. By monitoring results over time, organisations can refine processes, reduce variability, and maintain high standards across all functions.
4. Encouraging Employee Engagement
When employees actively participate in SQDCP reporting, they become more involved in problem-solving. Engaging teams in discussions about data trends encourages a culture of accountability and continuous learning.
5. Supporting Proactive Problem-Solving
Rather than reacting to issues after they occur, SQDCP reports help teams predict potential challenges. Early detection of risks allows organisations to implement preventive measures, improving overall efficiency.
6. Measuring the Impact of Improvements
Continuous improvement relies on tracking progress over time. SQDCP reports provide measurable data to assess whether changes are effective and if further adjustments are needed.
Can SQDCP Reports Be Used for Team Performance Reviews?
1. Tracking Key Performance Metrics
SQDCP reports provide a structured way to monitor key performance areas, including safety, quality, delivery, cost, and productivity. These metrics help assess how well a team is meeting its goals and where improvements are needed.
2. Providing Objective Performance Data
Using SQDCP reports for team reviews ensures that evaluations are based on data rather than personal opinions. Clear, measurable performance indicators make the review process fair and transparent.
3. Identifying Strengths and Weaknesses
By analysing trends in SQDCP reports, managers can identify areas where teams excel and areas that require additional support or training. This helps in recognising achievements and addressing challenges effectively.
4. Encouraging Continuous Improvement
Regular performance reviews based on SQDCP data encourage teams to focus on ongoing improvement. Setting targets based on past performance helps drive efficiency and operational excellence.
5. Enhancing Accountability and Engagement
Teams that regularly review SQDCP data gain a better understanding of their impact on overall business goals. This fosters a sense of responsibility and motivates employees to take ownership of their work.
6. Supporting Goal Setting and Training
SQDCP reports can be used to set realistic team goals and identify training needs. If a particular area shows consistent underperformance, additional resources or coaching can be provided to improve results.
How Can Automation Improve SQDCP Reporting?
1. Enhancing Data Accuracy
Automation eliminates manual errors in SQDCP reporting by collecting real-time data directly from operational systems. This ensures accurate and consistent reporting, reducing the risk of miscalculations or missing information.
2. Saving Time and Increasing Efficiency
Manually compiling SQDCP reports can be time-consuming. Automation speeds up data collection, processing, and report generation, allowing teams to focus on analysis and decision-making instead of administrative tasks.
3. Real-Time Monitoring and Alerts
Automated SQDCP reporting enables real-time tracking of key performance indicators. Instant alerts notify teams of deviations, allowing quick action to address safety, quality, delivery, cost, or productivity issues.
4. Standardising Reporting Processes
Using automation ensures that SQDCP reports follow a consistent format across all teams and departments. This improves clarity, making it easier to compare performance and identify trends over time.
5. Improving Data Visualisation
Automated systems can generate dynamic charts and graphs, making it easier to analyse trends and performance patterns. Visual reports help teams and management quickly understand key insights.
6. Supporting Continuous Improvement
With real-time insights and accurate data, teams can identify problem areas faster and implement corrective actions promptly. Automation helps in tracking progress and making data-driven decisions for ongoing improvements.
What Industries Benefit from SQDCP Reports with the Balanced Scorecard?
1. Manufacturing
Manufacturers use SQDCP reports with the Balanced Scorecard to monitor safety, quality, delivery, cost, and productivity. These reports help in reducing defects, improving efficiency, and ensuring on-time production.
2. Healthcare
Hospitals and healthcare facilities benefit from SQDCP reporting by tracking patient safety, treatment quality, and operational costs. It ensures better resource allocation and improves patient care outcomes.
3. Logistics and Supply Chain
Transport and logistics industries use these reports to enhance delivery performance, control costs, and streamline operations. It helps in identifying delays, improving shipment accuracy, and reducing expenses.
4. Retail and E-Commerce
Retail businesses track customer satisfaction, order fulfilment rates, and operational costs through SQDCP reporting. It helps improve stock management, reduce waste, and optimise store or warehouse performance.
5. Construction
The construction industry benefits from monitoring safety compliance, project timelines, material costs, and workforce productivity. SQDCP reporting ensures projects are completed efficiently while maintaining quality standards.
6. Automotive
Automotive companies use these reports to improve production quality, reduce defects, and enhance safety measures. It helps in minimising waste and increasing production efficiency.