What Is OEE and Why Is It Crucial for Equipment Monitoring?
Understanding OEE in Simple Terms
OEE stands for Overall Equipment Effectiveness. It is a key performance measure used in manufacturing and production to assess how well equipment is being used. OEE helps identify losses in productivity by breaking down performance into three main areas: availability, performance, and quality. When tracked correctly, it gives a clear picture of how efficiently a machine or system is operating.
The Three Core Components of OEE
Availability: This refers to the amount of time equipment is ready and running compared to planned production time. Breakdowns or long changeovers reduce availability.
Performance: This measures whether the equipment is running at its optimal speed. Any slowdowns or minor stops lower this score.
Quality: This indicates the proportion of good products produced without defects. Rework or scrap lowers the quality score.
Why OEE Matters for Equipment Monitoring
OEE is crucial because it highlights where production losses are happening. Rather than guessing or relying on general observations, teams can use OEE data to pinpoint issues in real-time. This allows faster responses, better planning, and more consistent output.
Driving Improvement Through OEE
By monitoring OEE regularly, organisations can make informed decisions to boost equipment reliability and performance. Over time, this leads to higher efficiency, reduced waste, and better use of resources — all essential for staying competitive in modern operations.
The Role of OEE Software in Measuring Availability, Performance, and Quality
Why Use OEE Software?
OEE software plays a vital role in helping businesses monitor and improve equipment performance. It automates the tracking of key production data, making it easier to calculate Overall Equipment Effectiveness (OEE) in real time. Instead of relying on manual logs and estimates, teams can access accurate and up-to-date insights that drive better decisions.
Measuring Availability with Precision
Availability is about how often equipment is ready and running when needed. OEE software records downtime events, whether planned or unplanned, and calculates the actual operating time. This gives teams a clear view of any issues reducing uptime, such as breakdowns or extended changeovers.
Tracking Performance for Better Speed
Performance looks at how fast a machine runs compared to its ideal speed. OEE software identifies slow cycles and brief stops that might be missed during manual tracking. It highlights areas where the process can be streamlined to achieve better cycle times and output rates.
Improving Quality Through Insight
Quality measures the number of good parts produced without defects. The software captures scrap rates and rework levels, helping identify recurring quality issues. With this data, teams can work on root causes and improve consistency across production runs.
Driving Continuous Improvement
By using OEE software, organisations gain a full picture of equipment performance. This visibility helps reduce waste, increase productivity, and support continuous improvement efforts in a practical and measurable way.
Real-Time Data: How OEE Software Keeps You Ahead of Equipment Issues
Immediate Visibility of Equipment Status
OEE software gives teams instant access to real-time equipment data, allowing them to spot issues as soon as they happen. Whether it’s an unexpected stop or a drop in performance, alerts and dashboards show exactly what’s going on, helping teams act before small problems become bigger ones.
Faster Response to Downtime
Real-time tracking means downtime is recorded the moment it occurs. Teams can quickly investigate the cause, take corrective action, and get production back on track. This reduces delays and helps maintain smoother operations throughout the day.
Spotting Performance Drops Early
When machines start to slow down or perform below standard, OEE software picks it up straight away. By highlighting performance issues in real time, the software enables operators and managers to adjust settings, check for worn parts, or plan maintenance without waiting for end-of-day reports.
Better Decision-Making on the Spot
Access to real-time data means better decisions can be made during production. Whether it’s shifting tasks, reassigning labour, or prioritising maintenance, OEE software supports quick thinking based on solid facts rather than guesswork.
Preventing Future Issues
Trends spotted in real time can signal potential future failures. By analysing this data, teams can schedule preventative maintenance, reducing unplanned downtime and improving equipment reliability over the long term.
How to Identify Downtime Causes Using OEE Dashboards
Understanding the Types of Downtime
OEE dashboards help break down downtime into different categories, such as planned, unplanned, or minor stops. By clearly labelling each type, teams can easily see which areas need attention and reduce guesswork when analysing issues.
Real-Time Alerts and Tracking
Modern OEE dashboards show downtime events as they happen. Each time a machine stops, the dashboard records the exact time and duration. This instant feedback allows teams to take quick action, saving valuable production time and reducing waste.
Using Historical Trends
OEE dashboards store past performance data, helping teams spot recurring downtime patterns. If the same issue appears regularly at the same time or with a specific machine, it can point to a deeper cause that needs long-term correction.
Root Cause Analysis Tools
Many dashboards come with built-in tools for identifying root causes. These features often include comments, codes, and reasons that operators can select when a stop occurs. Over time, this builds a clear picture of why downtime happens and what can be done to prevent it.
Supporting Team Discussions
With all the data in one place, OEE dashboards become a helpful tool during team reviews or improvement meetings. The visual layout makes it easier to explain issues, prioritise actions, and assign follow-up tasks.
Understanding Performance Losses and Speed Variances with OEE Insights
What Are Performance Losses?
Performance losses occur when equipment runs slower than its maximum possible speed. This includes short stops, minor delays, or reduced cycle times that affect productivity. Even if machines are running, anything below the ideal speed counts as a performance loss.
Tracking Speed Variances
OEE insights allow teams to monitor speed variances in real time. If a machine is operating slower than expected, the system highlights this drop, making it easier to investigate and resolve the issue before it impacts output.
Identifying Causes of Speed Loss
Common causes of performance losses include mechanical wear, poor maintenance, operator delays, or product variation. By using data from OEE software, teams can pinpoint which factor is responsible and take specific action to improve performance.
Analysing Trends for Improvement
OEE dashboards display trends over time, showing when and where speed losses most often occur. This historical data helps uncover patterns and supports planning for maintenance, training, or process changes to reduce ongoing performance losses.
Boosting Efficiency Through Action
By regularly reviewing OEE performance insights, organisations can focus on reducing speed variances and boosting overall equipment effectiveness. These small, continuous improvements lead to better efficiency, smoother operations, and higher output in the long run.
How OEE Software Tracks Quality Loss and Defects Over Time
Understanding Quality Loss in OEE
Quality loss refers to the portion of products that do not meet required standards during production. These may be scrapped or require rework, reducing the overall efficiency of your process. Tracking this loss is key to improving manufacturing output.
Automatic Detection of Defects
OEE software helps identify quality issues by recording the number of defective items produced. It compares this figure against total output to calculate a quality percentage. Any drop in this number indicates potential issues on the production line.
Recording Defect Types and Patterns
With real-time tracking, OEE tools allow teams to categorise different types of defects. Over time, the software builds a record of recurring problems, making it easier to spot patterns and focus improvements where they are needed most.
Using Historical Data for Root Cause Analysis
By storing quality data over days, weeks, or months, the software makes it possible to analyse long-term trends. Teams can use this data to investigate root causes, whether it's a machine fault, material issue, or training gap.
Driving Continuous Improvement
With a clear view of where and when defects occur, organisations can take targeted action. Reducing quality loss not only cuts waste but also improves customer satisfaction and lowers production costs—making quality tracking a key part of OEE success.
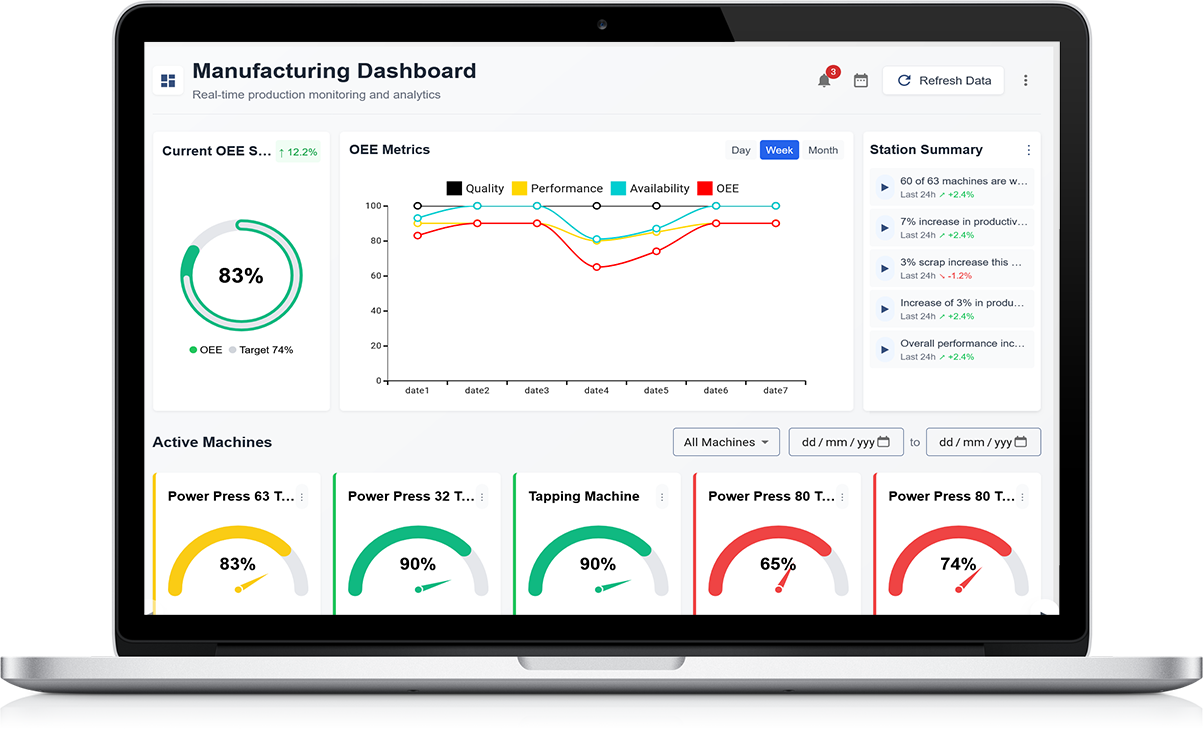
Visualising Equipment Efficiency: Charts, Metrics, and Custom Reports
The Importance of Clear Visuals in Equipment Monitoring
Tracking equipment efficiency is much easier when performance data is displayed visually. Charts and reports help teams understand how machines are running and where improvements can be made. Instead of scanning through raw numbers, you get a clear picture of your operation’s health.
Using Charts to Monitor Key Metrics
Line charts, bar graphs, and pie charts can show trends over time, such as machine uptime, downtime, or production volume. These visuals make it simple to spot patterns, highlight dips in efficiency, and detect when action is needed.
Focus on Metrics That Matter
OEE software tracks core metrics like availability, performance, and quality. Each one provides insight into different aspects of your equipment’s operation. Displaying these together in a dashboard gives a well-rounded view of overall efficiency.
Creating Custom Reports for Your Needs
Custom reports allow teams to focus on the data that matters most to their department or shift. Whether it's a daily summary or a weekly overview, reports can be tailored to highlight key issues or achievements, helping teams stay informed and aligned.
Better Decisions Through Visual Data
When data is easy to understand, decision-making becomes faster and more accurate. Visual tools not only improve communication between teams but also help managers drive better outcomes by reacting quickly to what the data shows.
Linking OEE to Preventative Maintenance and Condition Monitoring
Understanding the Connection Between OEE and Maintenance
Overall Equipment Effectiveness (OEE) provides valuable insights that can guide maintenance activities. By closely tracking availability, performance, and quality, teams can identify early warning signs that suggest when equipment might need attention, helping to prevent breakdowns before they happen.
Using OEE Data for Preventative Maintenance
When patterns of unplanned downtime or reduced performance begin to appear, it often signals the need for preventative maintenance. Regularly reviewing OEE data allows maintenance teams to schedule checks and servicing during non-peak times, reducing disruption and keeping machines running smoothly.
Condition Monitoring for Long-Term Efficiency
Condition monitoring involves observing changes in equipment behaviour, such as vibration levels, temperature, or noise. When this data is linked with OEE trends, it becomes easier to predict issues and take corrective action early. This approach reduces the risk of unexpected failures and extends the life of your machinery.
Combining Visuals and Data for Smarter Planning
Displaying OEE metrics alongside maintenance logs and condition data on a single dashboard creates a full picture of equipment health. This makes it easier for managers to plan, prioritise tasks, and reduce reactive maintenance efforts.
Building a Culture of Continuous Care
Linking OEE with preventative strategies helps create a proactive workplace culture. Instead of waiting for things to go wrong, teams use data to stay ahead of issues—resulting in higher reliability, better performance, and reduced maintenance costs.
Using Historical OEE Trends to Improve Long-Term Equipment Performance
The Power of Looking Back
Reviewing historical Overall Equipment Effectiveness (OEE) data gives teams a clear picture of how equipment has performed over time. By analysing patterns and identifying recurring issues, businesses can make better decisions about maintenance, upgrades, and process improvements.
Spotting Long-Term Issues
Trends in OEE data can highlight ongoing problems such as repeated downtime, slow cycles, or quality losses. These trends help pinpoint root causes that might not be obvious in daily operations. Recognising and addressing these long-term issues leads to more reliable performance.
Planning Future Improvements
With a clear view of past performance, it becomes easier to set realistic goals for the future. For example, if equipment availability has dropped each quarter, the team can investigate causes and plan targeted maintenance or training to fix it. This approach supports continuous improvement.
Supporting Smarter Investment Decisions
Historical OEE trends provide solid evidence for investment in new equipment or upgrades. Rather than relying on guesswork, teams can use real data to justify changes that will have a proven impact on productivity and efficiency.
Creating a Cycle of Improvement
By regularly reviewing and acting on OEE trends, businesses create a strong feedback loop. This not only improves long-term performance but also encourages teams to stay engaged with ongoing improvement efforts, helping the organisation stay competitive and efficient.
How OEE Data Supports Lean Manufacturing and Continuous Improvement
Making Waste Visible
OEE (Overall Equipment Effectiveness) data plays a key role in lean manufacturing by making waste visible. It tracks availability, performance, and quality, helping teams quickly identify losses in production. By clearly showing where time, resources, or materials are being wasted, OEE data guides more focused improvement efforts.
Improving Equipment Use
Lean manufacturing aims to get the most value from existing resources. OEE helps by showing how well machines are performing compared to their full potential. With this insight, teams can take action to reduce downtime, improve speed, and cut down on defects, all of which lead to better equipment utilisation.
Supporting Data-Driven Decisions
OEE data provides facts, not opinions. This allows managers and frontline staff to base decisions on actual performance instead of assumptions. Whether it's scheduling maintenance, changing shift routines, or updating processes, data-backed decisions are more effective and easier to support.
Creating a Culture of Improvement
When teams regularly review OEE data, it encourages a mindset of continuous improvement. Everyone becomes more aware of how their work affects performance and looks for ways to improve outcomes. Over time, this builds a culture where small changes add up to big gains.
Driving Long-Term Success
By integrating OEE into daily routines and long-term planning, businesses can improve efficiency, reduce waste, and maintain consistent progress. It’s a powerful tool for turning lean manufacturing ideas into everyday practices that deliver real results.
Creating a Culture of Accountability with Transparent Equipment Tracking
Why Visibility Matters
Transparent equipment tracking helps everyone on the shop floor see how machines are performing in real time. When information is clear and accessible, it builds trust and allows every team member to understand how their actions affect overall performance. Visibility sets the stage for accountability.
Encouraging Ownership
When staff can see the impact of downtime, speed losses, or defects, they become more involved in maintaining equipment and meeting targets. With clear tracking in place, teams are more likely to take ownership of their responsibilities and work together to improve results.
Identifying Gaps and Taking Action
Transparent tracking shows exactly where issues are happening—whether it’s a repeated fault, a delay in maintenance, or inefficient changeovers. By clearly identifying these gaps, teams can take prompt action, leading to fewer disruptions and better performance.
Building Consistent Habits
Having access to live equipment data makes daily checks and updates part of the regular routine. This consistency strengthens accountability across teams and departments. Everyone becomes more aware of their role in improving reliability and output.
Driving Long-Term Accountability
Over time, transparent tracking helps build a workplace culture where accountability is natural. It’s not about blame—it’s about giving people the right tools and information to succeed. With everyone aligned and informed, performance improves, and teams grow stronger together.
How to Use OEE Metrics in Daily Operational Meetings
Making OEE Part of the Daily Routine
Integrating OEE metrics into your daily operational meetings helps teams stay focused on performance goals. These meetings offer a regular opportunity to review key metrics and ensure that everyone understands what’s going well and where improvements are needed.
Highlighting Key Performance Areas
Start your meetings by reviewing the three core areas of OEE: Availability, Performance, and Quality. This helps teams see which part of the process is underperforming. By focusing on actual numbers, you create a clear picture of daily operations and reduce guesswork.
Identifying Trends and Issues
Daily reviews allow you to spot issues early—whether it’s a machine that frequently stops, a shift in output speed, or an increase in rejected items. Quick identification means faster resolutions and fewer long-term disruptions.
Encouraging Team Input
Encourage team members to share observations and ideas during the review of OEE data. This builds engagement and helps gather insights from those working directly with the equipment. It also promotes shared ownership of targets and performance.
Setting Daily Improvement Goals
Finish your meeting by setting short-term goals based on the OEE metrics discussed. These goals should be simple and realistic—such as reducing unplanned downtime or improving first-pass yield. This keeps improvement efforts focused and manageable for each day.
Integration Made Easy: Connecting OEE Software with Existing Systems
Why Integration Matters
Integrating OEE software with your existing systems is essential for creating a complete picture of your operations. It allows data to flow seamlessly between machines, production lines, and reporting tools, reducing manual input and errors.
Connecting to Production Equipment
Modern OEE software is designed to link easily with machines and sensors already on the shop floor. This helps gather accurate real-time data on machine availability, performance, and quality without needing extra manual tracking. Automation also means quicker and more reliable insights.
Linking with Planning and Scheduling Tools
When connected to planning tools, OEE software provides context to production issues. For example, if a drop in efficiency matches a last-minute schedule change, the team can make more informed decisions. This type of integration supports better planning and fewer delays.
Simplifying Data Sharing Across Teams
OEE integration ensures that data is not siloed. Whether it’s operations, maintenance, or quality teams, everyone gets access to the same information. This shared visibility improves communication and helps teams work towards common goals.
Planning a Smooth Integration
Start with a clear plan. Identify the systems that need to link with your OEE software, set goals for the integration, and involve the right team members from IT and operations. With the right setup, integration becomes a smooth and valuable step towards smarter performance monitoring.
Common Mistakes in Manual Tracking and How Software Eliminates Them
Human Error and Missed Entries
One of the biggest challenges with manual tracking is human error. People may forget to record downtime, enter the wrong data, or miss steps during busy shifts. These mistakes can lead to inaccurate reports and poor decision-making. Software automates data collection, ensuring that information is always recorded correctly and on time.
Inconsistent Data Recording
When different team members record data in different ways, it becomes difficult to maintain consistency. Paper logs and spreadsheets often vary in format and detail. With tracking software, data is captured in a standard format every time, leading to more reliable reporting and analysis.
Delays in Data Availability
Manual tracking creates delays between when something happens and when it gets reported. This time lag can prevent teams from reacting quickly to problems. Software provides real-time data, allowing teams to take immediate action and reduce the impact of issues on productivity.
Difficulty Spotting Patterns
It’s hard to identify patterns or trends in handwritten notes or multiple spreadsheets. Software tools automatically organise and display data through dashboards and charts, helping teams easily spot recurring issues and areas for improvement.
Improved Accuracy and Efficiency
By replacing manual tracking with automated software, organisations reduce errors, save time, and gain a clearer view of performance. This shift leads to smarter decisions, better results, and a more efficient operation overall.
From the Shop Floor to the Boardroom: How OEE Reports Drive Strategic Decisions
Turning Daily Operations into Meaningful Insights
Overall Equipment Effectiveness (OEE) reports are not just useful on the factory floor—they play a key role in shaping wider business strategy. These reports collect and present real-time data from daily operations, offering a clear picture of how equipment is performing in terms of availability, performance, and quality.
Bridging the Gap Between Teams
OEE reports help connect frontline staff with senior management. While operators focus on keeping machines running smoothly, leadership teams rely on clear metrics to make informed decisions. OEE reporting tools translate complex data into easy-to-understand visuals, making it accessible for everyone in the organisation.
Supporting Long-Term Planning
Strategic decisions often depend on identifying trends over time. OEE reports highlight patterns in production delays, breakdowns, or output quality, allowing management to allocate resources effectively. These insights support better planning for maintenance schedules, training, and investment in new equipment or upgrades.
Driving Continuous Improvement
By using OEE reports regularly, teams at all levels can measure the success of improvement initiatives. Progress is tracked over weeks or months, giving a clear view of where changes are working and where more focus is needed. This data-backed approach ensures that improvements are not just short-term fixes but long-term gains.
Empowering Better Business Decisions
From improving shop floor performance to guiding executive strategy, OEE reports offer the insight needed to make smarter, faster, and more effective decisions across the business.