What Makes OEE Measurement Different in Process Industries?
Continuous Flow vs Discrete Production
In process industries, production often runs continuously without clear start and stop points, unlike discrete manufacturing where items are produced in separate units. This makes measuring Overall Equipment Effectiveness (OEE) more complex, as downtime, speed loss, and quality issues may not be as easily defined or isolated.
Handling Variable Input and Output
Process industries often deal with raw materials that vary in quality, which can impact output consistency. Measuring performance in such environments means considering fluctuations in input quality, which can affect yield and make standard OEE calculations less straightforward.
Complex Downtime and Minor Stops
Unlike machines that stop clearly, process equipment may slow down or operate below capacity without completely stopping. These minor losses are harder to detect but still impact OEE. Special attention is needed to capture speed losses and micro-stoppages accurately in a continuous setup.
Quality Measurement Over Time
In batch or continuous processes, quality is often measured across a period or volume rather than by individual units. Rejects or waste may only be known after processing is complete, so real-time quality tracking becomes more challenging and may require automated sensors or lab analysis.
Need for Integrated Data Collection
OEE in process industries benefits from systems like SCADA or MES to collect real-time data. Manual tracking is difficult due to the speed and scale of operations. Integrated systems help capture accurate availability, performance, and quality data for meaningful OEE insights.
Understanding the Basics: Availability, Performance & Quality in a Continuous Flow
Availability: Tracking Actual Production Time
In continuous flow environments, availability measures how much time the equipment is truly running compared to the scheduled time. Unlike stop-start operations, process equipment may not shut down entirely but still experience slowdowns or interruptions. Recording both full and partial downtimes is key to understanding real equipment availability.
Performance: Measuring Speed Against Ideal Output
Performance looks at how fast the process runs compared to its ideal speed. In continuous flow, slight reductions in speed over long periods can add up to major losses. Monitoring flow rates, feed speeds, or line throughput helps identify when the system is running below its designed efficiency, even if it never stops completely.
Quality: Assessing Output That Meets Standards
Quality in a continuous process is about the proportion of output that meets required standards. This may not be immediately visible, especially if quality checks occur after long runs. Measuring quality means tracking waste, reprocessing needs, and the consistency of finished product properties over time, not just counting rejects.
Integrating All Three for Clear Insight
In a continuous setup, combining availability, performance, and quality gives a full picture of effectiveness. Each factor needs careful monitoring, often with the help of automation, to provide accurate OEE data. Together, they highlight where time, speed, or product loss is occurring, helping teams take focused improvement actions.
How to Calculate OEE for Batch vs Continuous Production Lines
Understanding the Basics of OEE
Overall Equipment Effectiveness (OEE) is calculated using three key factors: Availability, Performance, and Quality. It shows how effectively production equipment is being used, but the way it is measured can vary depending on whether the line runs in batches or continuously.
OEE in Batch Production
In batch production, equipment runs for specific periods to produce fixed quantities. Downtime is easier to track because there are clear start and end points. Performance is measured based on how many units were produced compared to the planned rate, and quality is based on accepted vs rejected units in each batch.
OEE in Continuous Production
Continuous production lines run for long periods without breaks, such as in chemical or food processing. Here, measuring downtime is more complex as issues like slowdowns or minor stops may not involve full shutdowns. Performance is often tracked through flow rate or tonnes per hour, and quality is judged over time, not per unit.
Adjusting the Approach to Suit the Process
While the OEE formula remains the same, data collection methods differ. Batch lines may rely on manual entries or machine counters, while continuous lines often need automated systems to capture speed losses, partial downtimes, and quality variation in real time. Choosing the right method ensures OEE results reflect actual performance.
Using OEE to Improve Both Setups
Whether in batch or continuous flow, OEE helps identify where losses occur. By understanding how to calculate and interpret OEE for each type of process, teams can take targeted actions to reduce waste, increase uptime, and improve output quality.
Capturing Downtime Accurately in Process Environments
Why Downtime Tracking Matters
In process industries, capturing downtime accurately is vital for understanding equipment efficiency and overall performance. Even short or partial interruptions can affect output significantly over time. Downtime data helps identify problem areas, plan maintenance better, and improve production stability.
Types of Downtime to Monitor
Downtime in process environments can be planned or unplanned. Planned downtime includes scheduled maintenance or product changeovers. Unplanned downtime involves breakdowns, blockages, power failures, or human errors. Tracking both types ensures a complete picture of equipment availability and helps reduce avoidable losses.
Dealing with Partial and Hidden Downtime
Not all downtime is obvious. In continuous production, slowdowns or line imbalances may reduce output without full stops. This “hidden” downtime often goes unnoticed unless closely monitored. Capturing these losses requires detailed observation or automatic tracking to reveal gaps in productivity.
Using Standardised Categories
To analyse downtime effectively, use standard categories such as mechanical failure, material shortages, operator delays, or external factors. This makes it easier to compare shifts, machines, or sites and pinpoint recurring causes that need long-term solutions.
Leveraging Automation for Accuracy
Automated systems such as sensors or machine monitoring tools can record exact start and end times of downtime events. This removes guesswork, improves accuracy, and allows teams to react more quickly. Real-time alerts also support faster recovery and root cause analysis.
How to Track Micro-Stoppages and Minor Losses in Process Plants
Understanding Micro-Stoppages in Continuous Production
Micro-stoppages are brief interruptions in production that often last just a few seconds or minutes. These small delays may seem harmless, but in high-speed or continuous process plants, they can add up to significant performance losses over time. Identifying and reducing them is key to improving overall efficiency.
Why Minor Losses Are Often Overlooked
Minor losses include speed reductions, short delays, or brief pauses that don’t trigger alarms or full shutdowns. Because they don’t stop production entirely, they’re often missed during routine checks. Yet they affect flow rate, increase energy usage, and reduce overall output without being easily noticed.
Using Automation and Sensors for Detection
Automated systems like line sensors or flow meters are helpful in detecting micro-stoppages. These tools can track real-time fluctuations in speed, pressure, or output. When performance drops below a defined threshold, the system flags the event, making it easier to measure and review small interruptions.
Recording and Analysing Micro Events
Set up a log to record the frequency, duration, and suspected causes of micro-stoppages. Patterns may reveal issues such as inconsistent material feed, minor mechanical faults, or timing mismatches. Over time, analysing this data helps uncover the root causes of repetitive minor losses.
Turning Small Fixes into Big Gains
By tracking and acting on micro-stoppages, teams can make small adjustments that lead to big improvements. Whether it’s fine-tuning equipment, updating maintenance routines, or improving training, reducing these hidden losses boosts overall equipment effectiveness and production stability.
Using SCADA, PLC, or MES Data to Automate OEE Calculations
Why Automating OEE Makes a Difference
Automating OEE calculations improves accuracy, saves time, and provides real-time visibility of equipment performance. By using data from existing control systems like SCADA, PLCs, or MES platforms, manufacturers can streamline the tracking of Availability, Performance, and Quality without relying on manual entry.
Capturing Real-Time Availability Data
Programmable Logic Controllers (PLCs) and SCADA systems record equipment status continuously. This allows automatic detection of start-ups, shutdowns, and downtime events. With this data, Availability can be calculated precisely based on the total run time versus scheduled time, without human error or delays.
Monitoring Speed and Throughput for Performance
SCADA and MES systems track flow rates, cycle times, and output quantities. This information feeds directly into the Performance component of OEE. If a machine runs slower than expected or produces below the ideal rate, the system flags the difference and records it for analysis.
Automating Quality Checks
Quality data—such as rejected units or off-spec batches—can also be captured through integrated sensors or entered into MES platforms. Linking this to OEE gives a clearer picture of how much of the output meets standards, without waiting for end-of-shift reports.
Benefits of Seamless Integration
By connecting OEE measurement to control systems, teams gain faster insights and better decision-making tools. It supports early problem detection, reduces paperwork, and allows for continuous improvement based on accurate, real-time data across all production shifts.
Dealing with Variable Input Quality in OEE Calculations
Why Input Quality Matters in Process Performance
In many manufacturing environments, especially process industries, the quality of raw materials can vary from batch to batch. These variations affect equipment performance, production speed, and product quality. When input quality fluctuates, it becomes a major factor influencing Overall Equipment Effectiveness (OEE).
How Poor Input Affects OEE Components
Variable input can cause more downtime if machines require cleaning, adjustment, or maintenance due to inconsistent material behaviour. It may also slow down production or result in a higher rate of defects. All these effects directly impact the Availability, Performance, and Quality aspects of the OEE formula.
Tracking Input Quality Separately
To improve OEE analysis, it’s helpful to track raw material quality separately from machine-related issues. This allows teams to isolate whether performance losses are due to operator error, equipment faults, or material inconsistencies. Over time, comparing input data with OEE scores helps reveal root causes.
Working Closely with Suppliers and Teams
Collaborating with raw material suppliers and quality teams can help reduce variability. Establishing clear material standards, checking specifications on delivery, and recording any deviations allow faster corrective actions. Consistency in inputs leads to better OEE results and fewer production problems.
Adapting Equipment and Processes
In cases where input variability is unavoidable, adjustments to process parameters or flexible equipment settings may be needed. By designing systems that can adapt to a wider range of input conditions, manufacturers can reduce the impact of raw material changes and maintain more stable OEE performance.
Why Performance Loss in Process Industries Isn’t Always Speed-Based
Looking Beyond Line Speed
In process industries, performance loss is often linked to more than just how fast equipment runs. While line speed is important, other hidden factors can reduce output without visibly slowing the process. These losses are often subtle and can go unnoticed unless closely monitored and analysed.
Minor Stops and Flow Disruptions
Small interruptions, such as brief clogs, material feed inconsistencies, or pressure drops, may not halt production but still impact overall flow. These micro-stoppages cause fluctuations in process stability and reduce the effective output over time, even when the system appears to be running normally.
Suboptimal Process Conditions
Running at non-ideal settings—such as incorrect temperature, pressure, or mix ratios—can lead to slower reactions or reprocessing needs. This reduces yield and increases cycle time without changing the physical speed of machines. Performance loss here is about process efficiency, not speed alone.
Equipment Not Running at Designed Capacity
Sometimes machines are intentionally run below capacity to avoid strain, reduce wear, or match input quality. While this may protect assets, it also lowers the actual performance rate. The system might be stable, but its potential output isn’t fully used.
Process Balancing Across Multiple Lines
In plants with linked stages, performance losses can occur due to imbalances between sections. If one area runs slower or builds up backlog, the entire line may need to pause or adjust. This coordination issue affects performance without involving any speed changes at individual machines.
Customising the OEE Formula to Match Your Industry (Food, Pharma, Chemicals, etc.)
Why OEE Needs to Be Adapted
The standard OEE formula—Availability × Performance × Quality—offers a strong framework for measuring equipment efficiency. However, industries like food, pharmaceuticals, and chemicals have specific processes and regulations that make it necessary to adapt how these elements are calculated and interpreted.
Handling Batch Processing and Changeovers
In sectors such as pharmaceuticals or specialty chemicals, frequent product changeovers and cleaning cycles are essential. These planned downtimes can distort Availability if not recorded correctly. Many sites choose to exclude validated changeover time or classify it separately to get a clearer picture of true equipment uptime.
Measuring Quality Based on Compliance
Quality in regulated industries is not only about defects but also compliance with strict specifications. For example, in food production, even a small deviation in weight or temperature can make a product non-conforming. Quality measurement may include additional checks like lab test results or visual inspections, not just rejected items.
Performance Factors Beyond Speed
In continuous or sensitive processes, running at reduced speed is often intentional to maintain product quality. In these cases, Performance is better measured against an adjusted target rate rather than theoretical maximum speed. This helps reflect practical conditions more accurately.
Using Industry-Specific KPIs
Customising OEE also involves linking it to key performance indicators relevant to your industry. For example, yield loss, contamination incidents, or shelf-life issues might be included in extended OEE tracking. Tailoring the formula ensures it drives decisions that support real operational goals.
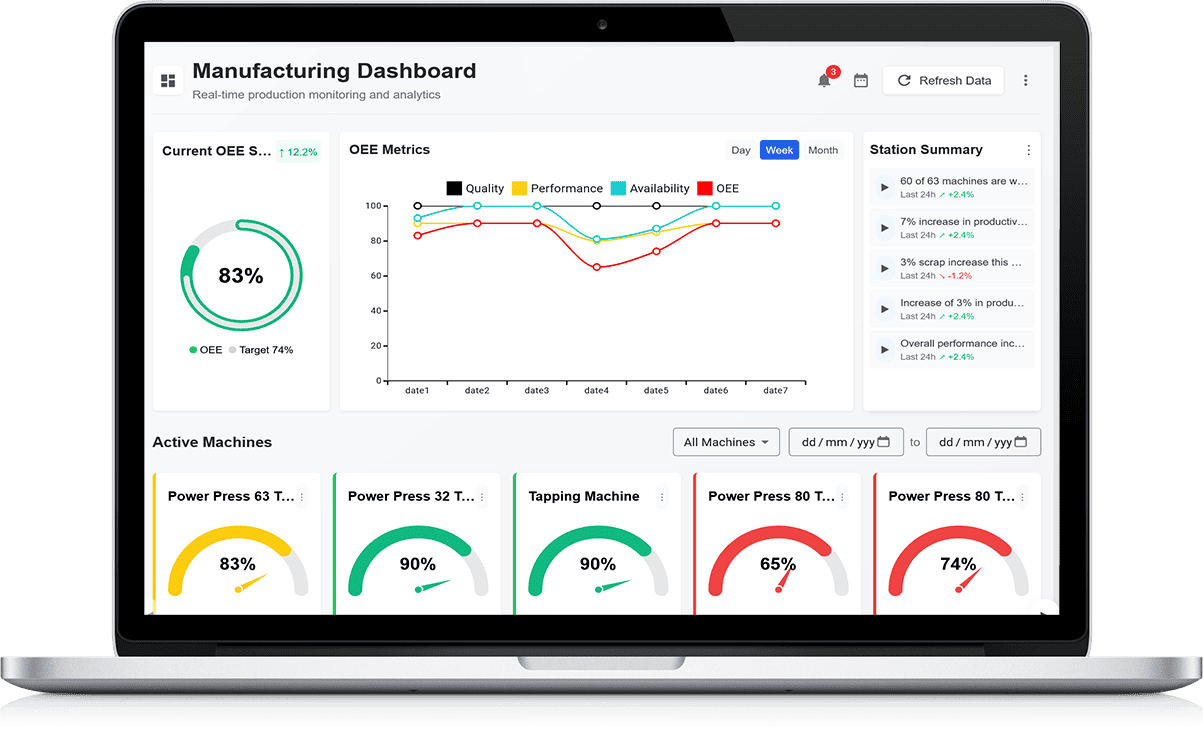
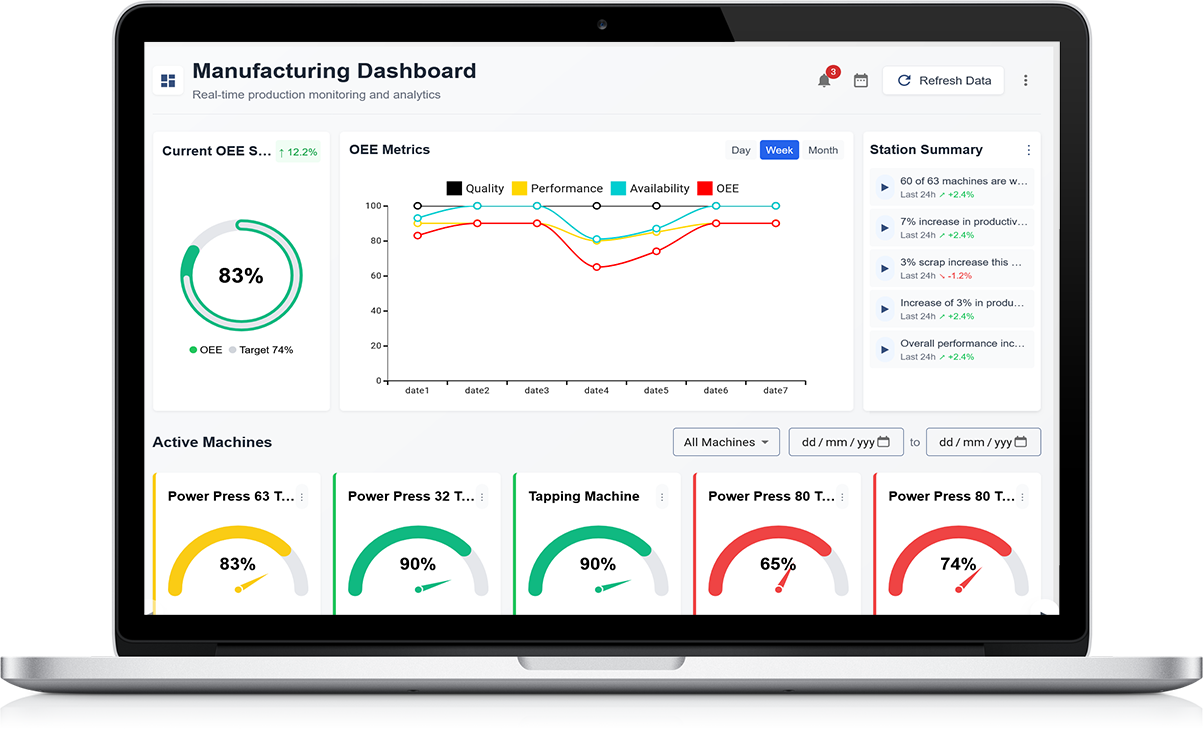
Real-Time OEE Dashboards for Continuous Process Monitoring
Keeping a Constant Eye on Equipment Performance
Real-time OEE dashboards provide a live view of how well your equipment is performing at any given moment. In continuous process industries, where production runs non-stop, this visibility is essential. It allows teams to react quickly to losses in Availability, Performance, or Quality before they impact output significantly.
Displaying Live Metrics Across Shifts
A real-time dashboard shows key OEE metrics as they happen. It can highlight machine downtime, drops in speed, or changes in product quality instantly. Teams on the shop floor can track these metrics across shifts, ensuring smooth handovers and consistent awareness of operational health.
Helping Operators Make Faster Decisions
With real-time data, operators no longer need to wait for end-of-shift reports to identify issues. Dashboards can trigger alerts or colour changes when values fall below target levels. This helps staff respond immediately, reducing the length and impact of any loss.
Encouraging Collaboration and Transparency
Dashboards placed in visible areas promote team communication and transparency. Everyone, from machine operators to supervisors, sees the same information. This shared view builds accountability and drives joint problem-solving, especially when trends begin to move in the wrong direction.
Integrating with Automated Data Sources
These dashboards work best when connected to automated systems that collect data from sensors, controllers, and software platforms. By removing manual data entry, the dashboard reflects real-time performance accurately and consistently, making it a valuable tool for continuous process improvement.
How to Train Operators and Engineers to Interpret OEE Data Correctly
Starting with the Basics of OEE
Effective training begins by helping operators and engineers understand what Overall Equipment Effectiveness (OEE) means. Break down the three core components—Availability, Performance, and Quality—and explain how each one impacts productivity. Use real examples from your factory floor to make it relatable and easy to grasp.
Explaining the Purpose Behind the Numbers
It’s important to show why OEE matters, not just how to calculate it. Help the team see how small losses—such as micro-stoppages, reduced speed, or minor defects—can lower OEE and affect delivery, costs, and customer satisfaction. This builds motivation to use the data effectively.
Using Visual Aids and Real-Time Dashboards
Visual tools like charts, graphs, and colour-coded dashboards make OEE data easier to understand. During training sessions, walk through sample dashboards and explain what the numbers indicate. Highlight how to recognise trends, spot issues, and interpret red or yellow flags accurately.
Running Practice Sessions with Real Data
Let operators and engineers work with actual data from recent shifts or machines. Ask them to calculate OEE, identify losses, and suggest improvements. This hands-on approach builds confidence and encourages better use of the information during daily operations.
Encouraging Questions and Ongoing Learning
Make OEE training a two-way conversation. Invite questions and feedback so the content stays relevant. Offer refresher sessions regularly, and include OEE interpretation in shift meetings, toolbox talks, or improvement workshops to keep the learning active and practical.
Integrating OEE Metrics with Maintenance and Quality Systems
Creating a Unified View of Performance
Integrating Overall Equipment Effectiveness (OEE) with maintenance and quality systems helps build a complete picture of production efficiency. When data from these areas is linked, teams can better understand the causes of downtime, poor performance, or quality losses—and act faster to improve them.
Using Maintenance Data to Improve Availability
Maintenance activities directly affect equipment availability. By linking OEE with maintenance systems, teams can see how often breakdowns occur, how long they last, and whether they follow a pattern. This information supports preventive actions, like scheduling servicing before faults cause unplanned stops.
Connecting Quality Records to OEE Losses
Quality systems often record defects, waste, and rework. When this data is connected to OEE, the Quality percentage reflects not just final rejects but process-related quality trends. This helps identify root causes—such as incorrect settings or material changes—that can be corrected early.
Using Shared Data for Better Decision-Making
When maintenance, quality, and production teams access the same OEE data, they can collaborate more effectively. For example, if equipment underperforms, the maintenance team can check for wear, while quality can confirm if product standards are affected. This joined-up thinking leads to faster, smarter decisions.
Improving Long-Term Reliability and Output
With integrated systems, it becomes easier to track the long-term impact of improvements. Whether a new maintenance plan or process change is made, changes in OEE can confirm whether performance is truly improving. This supports continuous improvement across the factory floor.
Common Mistakes in Measuring OEE in Process Industries — and How to Avoid Them
Overlooking Minor Stops and Speed Loss
One common mistake is ignoring brief pauses or slowdowns in the production line. In process industries, even short disruptions or reduced flow rates can lead to large performance losses over time. To avoid this, use sensors or automated systems to track all events, no matter how small.
Inaccurate Downtime Recording
Many teams rely on manual entry to log downtime, which often misses short or recurring interruptions. In process environments, where machines run continuously, downtime must be captured in real time. Automated tracking improves accuracy and provides better insights into true equipment availability.
Measuring Quality Too Late
Quality losses are sometimes detected only after full batches or extended runs, making it difficult to react quickly. This delay affects the accuracy of OEE data. To improve this, integrate in-line checks or regular sampling throughout the process to monitor quality in real time.
Applying Discrete Metrics to Continuous Processes
Using standard OEE models meant for unit-based production can mislead teams working in continuous environments. Instead, use flow rate, run hours, and product yield to reflect the true performance of process equipment more accurately.
Failing to Link OEE to Root Causes
Another mistake is treating OEE numbers in isolation without investigating underlying issues. Without root cause analysis, repeated losses continue. Always use OEE data as a trigger to explore why losses occur and involve cross-functional teams to solve them at the source.
Case Study: Improving OEE in a UK-Based Continuous Manufacturing Plant
Initial Challenges Faced by the Operations Team
A continuous manufacturing plant in the UK was facing inconsistent output levels and increasing levels of unplanned downtime. The operations team struggled to pinpoint the root causes of performance loss, as most issues weren’t captured accurately through manual data entry. OEE figures remained below the company’s target of 70% for several months.
Identifying the Main Loss Areas
After reviewing production trends, the team found that frequent micro-stoppages and slowdowns were going unnoticed. Although machines rarely stopped completely, small speed drops and product build-up at bottlenecks were affecting total throughput. Quality checks also revealed occasional variation in product weight and consistency, contributing to hidden losses.
Implementing Real-Time Data Collection
To improve visibility, the plant introduced automated sensors and basic monitoring dashboards linked to the production line. These tools captured real-time data on flow rate, downtime events, and quality deviations. With accurate and continuous feedback, the team began holding daily reviews using visual performance boards and shift summaries.
Results Achieved Over a 3-Month Period
Within three months, the plant saw measurable improvements. OEE rose from 64% to 75%, driven mainly by better handling of minor stoppages and improved scheduling of maintenance. Quality-related losses also declined, thanks to faster feedback and adjustments. Teams became more engaged, using data to identify and act on issues quickly.
Key Takeaways from the Project
This case highlighted the importance of real-time visibility, team ownership, and simple visual tools in driving OEE improvements in continuous operations. The changes were low-cost but delivered long-lasting gains in efficiency and reliability across the plant.