What Is the SQDCP Framework and Why Does It Matter?
Understanding the Five Key Pillars
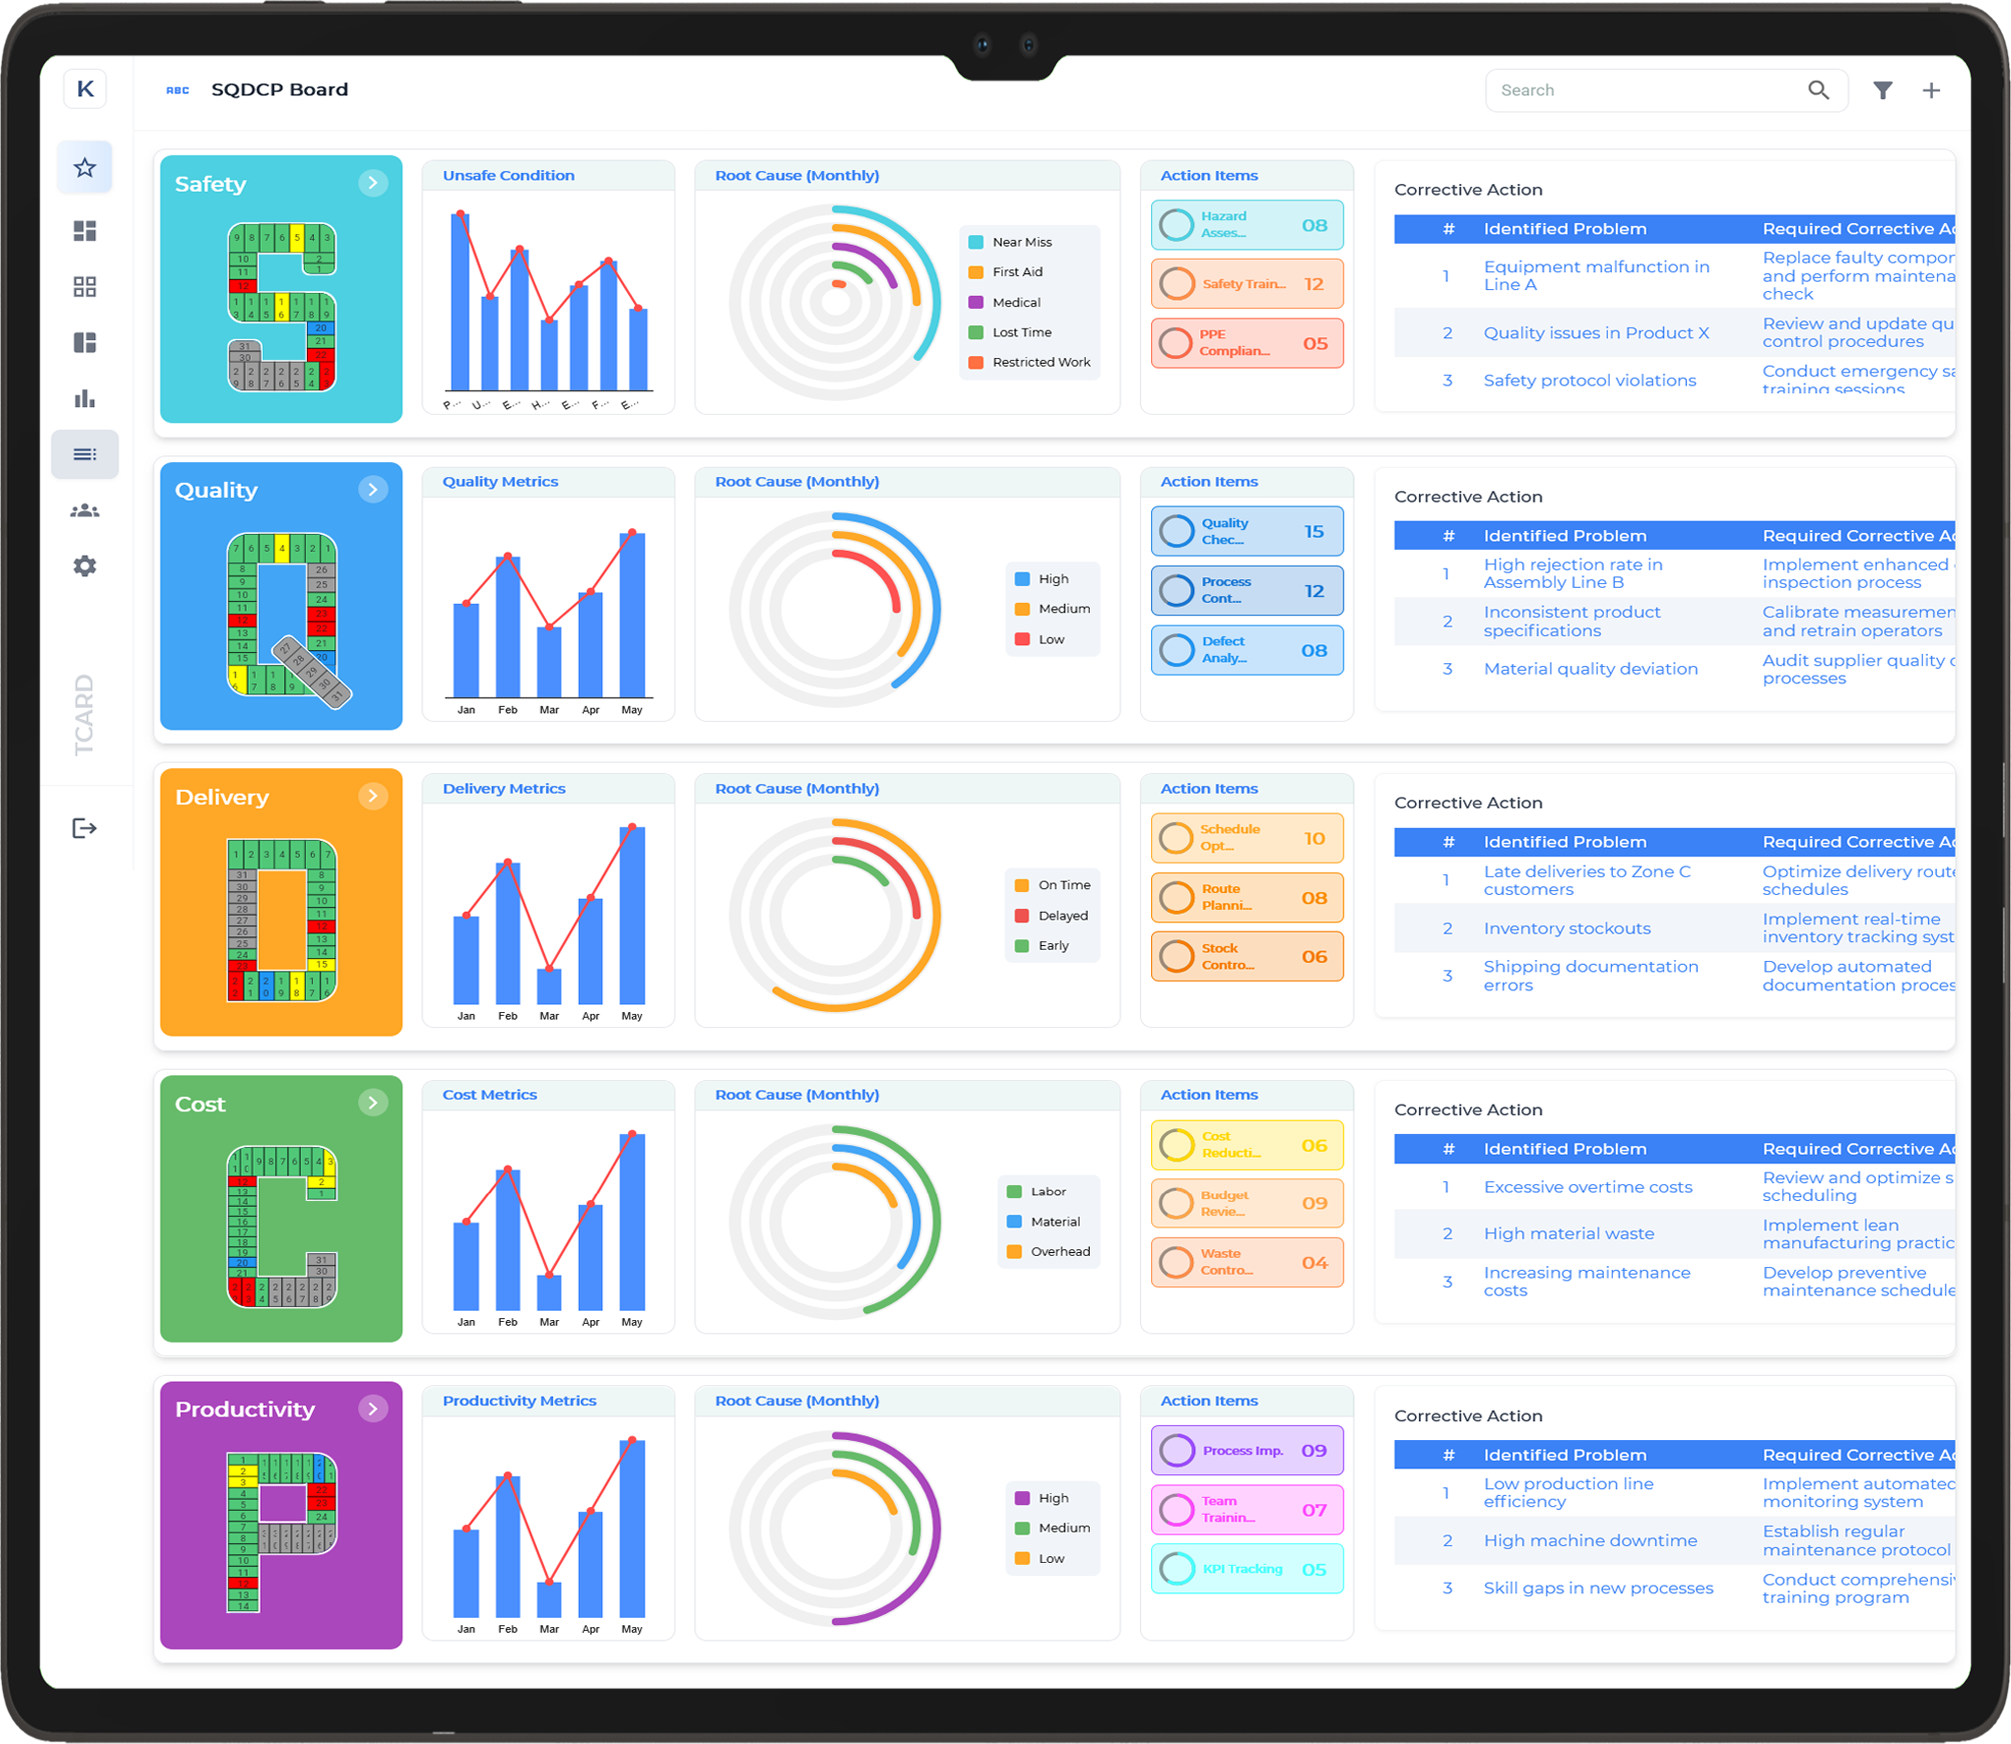
The SQDCP framework is a widely used tool in manufacturing and operations management that focuses on five critical performance areas: Safety, Quality, Delivery, Cost, and People. Each pillar represents a core aspect of business performance, helping teams measure and improve overall efficiency and effectiveness.
Safety: Protecting Your Workforce
Safety is the foundation of the SQDCP framework. It ensures that all procedures and operations prioritise the well-being of employees. By tracking safety metrics, organisations can reduce accidents, create a safer working environment, and maintain compliance with regulations.
Quality: Maintaining Standards
Quality focuses on delivering products that meet defined standards and customer expectations. Monitoring quality metrics helps identify defects early, reduce rework, and improve overall customer satisfaction. Continuous attention to quality ensures long-term reliability and brand trust.
Delivery and Cost: Optimising Performance
Delivery measures the ability to meet deadlines and customer demands, while Cost tracks efficiency in using resources. Together, these pillars help organisations balance speed and expenditure, ensuring production is both timely and cost-effective without compromising quality.
People: Engaging the Workforce
The final pillar, People, recognises the importance of workforce engagement and morale. Tracking metrics related to training, productivity, and employee satisfaction ensures that teams are motivated, skilled, and able to contribute effectively to organisational goals.
Breaking Down the Five Pillars: Safety, Quality, Delivery, Cost, and People
Safety: Protecting Your Workforce
Safety is the cornerstone of any successful operation. It focuses on creating a work environment that minimises risks and prevents accidents. Tracking safety metrics helps identify hazards early, implement effective measures, and ensure compliance with regulations. A safe workplace not only protects employees but also improves overall efficiency and reduces downtime caused by incidents.
Quality: Ensuring Consistent Standards
Quality is essential for customer satisfaction and long-term business success. This pillar focuses on delivering products and services that meet or exceed expectations. By monitoring defects, errors, and compliance with standards, organisations can maintain reliability, reduce waste, and build trust with clients. Continuous quality improvement drives better outcomes across all processes.
Delivery: Meeting Customer Demands
Delivery measures how effectively an organisation meets deadlines and fulfils customer requirements. Tracking delivery performance ensures that products and services are provided on time, reducing delays and enhancing client satisfaction. Efficient delivery systems help streamline production, optimise scheduling, and maintain a competitive edge in the market.
Cost: Optimising Resource Use
The cost pillar focuses on controlling expenses and maximising resource efficiency. Monitoring spending, production costs, and resource allocation helps organisations operate more economically. Effective cost management ensures profitability without compromising on quality or delivery performance.
People: Engaging and Empowering Teams
The People pillar recognises the value of employees in achieving organisational goals. Metrics in this area track productivity, training, and employee engagement. By investing in workforce development and motivation, companies can build a skilled, committed team that drives operational excellence and supports continuous improvement.
The Role of SQDCP Reporting in Lean Manufacturing and Continuous Improvement
Providing Clear Insights into Performance
SQDCP reporting is a critical tool in lean manufacturing as it tracks performance across Safety, Quality, Delivery, Cost, and People. By presenting this data in a structured format, organisations can quickly identify areas that need attention. Clear insights help managers and teams make informed decisions and prioritise actions that drive improvement.
Supporting Continuous Improvement
Continuous improvement relies on accurate and timely data. SQDCP reports provide a consistent overview of key metrics, allowing teams to monitor trends and measure the impact of changes. By regularly reviewing performance, organisations can implement adjustments, refine processes, and reduce waste over time, reinforcing a culture of ongoing enhancement.
Enhancing Lean Practices
Lean manufacturing focuses on efficiency, eliminating non-value-added activities, and optimising workflows. SQDCP reporting supports these goals by highlighting inefficiencies and bottlenecks across operations. With visibility into real-time data, teams can identify problem areas, streamline processes, and maintain a focus on delivering maximum value with minimal resources.
Promoting Accountability and Transparency
Reporting also ensures accountability across all levels of the organisation. When performance data is visible and easy to understand, employees know exactly where improvements are needed. This transparency fosters ownership, encourages collaboration, and aligns the workforce with the organisation’s operational and strategic objectives.
How to Collect the Right Data for an SQDCP Report
Identify Key Metrics for Each Pillar
To create an effective SQDCP report, start by defining the most relevant metrics for each pillar: Safety, Quality, Delivery, Cost, and People. Safety metrics may include incident rates or near misses, while Quality can be tracked through defect counts or compliance rates. Delivery focuses on on-time performance, Cost tracks efficiency and resource use, and People looks at engagement, training, and productivity.
Use Reliable Data Sources
Gather data from trusted sources to ensure accuracy. This can include production logs, digital tracking tools, employee feedback, and quality inspection records. Using reliable sources helps prevent errors in reporting and ensures that decisions are based on factual information rather than assumptions.
Ensure Timely Data Collection
Real-time or regularly updated data provides a clearer picture of current performance. Establish routines for collecting and updating information daily or weekly, depending on the pace of operations. Timely data allows teams to react quickly to issues and make informed adjustments before problems escalate.
Focus on Actionable Information
Collect data that drives decisions and improvements. Avoid overloading reports with irrelevant details that do not support operational goals. By focusing on actionable information, SQDCP reports become practical tools that guide teams in enhancing performance, maintaining safety, improving quality, and optimising overall efficiency.
Visualising Performance with Clear and Actionable Metrics
Turning Data into Insight
Performance data can be overwhelming if presented in raw form. Visualising key metrics makes it easier to understand trends, spot issues, and make informed decisions. Clear visual representations, such as charts, graphs, and dashboards, allow teams to quickly grasp performance levels across Safety, Quality, Delivery, Cost, and People.
Highlighting Priorities with Actionable Metrics
Not all data is equally important. Focus on actionable metrics that directly influence operational outcomes. For example, tracking defect rates in quality, safety incidents, or on-time delivery percentages provides practical insights that guide improvement initiatives. Actionable metrics help managers prioritise tasks and resources where they matter most.
Encouraging Team Engagement
Visual performance tools make data accessible to everyone on the shop floor. When teams can see progress and challenges clearly, they are more likely to take ownership of their tasks and contribute to improvements. Visibility fosters accountability and encourages proactive problem-solving among staff.
Supporting Continuous Improvement
By regularly visualising performance, organisations can track the impact of changes over time. Patterns and trends become obvious, making it easier to identify successes and areas needing attention. This approach supports continuous improvement, enabling teams to refine processes, reduce waste, and achieve higher efficiency consistently.
Step-by-Step Process for Building an SQDCP Report
Step 1: Define Key Metrics
Start by identifying the most important metrics for each SQDCP pillar: Safety, Quality, Delivery, Cost, and People. Safety metrics could include incident rates, Quality may track defect levels, Delivery focuses on on-time completion, Cost measures resource efficiency, and People monitors engagement and productivity. Clear definitions ensure consistency in reporting.
Step 2: Collect Accurate Data
Gather data from reliable sources, such as production logs, digital tracking systems, and inspection records. Ensure that data is up-to-date and representative of actual performance. Consistent and accurate data collection is essential for creating meaningful insights.
Step 3: Analyse and Categorise Data
Examine the collected data to identify trends, issues, and areas of improvement. Categorise findings under each SQDCP pillar and highlight any deviations from expected performance. This step allows you to focus on actionable insights rather than overwhelming amounts of raw data.
Step 4: Visualise Performance
Create clear visual representations such as charts, dashboards, or colour-coded indicators. Visuals make complex data easier to understand and enable teams to quickly identify priorities and areas needing attention.
Step 5: Share and Review
Distribute the report to relevant teams and review it during daily or weekly meetings. Encourage discussion and problem-solving based on the insights presented. Regular review ensures accountability and supports continuous improvement across the organisation.
How to Highlight Safety Performance in Your Report
Identify Key Safety Metrics
Begin by defining the safety metrics that matter most to your operations. This could include the number of incidents, near misses, safety inspections completed, or compliance with safety procedures. Clear and measurable metrics provide a solid foundation for your report and make it easier to track improvements over time.
Use Visual Indicators
Visual elements like colour-coded charts, graphs, or dashboards help emphasise safety performance. Green can indicate safe conditions, yellow may highlight caution areas, and red can signal urgent issues. These visual cues make it simple for teams and management to quickly assess the safety situation at a glance.
Compare Performance Against Targets
Highlight how current safety metrics compare with established targets or historical data. Showing trends, whether improving or declining, provides context and helps identify areas that need attention. This comparison makes the report more actionable and encourages proactive safety measures.
Include Actionable Insights
Beyond presenting numbers, offer insights and recommendations for improvement. Highlight patterns in incidents, suggest preventive measures, and note successful initiatives that can be scaled across operations. Actionable insights turn data into a tool for continuous improvement and safer working conditions.
Engage Your Team
Sharing the safety report with all relevant teams fosters accountability and awareness. Encourage discussions around the findings, celebrate achievements, and address concerns openly. Engaged employees are more likely to follow safety protocols, contributing to a safer and more productive workplace.
Measuring and Reporting Quality Effectively with SQDCP
Define Clear Quality Metrics
Effective quality measurement starts with identifying the most relevant metrics for your operations. Common examples include defect rates, compliance with standards, rework percentages, and customer complaints. Clearly defined metrics ensure consistency and make it easier to track performance over time.
Collect Accurate and Timely Data
Gathering reliable data is crucial for accurate reporting. Use production logs, inspection records, and digital tracking tools to capture quality information in real time. Timely data collection allows teams to spot issues early and take corrective actions before they escalate.
Visualise Quality Performance
Visual tools such as charts, graphs, and dashboards make quality data easy to understand. Highlight trends, deviations, and improvements using colour-coded indicators. This approach helps teams quickly identify problem areas and take appropriate measures to maintain high standards.
Compare Against Targets and Benchmarks
Include comparisons with internal targets or industry benchmarks to give context to your quality performance. Highlighting gaps or improvements encourages teams to take ownership and focus on continuous enhancement of processes and outputs.
Provide Actionable Insights
Beyond numbers, your report should offer recommendations for improvement. Analyse patterns, identify root causes of defects, and suggest corrective measures. Actionable insights ensure that quality reporting drives meaningful improvements and contributes to overall operational excellence.
Tracking Delivery and On-Time Performance in Reports
Define Key Delivery Metrics
Start by identifying the most important metrics for tracking delivery performance. Common measures include on-time delivery rates, lead times, and order fulfilment accuracy. Clearly defined metrics help teams focus on what matters most and provide a consistent way to evaluate performance across operations.
Collect Accurate and Timely Data
Reliable data is essential for effective reporting. Use production logs, shipment records, and digital tracking systems to gather up-to-date information. Collecting data in real time allows managers to identify potential delays early and implement corrective actions promptly.
Visualise Delivery Performance
Presenting data visually using charts, graphs, or dashboards makes it easier to understand trends and spot issues. Colour-coded indicators can highlight areas performing well versus those requiring attention, helping teams prioritise actions to maintain or improve on-time performance.
Compare Against Targets and Benchmarks
Include comparisons with internal goals or industry standards to provide context. Showing gaps between actual performance and targets highlights areas for improvement and motivates teams to take proactive measures to meet delivery expectations consistently.
Provide Actionable Insights
Reports should go beyond presenting numbers by offering recommendations for improvement. Analyse trends, identify recurring issues, and suggest solutions to enhance delivery reliability. Actionable insights ensure that reporting drives practical changes and supports overall operational efficiency.
Including Cost Control and Efficiency Measures in SQDCP
Identify Key Cost Metrics
Effective cost management begins with defining the most relevant metrics for your operations. Common measures include production costs, resource utilisation, waste levels, and energy consumption. Clear cost metrics provide a foundation for tracking efficiency and identifying areas for improvement.
Collect Accurate Data
Gather data from reliable sources such as financial records, production logs, and digital monitoring systems. Accurate and timely data ensures that reports reflect real operational performance, allowing managers to make informed decisions and prevent unnecessary spending.
Visualise Efficiency and Cost Performance
Use charts, graphs, or dashboards to display cost and efficiency metrics clearly. Visual tools make it easier to spot trends, variations, and areas requiring immediate attention. Colour-coded indicators can help highlight high-cost areas or inefficiencies that need corrective action.
Compare Against Targets and Benchmarks
Include comparisons with internal budgets, past performance, or industry benchmarks. This contextual view highlights whether costs are under control and whether efficiency targets are being met. It also helps teams focus on areas that offer the most significant potential savings.
Provide Actionable Recommendations
Beyond presenting numbers, your SQDCP report should suggest ways to improve cost efficiency. Identify bottlenecks, optimise resource allocation, and recommend process adjustments. Actionable insights turn cost and efficiency data into practical steps that enhance overall operational performance.
Capturing Morale and People-Related Metrics in Reporting
Define Key People Metrics
Morale and people-related metrics are essential for understanding workforce engagement and productivity. Key indicators may include employee satisfaction, training completion, attendance, turnover rates, and productivity levels. Clearly defined metrics ensure that reports provide meaningful insights into team performance.
Collect Data Through Multiple Channels
Gather information from surveys, performance reviews, attendance records, and feedback sessions. Using a combination of qualitative and quantitative data provides a complete view of employee morale and engagement. Consistent data collection allows for accurate tracking over time and helps identify trends.
Visualise People Metrics Effectively
Display data using charts, dashboards, or graphs to make it easily understandable for all levels of the organisation. Visual tools help highlight areas of high engagement or potential concern, allowing managers to take timely action. Colour-coded indicators can emphasise positive trends or flag issues needing attention.
Compare Against Benchmarks and Goals
Include comparisons with previous periods, internal targets, or industry benchmarks. This contextual view helps assess whether morale and engagement levels are improving, stable, or declining. Benchmarking ensures that efforts to support employees are aligned with organisational objectives.
Provide Actionable Insights
Reports should go beyond presenting numbers by offering recommendations to enhance morale and engagement. Identify training needs, recognise achievements, and suggest initiatives to improve workplace satisfaction. Actionable insights help create a motivated, productive, and committed workforce.
How to Identify Trends and Spot Issues from SQDCP Reports
Review Metrics Regularly
Consistent review of Safety, Quality, Delivery, Cost, and People metrics is key to spotting trends. Regular monitoring helps highlight patterns over days, weeks, or months, allowing teams to understand whether performance is improving, stable, or declining.
Use Visualisation Tools
Charts, graphs, and dashboards make it easier to see patterns in the data. Colour-coded indicators can quickly highlight areas of concern, such as rising defect rates, missed delivery targets, or increasing costs. Visual representation helps teams interpret data quickly and take action.
Compare Against Benchmarks
Compare current performance against targets, past results, or industry standards. Deviations from benchmarks can reveal potential issues before they escalate. This comparison provides context and makes it easier to prioritise corrective measures effectively.
Analyse Patterns and Variations
Look for recurring trends or sudden changes in metrics. For example, repeated safety incidents in a specific area or recurring delivery delays can indicate underlying problems. Identifying patterns allows teams to investigate root causes and implement preventive measures.
Provide Actionable Insights
Beyond highlighting issues, reports should offer actionable recommendations. Suggest process improvements, training needs, or resource adjustments to address trends. Clear insights help teams make informed decisions and drive continuous improvement across all aspects of operations.
Turning Report Findings into Actionable Improvement Plans
Analyse the Data Thoroughly
Start by reviewing the report findings carefully to understand performance trends across Safety, Quality, Delivery, Cost, and People. Identify areas where targets are not being met or where metrics show recurring issues. This detailed analysis forms the basis for targeted improvement actions.
Prioritise Key Issues
Not all findings require immediate action. Focus on the most critical areas that impact operational efficiency, safety, or customer satisfaction. Prioritising ensures resources are allocated effectively and that the most pressing issues are addressed first.
Develop Clear Improvement Actions
Create specific, measurable, and realistic actions to address each identified issue. For example, if defect rates are high, the plan might include enhanced quality checks, employee training, or process adjustments. Clearly defined actions ensure accountability and make it easier to track progress.
Assign Ownership and Deadlines
Assign responsibilities to specific team members and set clear deadlines for each action. Accountability ensures that tasks are completed on time and that everyone understands their role in the improvement process. Regular follow-ups help maintain momentum.
Monitor Progress and Adjust Plans
Use ongoing reporting and visual tracking tools to monitor the effectiveness of implemented actions. If results are not improving as expected, adjust the plan or introduce additional measures. Continuous monitoring ensures that improvement plans remain relevant and impactful.
Using SQDCP Reports in Daily and Weekly Team Meetings
Prepare Reports in Advance
Before any meeting, ensure that SQDCP reports are prepared and updated with the latest data. This includes metrics for Safety, Quality, Delivery, Cost, and People. Having accurate and current information ready helps streamline discussions and makes meetings more productive.
Use Reports to Set Meeting Agendas
Base your meeting agenda on the key findings in the SQDCP reports. Highlight areas that require attention, celebrate achievements, and discuss trends. Using the report to structure the agenda ensures that discussions remain focused on operational priorities and actionable insights.
Visualise Metrics for Clarity
Present data using charts, graphs, or dashboards during meetings. Visual tools make it easier for all team members to understand complex information quickly. Colour-coded indicators can highlight performance levels, making it simple to identify strengths and areas needing improvement.
Encourage Team Engagement
Involve team members in reviewing the report findings. Encourage questions, feedback, and suggestions for improvement. Engaging the team fosters ownership and accountability, ensuring that everyone contributes to problem-solving and process enhancements.
Track Actions and Follow-Up
Use the reports to assign tasks and monitor progress. Document decisions and action items during meetings, and review them in subsequent sessions. Regular follow-up ensures that improvement plans are implemented effectively and that performance trends are continually addressed.
Best Practices for Creating SQDCP Reports That Drive Accountability
Define Clear and Relevant Metrics
Start by identifying the key metrics for each SQDCP pillar: Safety, Quality, Delivery, Cost, and People. Ensure that these metrics are specific, measurable, and relevant to your team’s goals. Clear metrics provide a solid foundation for accountability and help teams focus on what truly matters.
Collect Accurate and Timely Data
Reliable reporting depends on accurate data collection. Use production logs, digital tools, and inspection records to gather up-to-date information. Timely data ensures that reports reflect current performance, enabling teams to make informed decisions and address issues promptly.
Visualise Performance Effectively
Use charts, graphs, and dashboards to present data in an easy-to-understand format. Colour-coded indicators can highlight areas performing well and those that need improvement. Effective visualisation helps teams quickly grasp priorities and fosters transparency.
Highlight Actionable Insights
Beyond presenting numbers, provide recommendations for improvement. Analyse patterns, identify root causes, and suggest corrective actions. Actionable insights turn data into practical steps that drive better performance and accountability.
Review and Follow-Up Regularly
Incorporate SQDCP reports into daily or weekly meetings to track progress. Assign ownership for specific tasks and monitor completion. Regular review ensures that accountability is maintained and that teams remain focused on continuous improvement.