What Is Balanced Scorecard Software and Its Role in Lean Visual Management
Understanding Balanced Scorecard Software
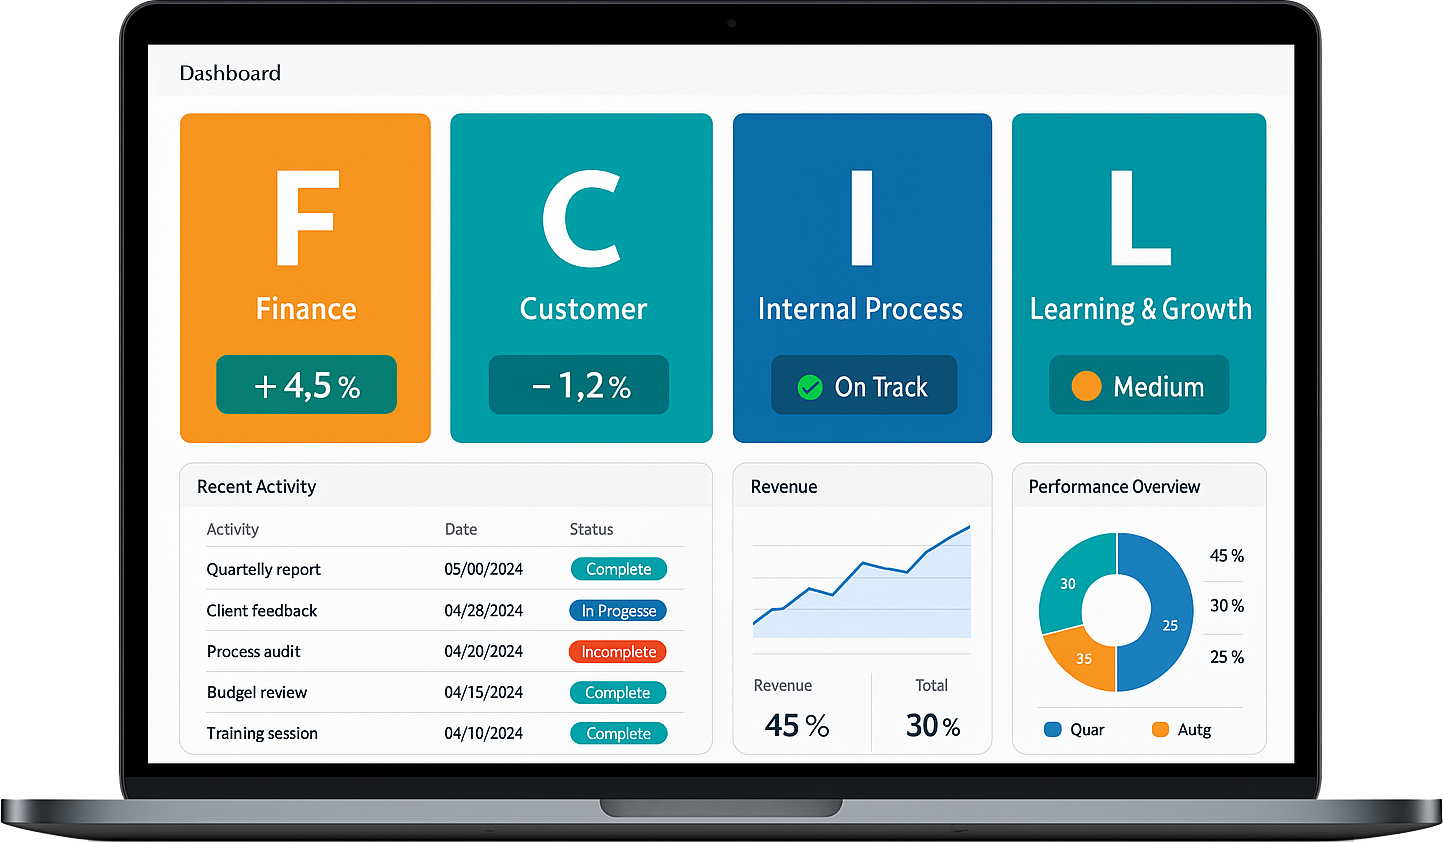
Balanced scorecard software is a digital tool designed to help organisations translate strategic objectives into measurable performance indicators. By tracking financial, customer, internal process, and learning and growth metrics, the software provides a structured framework for monitoring organisational performance. This ensures that every department and team understands their contribution to the overall strategy and can act in alignment with strategic goals.
Integrating with Lean Visual Management
Lean visual management emphasises transparency, efficiency, and real-time communication of performance information. Balanced scorecard software complements this approach by visually displaying key metrics and KPIs in dashboards, charts, and alerts. Teams can quickly see performance gaps, progress toward goals, and areas needing improvement, reducing delays in decision-making and enhancing operational efficiency.
Supporting Continuous Improvement
The combination of Balanced Scorecard Software with lean visual management encourages a culture of continuous improvement. Employees at all levels can monitor real-time performance, identify bottlenecks, and implement corrective actions swiftly. This integration strengthens accountability, improves responsiveness, and aligns operational practices with organisational strategy, creating a more agile and high-performing organisation.
Linking Strategic Objectives to Lean Visual Management Practices
Making Objectives Actionable
Linking strategic objectives to lean visual management ensures that high-level goals are translated into actionable metrics at the operational level. By identifying relevant KPIs and mapping them to each objective, organisations can track progress clearly and consistently. This makes strategy more tangible and easier for employees to understand and execute.
Enhancing Visibility and Accountability
Lean visual management relies on making performance visible across teams and departments. Connecting objectives to visual metrics ensures that employees can see the direct impact of their work on organisational goals. Transparent tracking fosters accountability and encourages teams to take ownership of their performance.
Driving Continuous Alignment
When strategic objectives are linked to visual KPIs, performance data continuously informs decisions and actions. Managers can identify misalignment early, adjust priorities, and support employees in achieving desired outcomes. This ongoing feedback loop strengthens the connection between strategy and daily operations, enhancing overall organisational performance.
Using Balanced Scorecards to Drive Organisational Growth
Aligning Strategy and Execution
Balanced scorecards drive growth by linking strategic objectives with measurable actions. Organisations can track critical financial, operational, and customer-related metrics to ensure that efforts contribute directly to long-term goals. This alignment reduces wasted resources and maximises the impact of initiatives.
Fostering Data-Driven Decision-Making
By centralising performance metrics, balanced scorecards enable leaders to make informed decisions based on real data. Trends, performance gaps, and opportunities become visible, supporting decisions that enhance growth, efficiency, and market competitiveness. Employees at all levels also benefit from clarity and guidance.
Encouraging Accountability and Improvement
Scorecards promote accountability by assigning clear ownership of KPIs and targets. Teams can monitor progress and identify areas for improvement, while leaders can provide support and recognition where appropriate. This structured approach encourages continuous improvement, innovation, and sustainable growth across the organisation.
Visualising KPIs for Real-Time Performance Tracking
Understanding Real-Time Insights
Visualising KPIs allows organisations to track performance in real time, making it easier to detect trends, gaps, and emerging issues quickly. Dashboards, charts, and graphical indicators present data in a clear and intuitive way, ensuring that employees and managers can interpret metrics accurately without extensive analysis.
Improving Responsiveness and Decision-Making
Real-time KPI visualisation supports proactive management by highlighting issues as they occur. Teams can take immediate corrective actions, reducing delays and avoiding negative impacts on performance. This visibility ensures that decisions are timely, informed, and aligned with strategic objectives.
Enhancing Engagement and Collaboration
When KPIs are visually displayed and easily accessible, employees at all levels become more engaged with performance goals. Shared visibility encourages collaboration across teams, fosters accountability, and ensures that everyone understands how their contributions impact the organisation’s success. This creates a performance-oriented culture focused on continuous improvement.
Aligning Teams Around Key Business Metrics with Scorecard Software
Connecting Teams to Organisational Goals
Balanced Scorecard Software aligns teams by clearly linking their tasks and responsibilities to key business metrics. Employees can see how their daily work influences strategic objectives, ensuring that efforts are focused on activities that drive results. This shared understanding reduces confusion and promotes coordinated action across departments.
Facilitating Communication and Collaboration
By providing a centralised view of performance metrics, scorecard software enhances communication between teams and leadership. Shared dashboards and KPIs ensure that everyone has access to the same information, fostering collaboration, transparency, and collective problem-solving when targets are not being met.
Driving Accountability and Performance
Aligning teams around measurable metrics encourages accountability and responsibility for outcomes. Team members understand their contribution to overall performance and are motivated to meet targets. Leaders can monitor progress, provide support where needed, and recognise achievements, creating a high-performance culture that supports organisational growth and strategic success.
Supporting Continuous Improvement (Kaizen) Through Visual Insights
Understanding Kaizen and Continuous Improvement
Continuous improvement, often referred to as Kaizen, emphasises small, incremental changes that enhance efficiency, quality, and overall organisational performance. Balanced scorecard software supports this approach by providing visual insights that help teams identify areas for improvement in real time. By consistently monitoring performance metrics, employees can see where processes are falling short and where changes can deliver meaningful results.
Leveraging Visual Insights for Actionable Feedback
Visual dashboards translate complex data into intuitive charts, graphs, and indicators. Teams can quickly understand trends, variances, and gaps without needing detailed reports. These insights empower managers and employees to act swiftly, adjusting processes and implementing corrective measures before minor issues become significant problems. This responsiveness is a cornerstone of Kaizen philosophy.
Embedding Continuous Improvement into Daily Operations
When visual insights are consistently used, continuous improvement becomes part of daily routines. Teams can monitor progress against targets, identify inefficiencies, and celebrate small wins. This ongoing feedback loop encourages a proactive mindset, enhances accountability, and strengthens a culture focused on operational excellence, innovation, and sustained performance growth.
Enhancing Accountability Across Departments Using Scorecards
Establishing Clear Responsibilities
Balanced scorecards enhance accountability by defining clear responsibilities for each department. When KPIs and targets are linked directly to departmental objectives, employees understand their role in achieving organisational goals. This clarity ensures everyone knows what is expected and how their contributions affect overall performance.
Monitoring Progress Transparently
Scorecards provide a visual and centralised view of departmental performance. Leaders and teams can track progress against objectives and identify areas that require attention. This transparency encourages teams to take ownership of outcomes, ensures alignment with organisational priorities, and reduces misunderstandings or conflicts over performance expectations.
Fostering a Performance-Oriented Culture
Regular reviews and updates of scorecard data reinforce accountability. Employees can see the direct impact of their actions, receive timely feedback, and adjust behaviour accordingly. This structured approach builds a culture where continuous improvement, responsibility, and collaboration are standard practice, improving overall organisational effectiveness.
Integrating Financial and Non-Financial Metrics for Better Decision-Making
Balancing Multiple Perspectives
Effective decision-making requires insight into both financial and non-financial performance. Balanced scorecard software integrates metrics such as revenue, costs, productivity, customer satisfaction, and employee engagement into a single view. This holistic approach ensures that decisions are informed by a comprehensive understanding of organisational performance rather than just financial results.
Connecting Strategy to Operational Outcomes
Linking financial and non-financial metrics to strategic objectives provides context for performance analysis. Leaders can see how operational actions influence financial outcomes and vice versa. This integration helps highlight areas where adjustments are needed and ensures that all business functions contribute meaningfully to organisational success.
Driving Informed and Timely Decisions
With both financial and non-financial data available in real time, managers can make faster, more informed decisions. They can prioritise initiatives, allocate resources effectively, and identify risks or opportunities early. This data-driven approach strengthens overall governance, supports accountability, and enhances the organisation’s ability to achieve strategic goals.
How Scorecard Software Helps Identify Bottlenecks Quickly
Visualising Workflow and Process Performance
Scorecard software enables organisations to visualise workflows and monitor performance metrics for each process. Dashboards display KPIs such as cycle times, throughput, and error rates, making it easy to pinpoint areas where work slows down or efficiency drops. This visual clarity ensures that bottlenecks are identified promptly.
Analysing Trends and Variances
By tracking performance over time, scorecards highlight patterns and variances that indicate potential bottlenecks. For example, repeated delays in one process or department can be flagged for further investigation. Teams can use this data to prioritise improvement initiatives and allocate resources where they will have the greatest impact.
Supporting Proactive Problem-Solving
Once bottlenecks are identified, scorecard software supports proactive solutions. Teams can implement corrective actions, monitor the effects of changes, and continue refining processes. This continuous feedback loop improves operational efficiency, reduces delays, and strengthens the organisation’s ability to meet targets and strategic objectives consistently.
Customising Dashboards to Suit Lean Operational Requirements
Aligning Dashboards with Key Metrics
Customised dashboards allow organisations to focus on the most critical metrics for lean operations. By selecting KPIs that reflect efficiency, quality, cycle time, and resource utilisation, teams can monitor performance without distractions from irrelevant data. This alignment ensures that dashboards drive actionable insights directly linked to operational goals.
Enhancing Visual Clarity and Accessibility
Lean operations emphasise simplicity and clarity. Customised dashboards present performance data in a visually intuitive manner, using charts, graphs, and traffic-light indicators to communicate trends quickly. Teams can access dashboards easily, interpret results at a glance, and make timely decisions to maintain smooth operations.
Supporting Continuous Improvement and Responsiveness
Custom dashboards enable organisations to monitor process performance continuously and adapt quickly to changing conditions. By providing clear visibility into key metrics, employees can identify inefficiencies, implement corrective measures, and track improvements over time. This approach strengthens lean practices, accountability, and operational agility.
Improving Employee Engagement Through Transparent Performance Metrics
Understanding the Importance of Engagement
Employee engagement is critical for achieving organisational goals and sustaining high performance. Transparent performance metrics provide clarity on expectations and outcomes, helping employees understand how their work contributes to strategic objectives. When performance is measured clearly and communicated openly, engagement increases as employees see the value of their efforts.
Using Metrics to Motivate and Guide Employees
Transparent performance metrics give employees real-time insight into their own and their team’s performance. This enables them to self-assess, recognise achievements, and identify areas for improvement. Clear visibility of targets and progress fosters a sense of ownership and motivates employees to consistently perform at their best, knowing their contributions are valued and measurable.
Enhancing Communication and Collaboration
When metrics are visible and easily accessible, teams can discuss performance openly and collaborate more effectively. Shared understanding of objectives reduces confusion, aligns efforts, and supports a culture of accountability. By linking performance metrics to both team and organisational goals, employees feel connected to the bigger picture, which strengthens engagement and drives consistent improvement.
Tracking Progress Against Strategic Goals with Visual Scorecards
Turning Strategy into Actionable Metrics
Visual scorecards transform strategic goals into measurable and trackable KPIs. Organisations can map high-level objectives to specific indicators across departments and teams, ensuring that everyone understands how their actions influence success. This clarity improves focus and ensures that daily activities are aligned with organisational priorities.
Monitoring Performance in Real Time
Dashboards and visual scorecards provide instant access to key performance information. Managers and teams can see progress against strategic goals, identify areas falling behind, and take corrective action quickly. This real-time monitoring reduces delays in response and keeps the organisation agile and focused on results.
Supporting Strategic Alignment and Accountability
Tracking performance visually promotes accountability at all levels. Employees understand how their work contributes to broader objectives, and managers can provide timely guidance and feedback. The integration of visual metrics ensures that strategy and execution remain closely aligned, fostering a culture focused on continuous improvement and organisational success.
Bridging Strategy and Execution Using Balanced Scorecard Software
Linking Goals to Measurable Actions
Balanced scorecard software bridges the gap between strategy and execution by translating high-level objectives into measurable actions. KPIs track progress, providing a clear connection between strategic intent and operational performance. This ensures that all organisational activities contribute meaningfully to strategic priorities.
Enhancing Visibility Across Teams
The software provides a centralised platform for monitoring progress across departments. Teams can view shared dashboards that display key metrics, allowing leaders and employees to understand performance trends, spot challenges early, and coordinate efforts effectively. This visibility strengthens collaboration and alignment with strategy.
Driving Accountability and Continuous Improvement
Scorecards assign ownership of specific KPIs and objectives, ensuring accountability at all levels. Regular review of performance data supports continuous improvement by highlighting areas for corrective action, celebrating achievements, and reinforcing behaviours that contribute to success. Over time, this approach strengthens execution and strategic alignment.
Measuring ROI and Business Impact from Lean Visual Management
Understanding the Value of Investment
Measuring ROI in lean visual management involves evaluating both tangible and intangible benefits. Tangible benefits may include cost reduction, productivity gains, and improved process efficiency, while intangible benefits include better alignment, employee engagement, and enhanced decision-making. By assessing these factors, organisations can determine the value of implementing visual management practices.
Tracking Impact Through Performance Metrics
Balanced scorecards integrated with lean visual management allow organisations to track progress using clear KPIs. Financial and operational indicators provide insight into the effectiveness of initiatives, helping leaders quantify improvements and evaluate the impact of changes. This data-driven approach supports evidence-based decision-making and justifies further investment.
Supporting Continuous Improvement and Growth
By measuring ROI regularly, organisations can adjust processes, allocate resources effectively, and focus on areas that deliver the greatest value. Continuous evaluation ensures that lean visual management practices remain aligned with strategic objectives and contribute to sustainable organisational growth over time.
Building a High-Performance, Growth-Oriented Lean Culture
Aligning Teams with Organisational Strategy
A lean culture focuses on efficiency, continuous improvement, and performance. Balanced scorecards help align teams with strategic objectives, ensuring that daily operations contribute directly to organisational growth. Clear KPIs and visual metrics foster understanding of expectations and outcomes, creating a culture where everyone works toward common goals.
Promoting Engagement and Accountability
Transparency in performance measurement encourages engagement and accountability. Employees can see the impact of their work, identify improvement areas, and take ownership of outcomes. Regular feedback and visual performance dashboards reinforce behaviours that drive results and support a high-performance mindset.
Embedding Continuous Improvement Practices
Lean culture thrives on ongoing learning and improvement. By using scorecards to monitor performance continuously, organisations can identify inefficiencies, implement changes, and measure their impact. This reinforces a growth-oriented environment where teams are motivated to innovate, optimise processes, and sustain high performance consistently.