What Does an SQDCP Board Measure and Why Does It Matter?
Breaking Down the SQDCP Framework
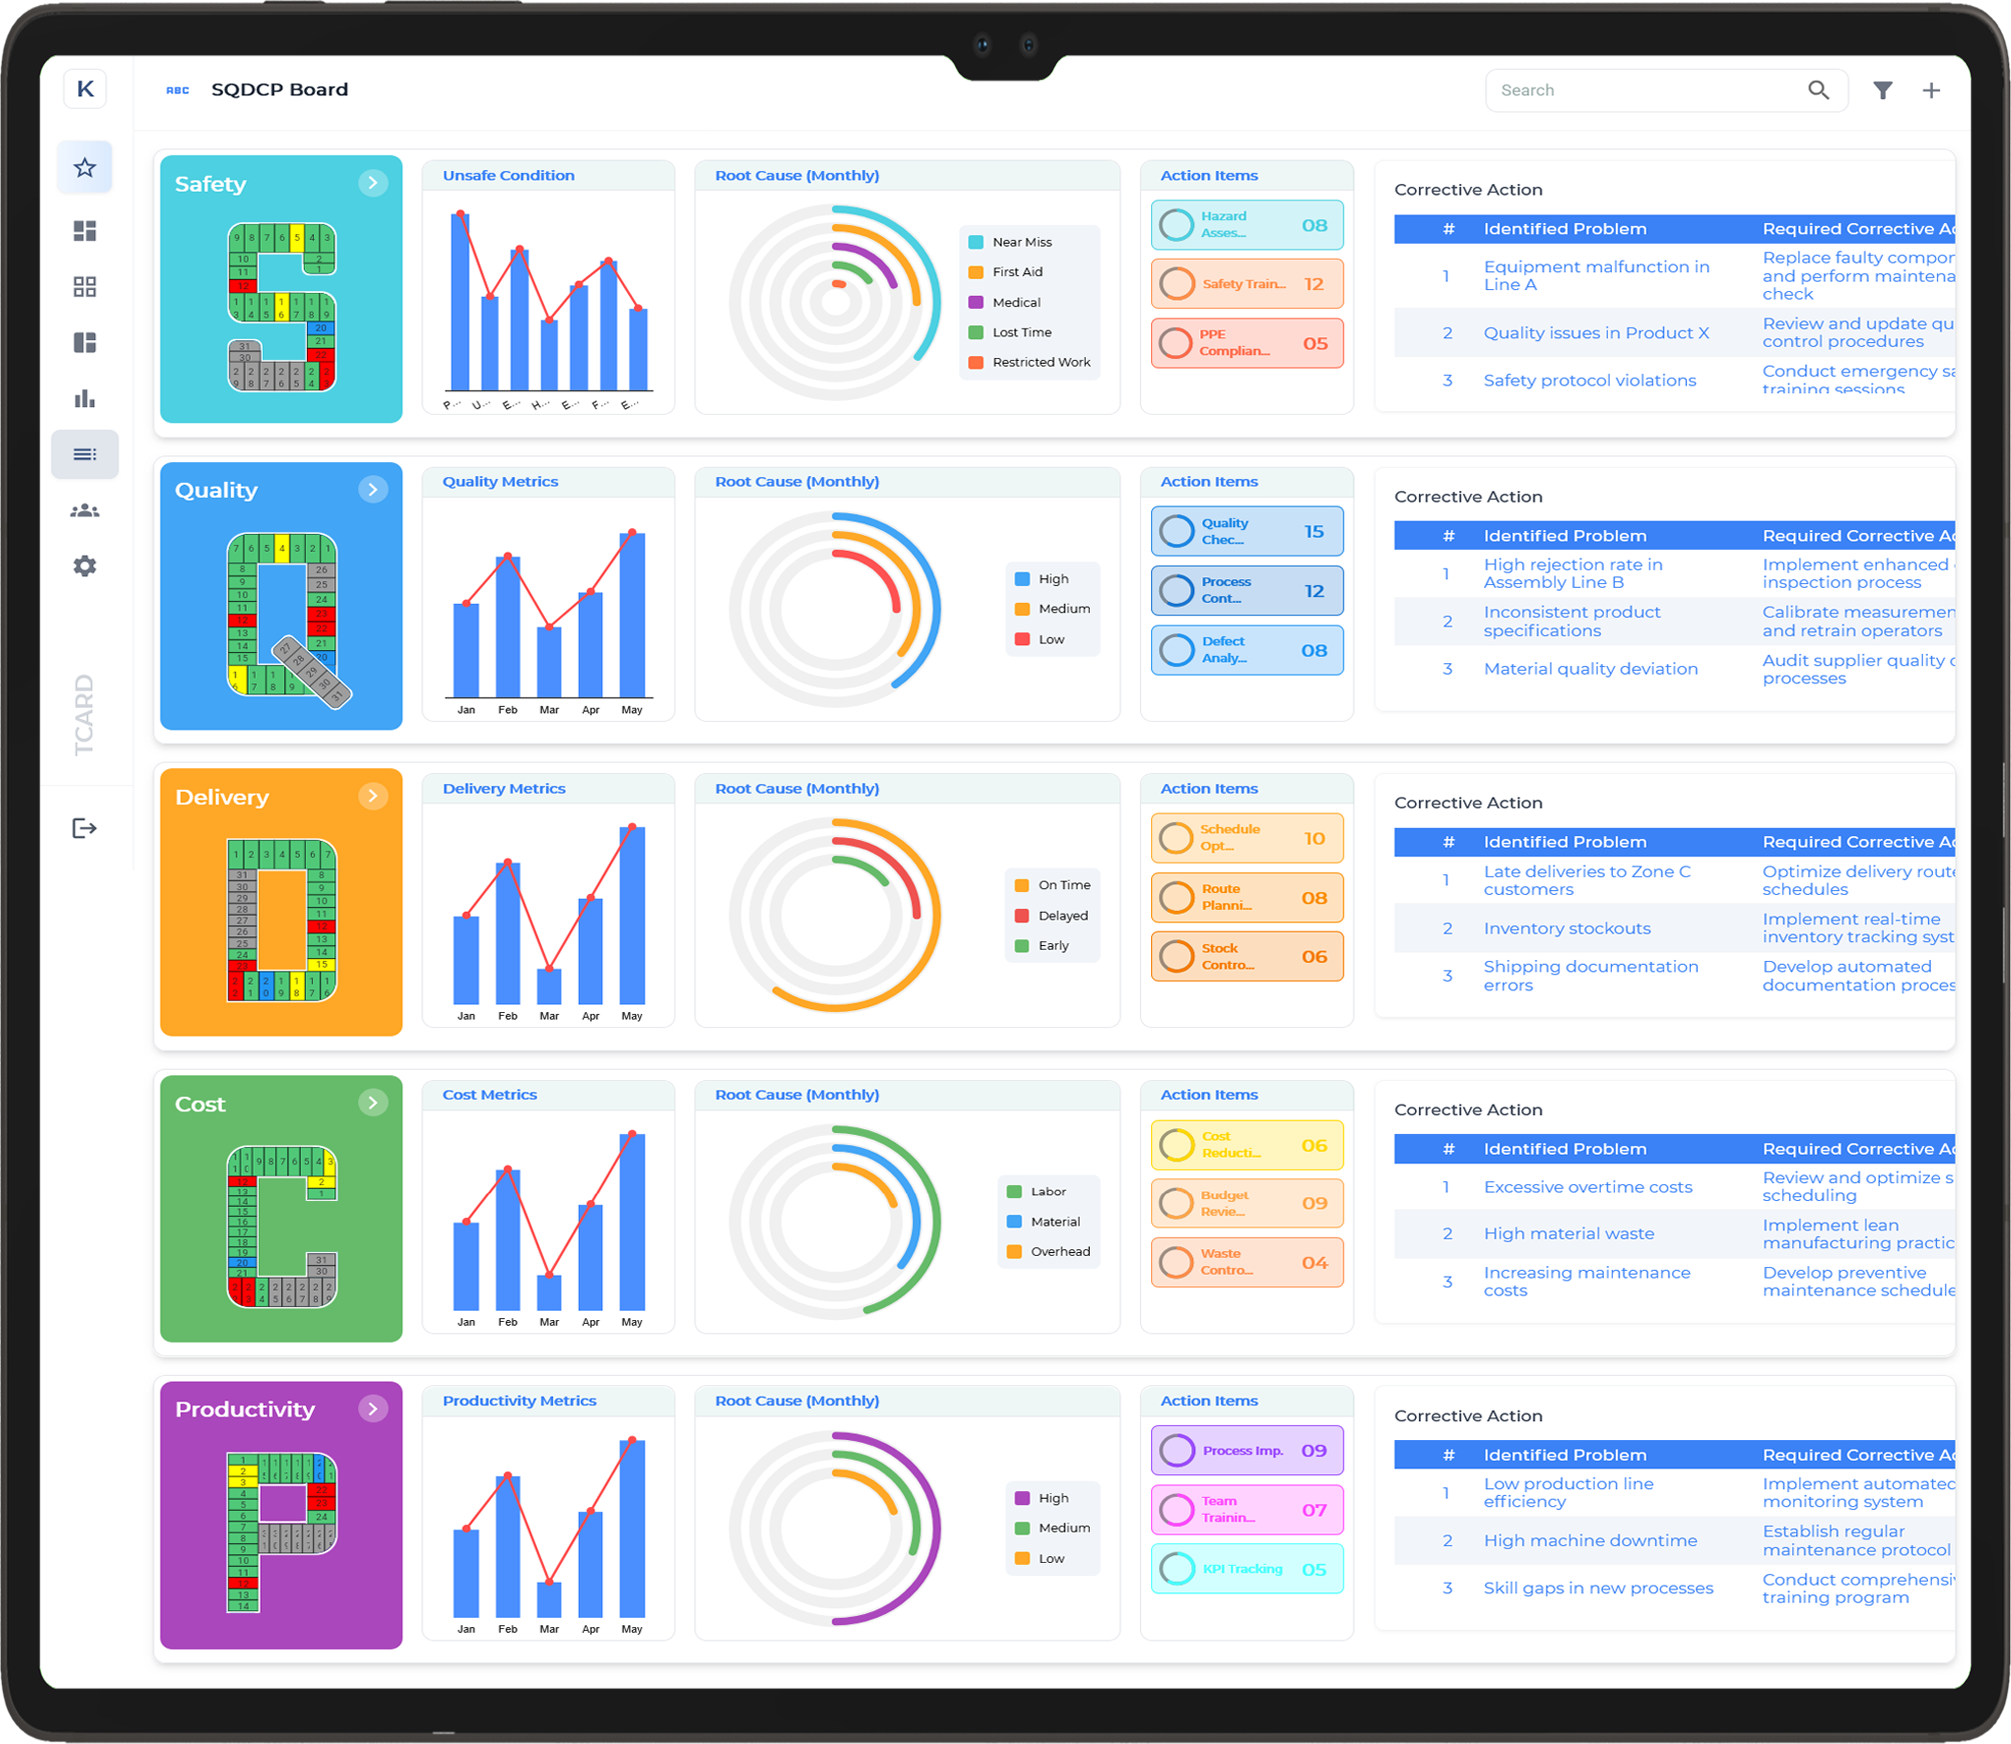
An SQDCP board tracks five key categories—Safety, Quality, Delivery, Cost, and People. Each area is essential for daily performance and long-term improvement. The board is updated regularly to give teams a clear, real-time view of how well they are doing in each of these areas. This helps drive focused action, accountability, and better decision-making.
Safety and Quality First
Safety measures focus on preventing accidents and creating a secure working environment. Common indicators include near-misses, incident reports, and safety checks. Quality tracks product standards and aims to reduce defects and rework. When safety and quality are under control, teams can work more efficiently and with confidence.
Delivery and Cost Management
Delivery metrics ensure that products or services are completed on time. Missed deadlines are easy to spot on the board, helping teams take early action. Cost focuses on efficiency—tracking material use, labour, and waste. Keeping costs in check improves profitability without cutting corners.
People Engagement and Morale
The People section measures employee morale, involvement, and attendance. High morale supports better teamwork and long-term success. By tracking People alongside other metrics, the board gives a complete view of performance and highlights the link between engaged teams and operational results.
Step-by-Step: How to Collect Daily Data from Your SQDCP Board
Step 1: Assign Clear Responsibilities
Start by making sure each team member knows who is responsible for updating each section of the SQDCP board—Safety, Quality, Delivery, Cost, and People. This avoids confusion and ensures that data is recorded consistently every day. Assign roles during a shift meeting or daily briefing for clarity.
Step 2: Observe and Record Performance
Throughout the shift, team members should monitor performance indicators in their assigned areas. For example, note down safety checks, number of quality issues, or delivery progress. Use simple and visible formats like ticks, numbers, or colour codes so the board is easy to read at a glance.
Step 3: Update the Board in Real Time
Whenever possible, data should be added to the board during the shift rather than at the end. Real-time updates help the team spot issues early and respond quickly. Place the board in a visible area so everyone can access and contribute to it easily.
Step 4: Review Data as a Team
Hold a short stand-up meeting at the end of the shift to review the data collected. Discuss any red flags, trends, or actions needed. This encourages team engagement and makes the board a living tool for daily improvement, not just a display.
Step 5: Record and Store for Tracking
Take a photo or transfer the day’s results into a log or digital tracker. This creates a record of performance over time, helping identify patterns and drive continuous improvement through weekly or monthly reviews.
Analysing Trends in Safety, Quality, Delivery, Cost, and People Metrics
Why Trend Analysis Matters in Daily Operations
Monitoring trends across Safety, Quality, Delivery, Cost, and People helps teams move beyond short-term fixes and focus on long-term improvements. Analysing these metrics daily and weekly allows you to spot repeating issues, evaluate performance changes, and make smarter decisions based on actual data.
Identifying Patterns in Safety and Quality
If safety incidents or near-misses are rising, it may signal the need for updated training or better hazard awareness. Similarly, tracking quality issues such as rework, defects, or complaints reveals weaknesses in process or materials. Analysing trends helps pinpoint where improvements should begin.
Tracking Delivery and Cost Efficiency
When delivery times are consistently missed, it may highlight supply chain delays, scheduling gaps, or equipment issues. Likewise, cost trends—such as rising waste or overtime hours—can signal inefficiencies. Spotting these trends early helps control expenses and improve workflow reliability.
Monitoring Morale and Engagement Over Time
Changes in People metrics, like attendance, turnover, or feedback scores, often reflect deeper team dynamics. A drop in morale might affect productivity and teamwork. Analysing these shifts over time supports more proactive management and a healthier work environment.
Turning Insights into Action
Trend analysis allows teams to move from data collection to action. By reviewing these patterns regularly, leaders can plan targeted improvements, track the results, and continuously adjust for better performance in each category.
How to Use Colour Indicators and Charts for Quick Visual Analysis
Why Visual Tools Improve Understanding
Colour indicators and simple charts make SQDCP board data easier to understand at a glance. They help teams quickly identify performance trends, spot problems, and focus on areas that need attention. By turning numbers into visuals, everyone on the shop floor can engage with the data—regardless of their role or experience.
Using Colour Indicators Effectively
The most common method is using traffic light colours: green for on target, amber for warning, and red for off target. Each category—Safety, Quality, Delivery, Cost, and People—can be marked daily using these colours. This system provides a clear and instant view of how each area is performing without needing to read detailed figures.
Simple Charts for Daily Trends
Bar charts or line graphs can be added to the board to track progress over time. These visuals show patterns, such as improvements or repeated issues, and help teams understand whether performance is moving in the right direction. Charts are especially helpful for weekly reviews or continuous improvement discussions.
Encouraging Team Engagement Through Visuals
Visual tools are not just for managers—they encourage all team members to take part. When everyone can see where things stand, it supports better communication and shared problem-solving. Clear visuals turn the SQDCP board into a tool that drives daily action and supports ongoing success.
Spotting Root Causes Behind Repeated Issues on Your SQDCP Board
Looking Beyond the Surface
When the same problems keep appearing on your SQDCP board—whether in Safety, Quality, Delivery, Cost, or People—it’s a sign that a deeper issue exists. Rather than treating the symptoms, it’s important to dig into the root cause. This helps prevent the same issue from coming back and supports long-term improvement.
Identifying Patterns Through Daily Data
Repeated red or amber indicators in a particular category are a strong signal. For example, if late deliveries are logged every week, or quality scores regularly fall below target, you can begin looking for patterns. Note when the issues occur, which shifts are affected, or if a certain machine or process is involved.
Asking the Right Questions
Start by asking simple questions such as: “Why did this happen?” Repeat the question several times to get past the obvious answer. This helps uncover hidden factors, such as unclear instructions, outdated procedures, or lack of training. Team discussions during daily reviews can reveal useful insights from the people closest to the work.
Using Visual Tools to Support Root Cause Analysis
Charts, colour trends, and tracking sheets on the SQDCP board make it easier to spot long-term issues. Visuals help teams focus their investigations and stay aligned during problem-solving. Highlighting repeated problems and exploring their root causes is key to real, lasting improvement.
Using A3 Reports or 5 Whys to Investigate SQDCP Findings
Turning Daily Issues into Improvement Opportunities
When issues appear repeatedly on your SQDCP board—whether related to Safety, Quality, Delivery, Cost, or People—they shouldn't be ignored. Tools like A3 reports and the 5 Whys method help teams understand the root cause behind the problem and take meaningful action. These tools are simple, structured, and ideal for frontline problem-solving.
Applying the 5 Whys Method
The 5 Whys approach involves asking “Why?” multiple times—usually five—to dig deeper into the cause of an issue. For example, if delivery is consistently late, ask why each delay happened. The first answer may point to a scheduling problem, but further questions might reveal a lack of training or equipment availability. This method prevents quick fixes and encourages lasting solutions.
Using A3 Reports for Structured Problem Solving
An A3 report provides a step-by-step format for investigating an issue found on the SQDCP board. It includes a summary of the problem, root cause analysis, action plans, and follow-up steps. The format keeps everyone aligned and ensures improvements are well documented and communicated. Teams can display A3 updates next to the board for full visibility.
Bringing Problem Solving Into Daily Routine
Integrating these tools with your SQDCP board makes continuous improvement part of daily work. Instead of just recording problems, teams begin solving them using data and collaboration. This creates a culture where improvement becomes part of the routine—not a separate project.
Creating a Daily or Weekly Summary Report Based on Board Data
Why Summary Reports Matter
While your SQDCP board gives a snapshot of daily performance, summary reports help track trends, support decision-making, and highlight key areas that need attention. Whether used daily or weekly, a clear and consistent report turns visual data into actionable insights for leaders and teams alike.
Gathering Information from the Board
Start by collecting the latest data from each SQDCP category—Safety, Quality, Delivery, Cost, and People. Use colour indicators, numbers, and notes recorded during the shift to fill in your report. Consistency is key, so follow the same structure each time to make comparison easier.
Highlighting Key Patterns and Exceptions
In your report, point out trends such as repeated red indicators, steady improvements, or new concerns. Highlighting exceptions—both positive and negative—makes it easier for teams to celebrate wins or address problems early. Include notes or comments from daily reviews to add context to the numbers.
Keeping It Visual and Simple
Use simple charts or colour-coded tables to summarise performance. This makes the report easy to read and share across teams or departments. A summary section with short bullet points can help draw attention to the most important findings and recommended next steps.
Using Reports to Support Continuous Improvement
Regular summary reports help drive continuous improvement by keeping leaders and teams aligned. They also provide a record of progress over time, which can be useful during audits, reviews, or team meetings.
Who Should Review and Act on SQDCP Metrics? Defining Roles and Responsibilities
Making Metrics Meaningful Through Team Involvement
SQDCP boards are most effective when the right people are involved in reviewing and responding to the data. Each category—Safety, Quality, Delivery, Cost, and People—requires active participation from different roles to drive meaningful improvement. Clear responsibility ensures that issues don’t go unnoticed and actions are followed through.
Operators and Frontline Team Members
Operators are closest to the work and should contribute to updating and reviewing the board daily. They are well placed to spot early signs of issues and share observations that might not be recorded elsewhere. Their feedback is crucial in understanding what’s really happening on the floor.
Team Leaders and Supervisors
Team leaders take the lead in daily reviews, guiding short discussions on the board’s status. They help prioritise issues, support team input, and ensure corrective actions are planned and tracked. Their role bridges frontline insight with management decisions.
Managers and Department Heads
Managers should regularly review weekly or trend data from the SQDCP board to spot recurring issues or improvements. Their focus is on cross-team coordination and resource support. When actions require larger changes, managers take the lead in planning and follow-up.
Support Staff and Improvement Teams
Staff in quality, maintenance, or HR play a supporting role by responding to issues raised on the board. Their input ensures expert help is available when needed, keeping the improvement process active and supported across all departments.
How to Prioritise Issues for Action from SQDCP Insights
Focusing on What Matters Most
With multiple entries on your SQDCP board daily, not every issue can be tackled at once. Prioritising ensures that the most critical problems get attention first, driving results without overwhelming the team. Clear priorities also help use time and resources more effectively.
Start with Safety and Quality Risks
Always give immediate attention to issues that impact safety or product quality. Hazards, near-misses, or repeated defects can lead to larger problems if ignored. These issues not only affect performance but also staff wellbeing and customer satisfaction, so they should top your action list.
Look for Repeat Occurrences
If the same issue appears multiple times across different days or shifts, it signals a deeper problem. Use trend data from your SQDCP board to identify which problems are recurring. These are often the best opportunities for root cause analysis and lasting improvement.
Assess the Impact on Delivery and Cost
Some issues may not seem urgent but cause delays or increased costs over time. Late deliveries, excess material use, or overtime hours can quietly add up. Reviewing these metrics helps spot hidden inefficiencies that are worth addressing early.
Get Input from the Team
During your daily or weekly board reviews, involve the team in deciding which issues to act on first. They often know which problems affect performance the most and may already have ideas for quick wins or longer-term fixes.
Turning Board Findings into Actionable Continuous Improvement Plans
Moving from Observation to Action
Collecting data on an SQDCP board is only the first step. The real value comes when findings are used to drive improvement. Turning daily observations into clear action plans ensures that small issues don’t grow into major problems and that performance keeps moving forward in all key areas.
Identifying the Right Problem to Solve
Start by reviewing the board for recurring issues, red indicators, or trends that suggest something needs fixing. Focus on problems that impact multiple areas or have been highlighted more than once. Clear, specific problems are easier to act on and solve effectively.
Setting SMART Actions
Once the issue is chosen, define actions that are Specific, Measurable, Achievable, Relevant, and Time-bound. For example, if quality errors are rising, a SMART action might be to review inspection steps and retrain team members by the end of the week. Avoid vague goals—clear steps lead to better results.
Assigning Responsibility and Deadlines
Every action should have a person responsible and a deadline. This ensures accountability and keeps momentum going. Tracking progress through follow-up meetings or board updates helps the team stay focused and aware of results.
Reviewing and Learning from Results
After actions are completed, review whether the issue has improved. If not, revisit the plan or look deeper at the root cause. Regular review creates a cycle of learning and continuous improvement, turning board insights into real change.
Linking SQDCP Results to Broader KPIs and Business Goals
Connecting Daily Metrics with Strategic Aims
While the SQDCP board focuses on day-to-day operations, its true strength lies in how it supports wider business objectives. By aligning the five categories—Safety, Quality, Delivery, Cost, and People—with broader KPIs, teams can see how their daily actions contribute to long-term success.
Translating SQDCP into Strategic Impact
Each part of the SQDCP board reflects performance drivers that support core business goals. For example, improved safety reduces downtime and supports compliance. Better quality leads to higher customer satisfaction and fewer returns. When delivery is on time, customer trust grows. Lower costs improve profitability, and engaged people support a strong culture and productivity.
Creating a Consistent Line of Sight
Leaders can use SQDCP findings to provide a clear line of sight between shop floor activity and organisational priorities. For instance, if a company’s strategic goal is to reduce waste, daily Cost metrics on the board become an early signal of progress or risk. This helps align efforts from operators to executives.
Using Reports to Link Data
Weekly or monthly summary reports based on SQDCP findings can feed into company-level dashboards. Trends in delivery or quality can help explain shifts in customer satisfaction scores or production KPIs. This integrated view supports better planning and cross-functional decision-making across the business.
Automating Reports and Alerts from Digital SQDCP Boards
Why Automation Supports Faster Decision-Making
Digital SQDCP boards bring the added advantage of automation. By setting up automatic reports and alerts, teams can respond faster to changes and stay on top of performance without manual effort. Automation saves time, ensures consistency, and keeps everyone informed across all five categories—Safety, Quality, Delivery, Cost, and People.
Generating Timely Reports
With digital tools, daily or weekly performance reports can be generated automatically using data logged by the team. These reports highlight key trends, missed targets, and improvements. They can be scheduled to reach relevant team members and leaders at set times, helping to keep everyone aligned without extra admin work.
Setting Up Real-Time Alerts
Alerts can be triggered when a metric falls outside set limits—such as a safety incident, a late delivery, or a dip in morale. These real-time notifications make sure issues are not overlooked. Team leads can receive instant updates, allowing for quicker action and better problem resolution.
Customising Alerts and Dashboards
Digital boards allow for personalised settings. Each department or role can focus on what matters most to them by choosing which alerts they receive and how reports are displayed. Dashboards can be adjusted to highlight specific goals, helping to turn raw data into useful insights at a glance.
How Daily Stand-Ups Can Drive Immediate Action on SQDCP Data
Making Daily Data Part of the Conversation
Daily stand-ups are short, focused meetings where teams gather around the SQDCP board to review performance. These quick sessions help bring the data to life by encouraging open discussion and immediate feedback. When teams talk about real issues from the board each day, problems are addressed faster and improvement becomes part of the daily routine.
Spotting and Acting on Issues in Real Time
Because the SQDCP board shows live data on Safety, Quality, Delivery, Cost, and People, it highlights problems early. During the stand-up, red or amber indicators guide the conversation. If a delivery is falling behind or a safety risk is spotted, action can be assigned on the spot, preventing delays and escalations.
Encouraging Ownership and Team Involvement
Stand-ups give everyone a voice, from frontline workers to team leaders. By involving the full team in the review, the process becomes more inclusive and transparent. Team members are more likely to take ownership of their actions and feel responsible for resolving issues raised on the board.
Driving a Culture of Continuous Improvement
Regular discussion of the SQDCP board reinforces habits of reflection and action. Over time, this creates a culture where the team not only tracks performance but actively works to improve it—one day at a time. The stand-up becomes a powerful tool for engagement, learning, and immediate response.
Tracking the Impact of Actions Taken on SQDCP Board Results
Why Measuring Impact Matters
Taking action based on SQDCP findings is only half the job—measuring the results of those actions is what completes the improvement cycle. By tracking the impact over time, teams can see what worked, what didn’t, and where further adjustment is needed. This helps sustain progress and avoid repeating the same problems.
Reviewing Data Trends Post-Action
After an issue is addressed, the relevant section on the SQDCP board should show improvement. For example, if a training session was held to reduce quality defects, the Quality metrics should reflect fewer errors. Comparing data before and after action gives a clear picture of its effectiveness.
Using Weekly or Monthly Reviews
Short-term changes can be seen in daily updates, but longer-term effects show best in weekly or monthly trend reviews. These reviews allow teams and leaders to assess whether actions had lasting results or if further steps are needed. Highlighting positive changes also boosts team motivation.
Updating Teams on Results
Sharing the outcome of completed actions helps close the loop. When team members see how their efforts made a difference, they stay engaged and committed to improvement. Clear updates also build trust and encourage continued participation in daily SQDCP board activities.
Adjusting Plans When Needed
If results fall short of expectations, it’s an opportunity to learn. Teams can revisit the root cause, revise the action plan, and try a new approach. This flexible, data-driven method keeps improvement ongoing and responsive to real shop floor conditions.
Best Practices for Auditing and Improving Your SQDCP Review Process
Why Regular Audits Keep the Process Effective
Even the most well-designed SQDCP board can lose impact without regular review. Auditing your SQDCP process ensures that data remains accurate, actions are followed through, and the board continues to support daily improvement. A structured audit can help spot gaps, remove outdated practices, and drive better results.
Check for Consistent Data Updates
A common issue is missed or delayed updates. Audits should check that the board is filled out daily and that data is current and complete. Look for missing entries, unclear comments, or inconsistencies between shifts. Reliable data is the foundation for meaningful actions.
Evaluate the Quality of Team Discussions
Effective SQDCP reviews go beyond reading the board—they involve active team discussion. During audits, observe if daily reviews are happening, if team members are engaged, and whether actions are clearly assigned. Strong conversations help turn data into decisions.
Review Action Tracking and Follow-Up
Check if problems raised on the board lead to documented actions and whether those actions are being tracked to completion. A clear link between problems, responses, and outcomes shows that the process is working and valued by the team.
Gather Feedback and Involve the Team
Ask team members what’s working and what could be better. Their input often reveals simple ways to improve the board layout, review timing, or data clarity. Involving the team in refining the process increases engagement and ownership.