What Makes a Balanced Scorecard Truly ‘Digital’?
Instant Access to Live Performance Data
A digital Balanced Scorecard gives teams live access to performance data across all key areas—financials, operations, customer, and learning. Unlike manual charts or spreadsheets, digital tools automatically update figures in real time, making it easier to track progress without delay.
Interactive Dashboards for Better Clarity
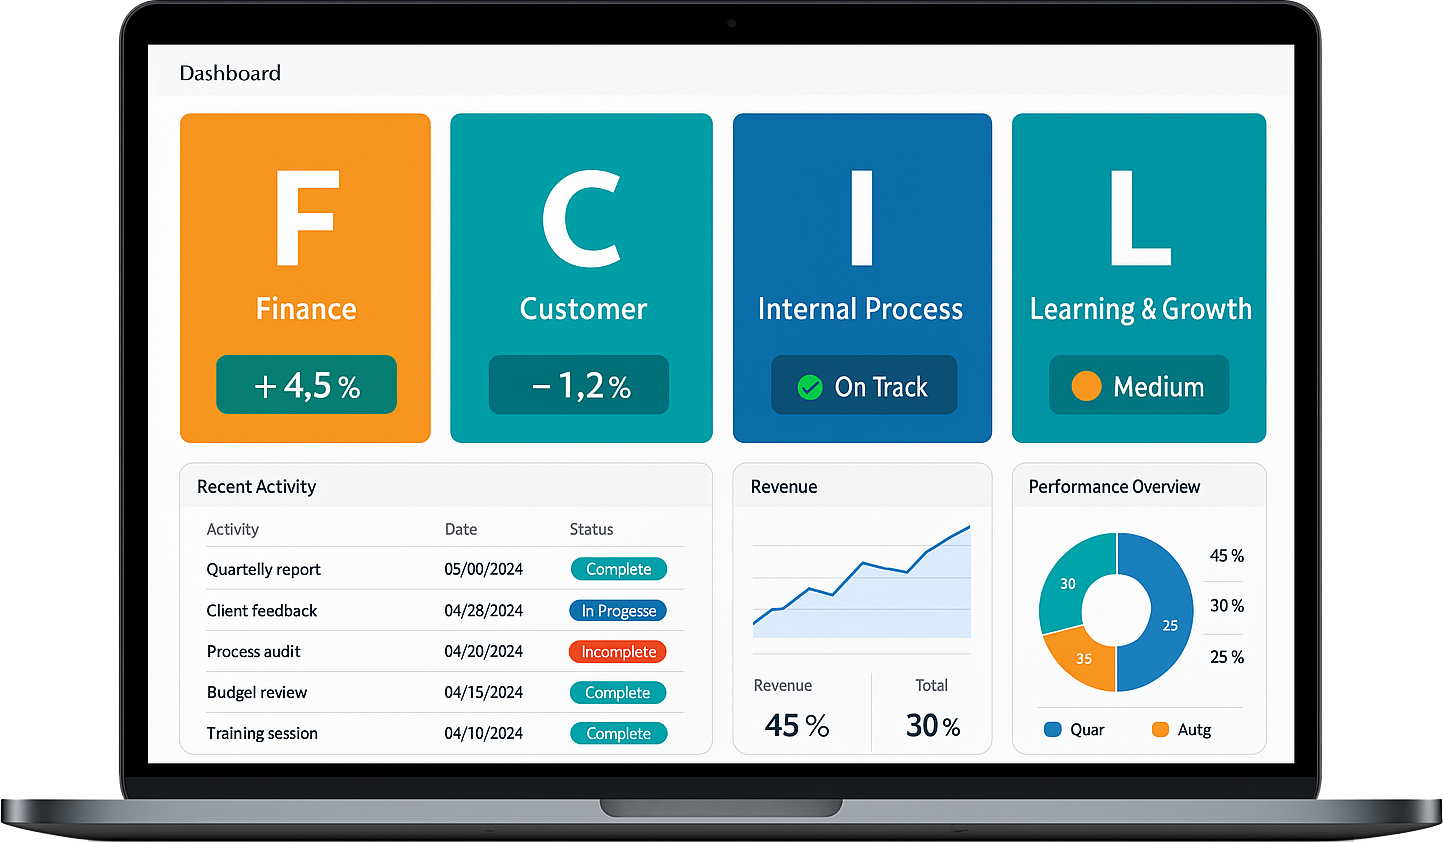
Digital scorecards use visual dashboards to present goals, KPIs, and trends. Colour-coded indicators, graphs, and status alerts help team members quickly understand what’s on track and what needs attention. This improves visibility across departments and reduces the time spent interpreting reports.
Custom Views for Each Role or Department
A digital setup allows custom views for different teams. Leadership can focus on strategic goals, while frontline teams see daily targets. This personalisation ensures everyone stays aligned with their part of the plan and contributes towards the bigger picture.
Easy Updates and Centralised Control
With a digital platform, updates to objectives or metrics are made in one place and reflected everywhere instantly. There's no need to reprint reports or send out new templates. This helps teams stay current and work from the same source of truth.
Tracking and Learning from Trends
Digital scorecards keep a history of performance data, allowing trend analysis over weeks, months, or quarters. This supports better planning, highlights long-term improvements, and uncovers areas where additional focus is needed.
How Digital Scorecards Align Teams with Strategic Goals
Clear Visibility of Organisational Objectives
Digital scorecards make strategic goals visible and accessible to everyone in the organisation. Whether it's improving customer satisfaction or reducing operational costs, each target is clearly displayed. This helps all teams understand where the company is heading and how their role fits into the bigger picture.
Connecting Daily Activities to Long-Term Strategy
With digital scorecards, day-to-day tasks can be directly linked to broader objectives. Teams can see how their daily performance contributes to company-wide success. This strengthens commitment and encourages a more focused work environment where every action supports the main goals.
Real-Time Progress Tracking
Live updates allow teams to track performance against key indicators as they happen. If a target is falling behind, it’s easier to respond quickly and make the necessary changes. This ongoing awareness keeps everyone aligned and avoids last-minute surprises.
Role-Based Dashboards for Better Clarity
Digital scorecards can be tailored by role or department. For example, production teams may see output-related goals, while customer service focuses on satisfaction scores. This personalisation makes the strategy more relevant to each group, leading to stronger alignment.
Encouraging Accountability and Team Collaboration
When progress is transparent, teams are more accountable for their results. Digital scorecards create a shared understanding of what matters most, which encourages departments to work together towards shared targets, rather than in isolation.
Tracking KPIs in Real Time with Digital Tools
Instant Access to Performance Data
Digital tools allow teams to track key performance indicators (KPIs) instantly. Whether it’s production output, safety metrics, or delivery rates, data is updated in real time. This removes the delays of manual reporting and gives everyone a clear view of how operations are performing at any moment.
Faster Decision-Making on the Shop Floor
Real-time KPI tracking supports quicker and smarter decisions. When an issue arises, teams can spot it immediately and take corrective action. This prevents minor problems from turning into major setbacks, improving response times and boosting overall productivity.
Custom Views for Different Teams
Digital tools can display relevant KPIs based on the user’s role. For example, supervisors might monitor downtime or efficiency, while team leaders focus on daily output. This ensures each person has access to the most meaningful data without distraction.
Trend Analysis and Continuous Improvement
With historical and live data combined, teams can identify patterns and trends. This helps in forecasting, setting realistic goals, and finding long-term improvements. Real-time visibility makes it easier to compare results and learn from what works best.
Greater Accuracy and Reliability
Manual records are prone to errors, but digital tools ensure data is captured accurately and consistently. This reliability increases trust in the numbers, allowing managers and teams to make confident decisions based on up-to-date information.
Why Strategy Execution Fails Without the Right Software
Lack of Real-Time Visibility
Without the right software, teams often rely on outdated reports and delayed updates. This makes it difficult to track progress accurately and react quickly when things go off course. Real-time visibility is key to keeping strategy aligned with day-to-day actions.
Poor Communication Across Teams
Manual systems or scattered tools can lead to miscommunication and confusion. Important updates or changes in direction may not reach the right people on time. A centralised platform helps teams stay aligned and ensures everyone is working toward the same goals.
Inconsistent Performance Tracking
When strategy tracking is done on paper or across multiple tools, consistency is lost. Different teams may use different formats or metrics, making it hard to measure true progress. Software brings standardisation, making data comparable and reliable.
Low Accountability and Follow-Up
Without a clear system for monitoring responsibilities, it becomes difficult to hold individuals accountable. Tasks might slip through the cracks, and targets may be missed without anyone noticing. The right software assigns ownership and sends reminders to keep things on track.
No Clear Link Between Strategy and Action
Strategy often fails when it's not translated into daily actions. Good software connects long-term goals with short-term tasks and performance metrics. This helps every team understand how their work contributes to the bigger picture, driving better focus and results.
Visualise Performance Data Clearly—No More Spreadsheets
Easy-to-Read Dashboards Replace Complex Sheets
Spreadsheets can quickly become overwhelming, especially when filled with long rows of numbers and multiple tabs. Digital dashboards offer a clearer, more visual way to present performance data. Charts, graphs, and colour-coded indicators make it easy to understand trends and progress at a glance.
Real-Time Updates Without Manual Input
Unlike spreadsheets that require regular manual updates, digital tools pull data in real time. This means your team always sees the latest figures without needing to check or update multiple files. It saves time and reduces the chance of errors caused by manual entry.
Custom Views for Teams and Leaders
Visual dashboards can be tailored to show the most relevant data for each user. A team leader might track daily targets, while senior managers focus on long-term trends. This flexibility ensures everyone has the insights they need without sifting through irrelevant details.
Improved Decision-Making Through Clearer Insights
When data is easy to understand, it leads to better decisions. With visual tools, patterns and issues stand out more clearly than they would in a spreadsheet. This helps teams act quickly, solve problems earlier, and improve overall performance.
Less Time Spent on Reporting
Creating reports from spreadsheets can be a slow and repetitive task. Digital dashboards simplify this by generating visual reports automatically. Teams spend less time gathering data and more time using it to drive improvements and meet their goals.
How to Link Departmental Goals to Business Strategy
Start with Clear Strategic Objectives
To align departments with business strategy, begin by clearly defining the organisation’s overall goals. These might include growth, efficiency, customer satisfaction, or innovation. Once the direction is set, each department can understand its role in contributing to the bigger picture.
Break Down Strategy into Department-Level Goals
Convert high-level strategy into specific, measurable goals for each department. For example, if the business aims to improve customer experience, the service team might focus on reducing response times, while operations might improve delivery accuracy. Each team’s goal should support the broader strategy.
Use Performance Metrics That Align
Choose performance indicators that clearly show progress at both the departmental and organisational levels. This makes it easier to track how well each department is contributing to the strategy. Use consistent and simple metrics to keep things clear across the business.
Encourage Regular Team Check-Ins
Departmental goals should not be set and forgotten. Teams need to review them regularly to check if they are still aligned with the organisation’s direction. These meetings also give a chance to share updates, adjust actions, and stay focused on strategic outcomes.
Promote Cross-Department Collaboration
Business goals often require multiple departments working together. Encourage communication between teams to ensure efforts are not duplicated or misaligned. When departments understand how their work affects others, it becomes easier to stay unified in achieving strategy.
Improving Decision-Making with Scorecard Dashboards
See the Bigger Picture at a Glance
Scorecard dashboards give managers and teams a clear view of how the business is performing. With key data shown visually on one screen, it’s easier to spot trends, track targets, and compare actual results with planned goals. This helps everyone make informed choices faster.
Use Real-Time Information for Timely Actions
Decisions based on old data can lead to missed opportunities. With real-time updates from scorecard dashboards, teams work with the most recent information. This means you can respond to issues as they happen and avoid delays that might affect overall performance.
Compare Team and Department Progress Easily
Dashboards allow leaders to view progress across teams or departments side by side. This helps identify which areas are doing well and which need support. It also makes performance more transparent, helping teams learn from each other and improve as a group.
Focus on What Matters Most
Scorecards highlight key performance indicators linked to your business goals. This keeps attention on the most important areas and prevents distractions. Instead of getting lost in endless reports, managers can stay focused and direct efforts where they are needed most.
Encourage Data-Led Conversations
With clear visuals and shared data, scorecard dashboards support open and productive discussions. Teams can talk through numbers, ask the right questions, and agree on next steps with confidence. This leads to better teamwork and stronger decision-making across the board.
From Planning to Action: Making Strategy Measurable
Turn Strategic Goals into Clear Targets
For a strategy to be effective, it must be more than a list of ideas. Begin by turning broad goals into clear, measurable targets. For example, if your strategy includes improving customer satisfaction, define what success looks like—such as increasing satisfaction scores by a set percentage within a time frame.
Break Down Goals for Each Department
Each department plays a role in achieving the overall strategy. Break down business goals into department-level tasks. For instance, the operations team might focus on reducing delivery time, while customer service works on faster response rates. This makes strategy relevant at every level.
Choose the Right Metrics
To measure success, use simple and relevant key performance indicators (KPIs). These should directly link to the strategic goals and be easy to track regularly. Avoid too many metrics; instead, focus on those that provide real insight and drive action.
Use Visual Tools to Track Progress
Dashboards and scorecards make it easier to see how the strategy is performing. With visual updates, teams can quickly identify whether targets are being met or if action is needed. This keeps everyone focused and accountable.
Review and Adjust Regularly
Strategic plans need to be flexible. Regular reviews help ensure that your actions stay aligned with your goals. If results show a gap, teams can adjust their approach and take corrective action before small issues grow.
Encouraging Accountability Through Transparent Metrics
Set Clear Expectations for Everyone
Accountability starts with clarity. When teams understand what is expected of them and how success will be measured, they are more likely to stay focused. Clearly defined metrics give every team member a shared understanding of their responsibilities.
Make Performance Visible to All
Displaying key performance indicators (KPIs) on visible boards or dashboards allows everyone to see how the team is progressing. This transparency promotes a sense of shared ownership, as results are not hidden or limited to managers alone.
Link Metrics to Real Work
Metrics should reflect daily tasks and long-term goals. When people see how their actions impact overall results, they take more responsibility. For example, a production team seeing real-time quality scores can adjust their process quickly to meet targets.
Encourage Open Conversations
Transparent metrics support open discussions about performance. Instead of blame, the focus shifts to solutions. Regular team check-ins using current data help address issues early and recognise success when goals are met or exceeded.
Support Continuous Improvement
With visible metrics, teams can track progress over time and look for ways to improve. This encourages a proactive mindset, where accountability becomes part of the culture—not just a top-down expectation.
Setting Clear Targets for Growth and Operational Success
Start with a Defined Business Goal
Every successful growth plan begins with a clear business objective. Whether you aim to expand market reach, improve delivery times, or increase customer satisfaction, your goals must be specific and easy to understand across the organisation.
Break Down Goals into Actionable Targets
Once you’ve set your primary goal, divide it into smaller, measurable targets. For example, if your goal is to boost sales, set weekly or monthly sales targets for each team or region. This helps everyone stay aligned and focused on achievable outcomes.
Use Measurable KPIs to Track Progress
Key Performance Indicators (KPIs) help track the progress of each target. Choose simple, meaningful metrics like production rate, delivery time, or cost per unit. These figures should be updated regularly to give a real-time view of performance.
Align Teams with Common Objectives
Clear targets create a sense of direction for different departments. When teams understand how their work contributes to wider goals, they collaborate better. Whether it’s operations, sales, or support, alignment ensures consistent progress.
Review and Refine Regularly
Business goals and conditions can change. Review your targets often to check if they are still relevant and achievable. Use the data collected to refine your approach, ensuring continuous growth and strong operational performance.
Customising Your Scorecard for What Matters Most
Focus on Your Strategic Priorities
Every organisation has unique goals. A well-designed scorecard should reflect what truly matters to your business. Whether you're focused on customer satisfaction, operational efficiency, or employee engagement, your scorecard must highlight the areas that drive your success.
Select the Right Performance Measures
Choose metrics that clearly represent your strategic objectives. Instead of tracking every possible number, focus on key indicators that show real progress. For example, if improving delivery time is a goal, track on-time completion rates or average turnaround time.
Tailor for Different Teams or Departments
Different parts of the business contribute in different ways. Your scorecard should be flexible enough to allow each department to track what’s most relevant to them. This ensures all teams stay aligned without being overwhelmed by irrelevant data.
Make it Simple and Easy to Understand
Your scorecard should be easy to read and interpret. Use plain language, simple categories, and visual cues like colour coding to help everyone quickly understand performance. Clear presentation leads to faster action and better decision-making.
Update Regularly to Stay Relevant
Business needs change over time, so your scorecard should evolve too. Review and revise the metrics regularly to ensure they continue to reflect your current priorities. A customised scorecard keeps your teams focused on what truly matters now.
How Regular Scorecard Reviews Drive Improvement
Keep Everyone Aligned with Regular Check-Ins
Holding regular scorecard reviews ensures all teams stay focused on shared business goals. These sessions give managers and team members a clear view of how well strategies are working, helping everyone stay aligned and accountable for results.
Identify What’s Working—and What Isn’t
Reviewing the scorecard frequently helps spot patterns, trends, and any underperforming areas early. This allows you to act quickly and fix issues before they grow into bigger problems. It also highlights successful efforts that can be repeated or scaled across the business.
Encourage Informed Decision-Making
Data-driven reviews give leaders the facts they need to make smart choices. With up-to-date information on performance, managers can allocate resources more effectively, adjust priorities, or provide extra support where needed.
Promote a Culture of Continuous Improvement
Regular reviews show employees that performance matters and that the organisation is committed to getting better. It encourages teams to reflect on their work, celebrate wins, and find new ways to improve daily operations and long-term results.
Adjust Goals and KPIs as Needed
Business environments change quickly. Regular scorecard reviews make it easier to update goals or KPIs so they stay relevant. This ensures that the scorecard always reflects what’s most important to the business at any given time.
Integrating Financial and Non-Financial Performance Data
Balancing Numbers with Meaning
While financial data shows how a business is performing in terms of revenue, profit, or cost, it doesn’t always reflect what’s happening behind the scenes. Non-financial data—like customer satisfaction, employee engagement, and process efficiency—provides the context behind those numbers. Integrating both gives a complete view of performance.
Supporting Better Business Decisions
Combining financial and non-financial metrics helps leaders make more informed choices. For example, if profits are falling but customer satisfaction scores are also low, the root cause may lie in service or product quality. This mix of insights ensures decisions are based on real business drivers, not just surface-level figures.
Connecting Strategy to Everyday Operations
When both types of data are viewed together, it’s easier to link daily actions to strategic goals. Non-financial indicators often act as early warning signs, highlighting issues before they affect the bottom line. This allows teams to take action early and protect financial performance.
Encouraging Long-Term Thinking
Financial data often reflects short-term results. Including non-financial measures supports a long-term view, focusing on sustainability, growth, and people. It encourages investment in areas like training, innovation, and customer experience, which build lasting success.
Creating a Holistic Scorecard
A Balanced Scorecard includes both financial and non-financial KPIs. This helps teams understand the full impact of their work and promotes a more complete performance culture across the organisation.
What to Look for in Balanced Scorecard Software
User-Friendly Interface for All Teams
One of the most important features to look for in Balanced Scorecard software is a simple and clear interface. It should be easy for users at all levels to understand, update, and navigate. A straightforward layout encourages regular use and ensures everyone can follow progress without confusion.
Customisable KPIs and Scorecard Views
The software should allow you to tailor key performance indicators to fit your organisation's goals. Custom views by department, team, or objective make it easier to track what matters most. This flexibility ensures the system works for your unique strategy and structure.
Real-Time Data Tracking and Reporting
Choose a system that offers real-time updates so you can monitor progress instantly. Built-in reporting tools should turn data into easy-to-read visuals, charts, or summaries that help with decision-making and reviews during meetings.
Goal Alignment and Strategy Mapping
A strong scorecard tool connects daily tasks to high-level strategy. It should support strategy maps, helping users understand how each goal contributes to broader objectives. This improves clarity and focus across teams.
Access Control and Collaboration Features
Look for options that allow controlled access based on roles. This ensures the right people can view or edit specific data. Collaborative tools like comment boxes or shared dashboards also help teams stay aligned and communicate more effectively.
Digital Transformation Starts with Strategic Clarity
Knowing the ‘Why’ Before the ‘How’
Before adopting any digital tools or systems, it’s important to have a clear understanding of your organisation’s strategic direction. Digital transformation is not just about using new technology—it’s about aligning digital efforts with your core goals. Without this clarity, even the best tools can lead to confusion or wasted effort.
Aligning Technology with Business Goals
Digital transformation works best when every new tool or process supports a bigger business objective. Whether it’s improving efficiency, enhancing customer experience, or increasing transparency, your digital strategy should always be tied to the outcomes your team is working towards.
Ensuring All Teams Understand the Vision
Strategic clarity also means every department knows how their work fits into the bigger picture. When teams understand the company’s direction, they can use digital tools more effectively to drive results. This shared understanding creates better alignment, teamwork, and performance.
Setting Clear, Measurable Objectives
To track progress during digital transformation, it’s essential to set clear and measurable goals. These could include key performance indicators related to quality, cost, delivery, or morale. Tracking these targets helps ensure your digital efforts are delivering real value to the business.
Making Change Easier to Manage
With a clear strategy in place, it becomes easier to prioritise digital changes, gain support from your teams, and overcome resistance. Strategic clarity gives your digital transformation a strong foundation and a clear path forward.