What Is Digital Balanced Scorecard Software and How Does It Work?
Bringing Strategy and Performance Together
Digital Balanced Scorecard Software is a tool that helps organisations track, manage, and improve their performance based on strategic goals. It builds on the traditional Balanced Scorecard framework, which focuses on four main areas: financial performance, customer satisfaction, internal processes, and learning and growth. The digital version allows teams to manage all of this in one central platform.
How the Software Works in Daily Use
The software allows users to set clear objectives, choose key performance indicators (KPIs), and assign actions to teams or individuals. These goals are organised under the four key perspectives, helping teams see how each task supports the wider strategy. Progress is updated regularly, making it easy to track results and spot problems early.
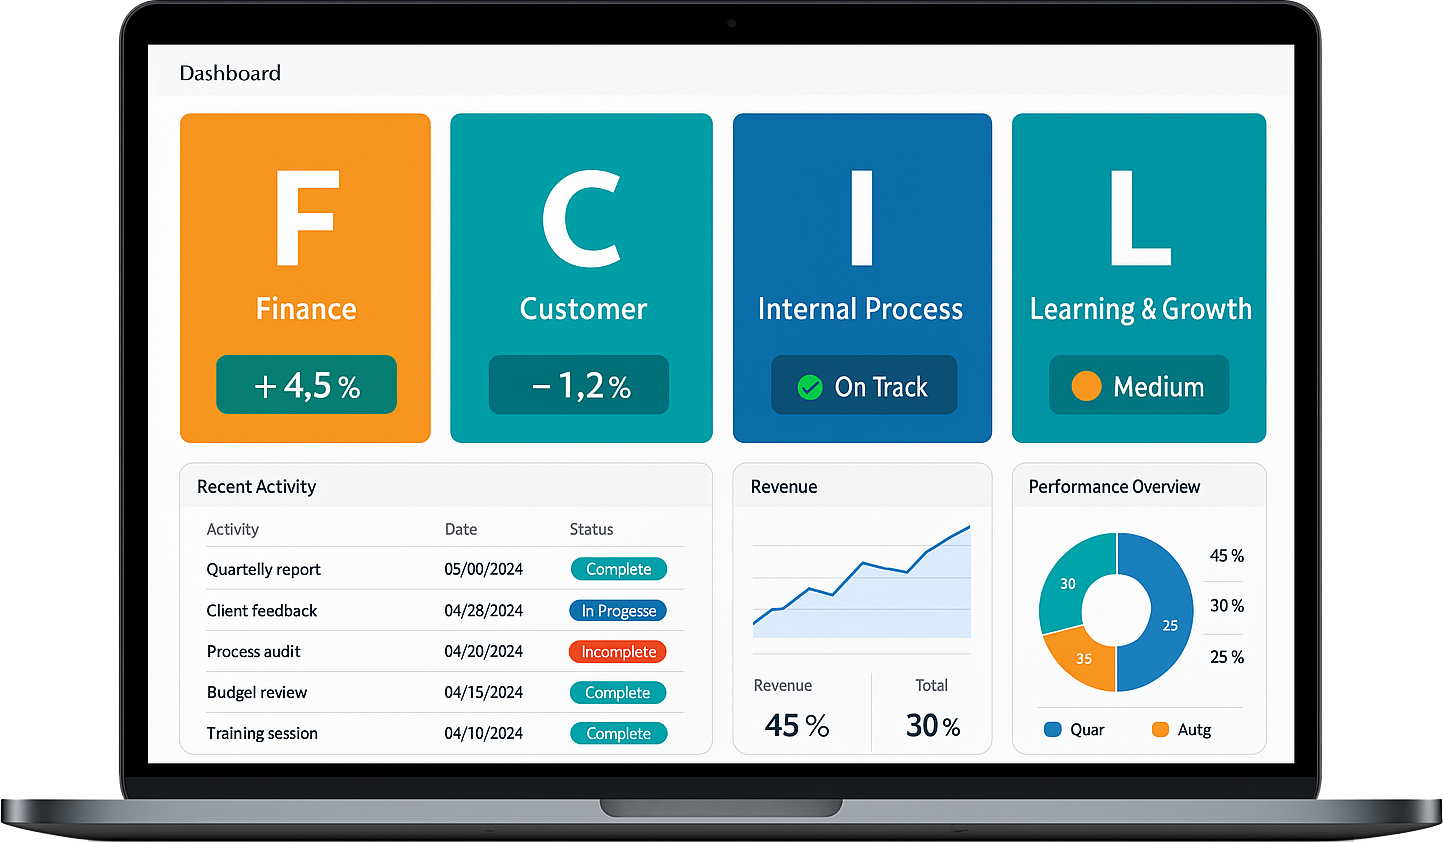
Using Dashboards and Real-Time Data
Most platforms offer visual dashboards where performance data is displayed in a simple, easy-to-read format. These dashboards show real-time progress, helping managers and teams stay informed and make faster decisions. Users can drill down into specific areas, view historical trends, and share updates across departments.
Improving Team Alignment and Accountability
By giving all departments access to the same performance information, Digital Balanced Scorecard Software helps align teams with the organisation’s goals. It also increases accountability, as everyone knows what’s expected and how their work contributes to success. Regular reviews and updates keep the strategy active and relevant throughout the year.
Why Go Digital? Key Benefits Over Traditional Scorecards
Better Visibility and Real-Time Tracking
One of the main reasons to switch to digital scorecards is the ability to see performance updates in real time. Traditional paper-based methods rely on manual updates, which can lead to delays and outdated information. With digital tools, data is instantly visible, allowing teams to react quickly and make better decisions.
Improved Collaboration Across Teams
Digital scorecards make it easier for different departments to work together. Everyone can access the same platform, see shared goals, and track performance without needing to rely on emails or printed reports. This shared visibility encourages stronger communication and ensures that everyone stays aligned with the overall strategy.
Faster and Easier Updates
With a digital system, updating goals, targets, or tasks is quick and simple. There’s no need to rewrite or reprint documents. Changes can be made with just a few clicks, and everyone sees the updates instantly. This flexibility helps teams stay on track even when plans shift.
Automatic Reporting and Smarter Reviews
Digital scorecards often come with built-in reporting features. Instead of manually collecting data, teams can generate reports with real-time charts and summaries. This saves time and supports better decision-making during performance reviews or planning meetings.
Centralised, Secure, and Easy to Access
All data is stored in one central place, making it easier to manage and secure. Teams can access the scorecard from anywhere, which is especially helpful for remote work or multi-site operations. Digital tools make the scorecard more practical, scalable, and sustainable over time.
Tracking KPIs in Real Time Across Financial, Customer, Internal, and Learning Perspectives
Real-Time Performance at Your Fingertips
Tracking key performance indicators (KPIs) in real time helps organisations stay focused and act quickly when results begin to shift. With a Digital Balanced Scorecard, businesses can monitor progress across all four key areas—financial, customer, internal process, and learning and growth—without delay. This improves visibility and allows for faster decision-making.
Financial Perspective
Financial KPIs help track profit margins, revenue growth, cost control, and budget performance. Real-time monitoring allows managers to respond quickly to issues such as rising costs or falling sales. This supports smarter budgeting and more accurate forecasting across the business.
Customer Perspective
Customer-related KPIs include satisfaction scores, service quality, and retention rates. By tracking these metrics in real time, organisations can identify service issues early and take immediate action to improve the customer experience. This helps build trust and long-term loyalty.
Internal Process Perspective
Operational KPIs show how well internal systems are working. These may include order processing time, error rates, or production efficiency. Real-time updates help teams manage workflow, reduce waste, and respond to delays before they affect outcomes.
Learning and Growth Perspective
This area includes staff development, training completion, and innovation metrics. Real-time tracking helps monitor employee engagement, skills growth, and new ideas being put into action. It ensures the organisation is continually learning and improving.
How to Use Dashboards for Clear Strategic Visualisation
Turning Data into Actionable Insights
Dashboards are powerful tools that help visualise strategy by bringing performance data into one clear, easy-to-read space. Instead of scanning long reports or multiple documents, users can view the progress of goals, tasks, and key indicators at a glance. This supports faster, more informed decision-making across the organisation.
Customising Views for Different Needs
One of the main benefits of using dashboards is the ability to customise views based on the user’s role. Executives may want to see high-level summaries, while department managers might focus on specific team metrics. With personalised views, everyone sees what’s most relevant to them without distraction.
Tracking Performance in Real Time
Digital dashboards update automatically, showing the latest figures as they happen. This real-time view of financial, customer, internal, and learning-based performance means issues can be spotted early, and successes can be built on quickly. Teams don’t need to wait for end-of-month reports to make important changes.
Using Visuals to Show Progress
Graphs, charts, colour coding, and progress bars make it easier to understand complex data. These visuals help highlight which goals are on track and which need attention. Clear visuals reduce confusion and support quick analysis during meetings and reviews.
Improving Communication and Focus
Dashboards keep teams focused on the right targets by showing progress clearly. They also support communication across departments by offering a shared view of performance. This creates alignment and keeps the strategy active in daily operations.
Aligning Business Goals and Metrics with Interactive Scorecard Tools
Connecting Strategy with Daily Work
Interactive scorecard tools help bridge the gap between business goals and day-to-day operations. By clearly linking strategic objectives to measurable metrics, these tools ensure that every team member understands how their work supports the wider vision. This alignment improves focus, teamwork, and results across the entire organisation.
Setting Clear and Measurable Goals
Using an interactive scorecard begins with defining clear, strategic goals across key areas such as financial performance, customer experience, internal processes, and staff development. Each goal is then matched with specific performance measures, allowing progress to be tracked in real time.
Visualising Progress for Better Understanding
Scorecard tools use visuals like graphs, colour indicators, and timelines to show how close teams are to reaching their targets. These visuals make it easier to understand complex data and highlight areas that need attention. With a clear view of progress, teams can stay focused and adjust plans when needed.
Encouraging Accountability and Action
When individuals and teams can see their own targets and results, they take more ownership of their work. Interactive tools make it simple to assign responsibilities, update progress, and review performance. This helps create a culture of accountability, where everyone works with purpose and direction.
Keeping Strategy Active and Relevant
Because scorecard tools are updated regularly, they help keep strategy visible and active throughout the year. Teams stay aligned, managers can respond quickly to change, and business goals remain at the centre of everyday decision-making.
Creating Strategy Maps That Everyone Understands
Making Strategy Easy to Visualise
A strategy map is a simple visual tool that helps everyone understand how different goals and activities connect to the organisation’s overall direction. By showing the link between objectives across financial, customer, internal process, and learning areas, it becomes easier to communicate plans and track progress.
Showing the Flow from Vision to Action
Strategy maps start with the top-level goals, such as growth or customer satisfaction, and break them down into smaller, supporting objectives. Each layer shows how one area influences another—for example, improved staff training (learning) can lead to better service delivery (internal), which then increases customer loyalty and financial results.
Clear and Simple Structure
Effective strategy maps use clear wording and simple design. Boxes and arrows are used to show the flow of cause and effect. This layout helps staff at all levels quickly understand how their work fits into the bigger picture, without needing to read long documents or attend complex briefings.
Helping Teams Stay Aligned
When teams see the full map, they can better understand each other’s roles and work towards shared outcomes. It encourages cross-department cooperation and reduces confusion or duplication of effort. Everyone knows what they’re aiming for—and how their goals support overall success.
Supporting Planning and Review
Strategy maps also act as a useful tool during planning sessions and performance reviews. They help focus discussions on what matters most and make it easier to adjust plans as the business grows or changes direction.
How to Measure Team and Departmental Performance Using Digital BSC Tools
Linking Team Goals to Organisational Strategy
Digital Balanced Scorecard (BSC) tools help measure team and departmental performance by aligning their objectives with the wider business strategy. Each team can set specific goals that support the company’s targets across financial, customer, internal, and learning perspectives. This ensures that everyone is moving in the same direction.
Tracking Key Metrics in Real Time
Once goals are set, teams can track their progress using key performance indicators (KPIs). Digital BSC tools allow users to monitor these metrics in real time, providing up-to-date insights into how teams are performing. Metrics might include project completion rates, customer feedback scores, or internal process improvements—depending on the team’s focus area.
Creating Clear Dashboards for Each Department
Each department can have its own dashboard that displays its goals, KPIs, and progress status. Colour coding and visual indicators help make performance data easy to understand at a glance. This visibility supports better planning and quick decision-making.
Encouraging Accountability and Improvement
When performance data is easy to access and understand, team members are more likely to take ownership of their results. Regular reviews using BSC dashboards help identify strengths, spot issues early, and make improvements. This creates a culture of accountability and continuous learning.
Supporting Transparent Communication
Digital BSC tools also make it easier to communicate performance across departments. Everyone can see how their work contributes to the organisation’s progress, encouraging collaboration and shared responsibility for success.
Setting Targets and Monitoring Progress Automatically
Why Automatic Tracking Matters
Setting clear targets is an essential part of successful strategy execution. With Digital Balanced Scorecard tools, targets can be set for each objective and tracked automatically. This removes the need for manual updates and ensures that progress is always visible and up to date, saving time and reducing errors.
Defining Realistic and Measurable Goals
Targets should be specific, achievable, and linked to key performance indicators. For example, a team might aim to reduce processing time by 20% or increase customer satisfaction by a certain score. Once the target is entered into the system, it becomes the benchmark against which performance is measured.
Real-Time Updates for Better Decisions
As teams complete tasks or reach milestones, progress is automatically updated. Dashboards display this information in real time, using colours, graphs, or progress bars. This makes it easy to see which goals are on track, which need attention, and where support may be required.
Improving Team Focus and Accountability
When targets are clearly displayed and automatically monitored, teams stay more focused on results. Everyone knows what they’re working towards and how much progress has been made. This transparency also encourages accountability, as performance is visible across departments.
Faster Adjustments When Needed
If results fall behind expectations, early warnings from automatic tracking allow managers to act quickly. Targets can be reviewed, priorities adjusted, and resources reallocated without delay, keeping strategy on track throughout the year.
Customising Reports to Match Your Organisational Needs
Making Reports Relevant and Easy to Use
Every organisation has different goals, teams, and ways of working. That’s why customised reports are so valuable. Instead of using a one-size-fits-all format, digital Balanced Scorecard tools allow you to design reports that reflect your organisation’s unique structure, language, and performance needs.
Choosing the Right Data for Each Audience
Different teams and leaders need different information. Senior managers may want a high-level view of strategic goals, while department heads may need detailed insights into day-to-day performance. With custom reporting, you can include only the most relevant data for each audience, keeping reports clear and focused.
Highlighting the Most Important Metrics
Custom reports let you choose which key performance indicators (KPIs) to show based on what matters most. You can group metrics by department, goal, or time period, helping teams understand progress and spot areas for improvement quickly. This keeps everyone aligned with business priorities.
Using Visuals That Make an Impact
Charts, tables, colour indicators, and summaries can all be added or removed depending on your reporting style. Well-designed visuals make complex data easier to read and understand. This helps speed up decision-making and keeps meetings focused on actions, not just numbers.
Updating Reports Automatically
With digital tools, customised reports can be set to update in real time. This means no more chasing down data or waiting for manual updates. Reports stay current, accurate, and ready to share with your team whenever needed.
Linking Projects and Initiatives to Scorecard Objectives
Turning Strategy into Action
For a Balanced Scorecard to deliver real results, projects and initiatives must be clearly linked to its objectives. Without this connection, strategy remains a plan on paper. Linking day-to-day work to long-term goals ensures that every project contributes to overall business success and helps teams stay focused on what matters most.
Aligning Activities with Strategic Goals
Each objective on the scorecard should have specific actions or initiatives attached to it. For example, if a goal is to improve customer satisfaction, related projects might include new service training or updated support processes. This alignment ensures resources are used effectively and efforts directly support the strategy.
Assigning Ownership and Timelines
Once initiatives are linked to objectives, it’s important to assign clear ownership and deadlines. Each team or individual involved should know their role, the expected outcome, and the time frame for delivery. This builds accountability and helps track progress more easily across the business.
Tracking Progress with Real-Time Tools
Using digital scorecard systems, you can connect initiatives to performance indicators and update progress in real time. Visual dashboards show how each project supports strategic objectives, making it easier to adjust priorities if needed and avoid delays.
Reviewing and Adjusting Regularly
As business needs change, some initiatives may need to shift. Regular reviews help confirm that each project remains aligned with strategic goals, and any new activities are added in the right place. This keeps the strategy active and responsive to real-world conditions.
Integrating Digital BSC Software with ERP and BI Systems
Bringing Strategic Data Together
Integrating Digital Balanced Scorecard (BSC) software with Enterprise Resource Planning (ERP) and Business Intelligence (BI) systems helps create a more connected and efficient organisation. By linking these platforms, you gain a complete view of performance—from daily operations to long-term strategy—all in one place.
Streamlining Data Flow Across Systems
When BSC software is integrated with ERP and BI systems, data flows automatically between tools. This reduces manual entry, avoids duplication, and keeps information accurate and up to date. As a result, teams can make better decisions based on real-time insights rather than outdated reports.
Aligning Operational and Strategic Metrics
ERP systems hold essential data about operations, such as finance, stock, or staffing. BI systems turn this data into detailed reports and trends. When connected with BSC software, this data helps track key performance indicators (KPIs) directly linked to strategic goals, offering a clearer picture of overall progress.
Improving Reporting and Visibility
Integration allows you to create reports that combine operational data with strategic targets. Visual dashboards and real-time updates make it easier for leaders to understand where the business is succeeding and where action is needed. This improves visibility across all departments and levels.
Supporting Faster and Smarter Decisions
With integrated systems, managers no longer need to switch between tools or wait for updates. Everything they need to review performance, manage resources, and plan for the future is connected—supporting quicker, more informed decisions that align with strategic goals.
Making Data-Driven Decisions Using Balanced Scorecard Insights
Turning Performance Data into Strategic Action
The Balanced Scorecard provides a clear view of how different areas of the business are performing. By collecting and organising data across financial, customer, internal process, and learning perspectives, it helps leaders make smarter, more confident decisions based on facts rather than guesswork.
Understanding What the Numbers Really Mean
It’s not just about tracking numbers—it’s about interpreting them in context. For example, a rise in customer complaints may be linked to a delay in internal processes. With Balanced Scorecard insights, teams can spot these connections early and respond quickly with the right actions.
Using Trends to Guide Future Planning
Looking at performance over time helps identify patterns and trends. These trends support better forecasting, risk management, and long-term planning. Instead of reacting to issues after they happen, teams can take proactive steps based on what the data shows.
Focusing on the Right Metrics
The scorecard highlights which indicators matter most to your strategy. This focus helps decision-makers prioritise key areas, allocate resources effectively, and avoid being distracted by less important information. With a clear view of what drives success, teams can stay aligned and move faster.
Encouraging a Culture of Evidence-Based Thinking
When everyone in the organisation understands how data links to strategy, it builds a culture where decisions are made based on insights, not assumptions. This supports continuous improvement and helps the business grow with greater clarity and control.
Encouraging Accountability Across Teams Through Transparent Performance Tracking
Why Transparency Builds Responsibility
When performance is openly tracked and shared, teams are more likely to take ownership of their work. Transparent performance tracking removes confusion about what is expected and helps everyone understand how their efforts contribute to the wider goals of the organisation. This clarity encourages a culture of accountability across all levels.
Setting Clear and Measurable Goals
The first step in encouraging accountability is to set clear, measurable targets for each team. These should be linked to strategic objectives and supported by key performance indicators (KPIs). When teams know exactly what success looks like, they can focus their energy and make better decisions.
Sharing Progress Through Digital Dashboards
Using digital tools to track performance makes it easy to display progress in a shared space. Dashboards provide real-time updates, showing who is meeting their targets and where extra attention may be needed. This openness supports honest conversations and motivates teams to stay on track.
Celebrating Achievements and Addressing Challenges
Transparent tracking also allows managers to recognise strong performance and address issues early. When goals are visible, it’s easier to reward success and offer support where teams are falling behind. This builds trust and helps everyone feel valued and responsible for results.
Creating a Consistent Review Process
Regular check-ins and performance reviews keep teams aligned and accountable. With clear data to support discussions, reviews become more productive and focused. Teams can reflect on progress, make adjustments, and stay connected to strategic goals throughout the year.
Reviewing and Updating Scorecards with Drag-and-Drop Simplicity
Making Strategy Easy to Manage
Keeping your Balanced Scorecard up to date is vital for staying aligned with changing business needs. With drag-and-drop features in digital tools, reviewing and adjusting scorecards becomes quick and straightforward. You no longer need to rebuild reports or re-enter data—everything can be moved and updated with a few clicks.
Flexibility Without Complexity
Traditional scorecard updates often involve lengthy meetings, manual edits, or complicated spreadsheets. Drag-and-drop tools remove that hassle. Teams can shift objectives, reassign actions, or rearrange performance indicators in seconds. This makes it easier to respond to new priorities or make improvements based on real-time feedback.
Real-Time Changes Across Teams
Once changes are made, they’re instantly visible across the system. Whether you're updating targets, adjusting timeframes, or moving goals between categories, everyone stays informed. This helps avoid confusion, keeps departments aligned, and supports quicker decision-making.
Perfect for Planning Sessions and Reviews
Drag-and-drop simplicity is especially useful during strategy reviews or planning sessions. Leaders can test different scenarios, reorganise goals, and adjust responsibilities on the spot—making planning more dynamic and collaborative. Teams leave the room with an updated, ready-to-use scorecard.
Encouraging Regular Engagement
When updates are easy to make, teams are more likely to use the scorecard actively. Regular engagement means better tracking, faster reactions to change, and stronger overall strategy execution. The ease of use turns the scorecard into a live tool, not just a document reviewed once a quarter.
Case Studies: How UK Businesses Improved Performance with Digital BSC Tools
Turning Strategy into Results
Across the UK, many businesses are using digital Balanced Scorecard (BSC) tools to improve performance, strengthen accountability, and align daily work with strategic goals. These real-world examples show how digital scorecards help teams stay focused, adapt quickly, and deliver measurable results.
Improving Customer Satisfaction in a Service Business
A mid-sized customer service provider in the UK adopted digital BSC tools to monitor satisfaction levels and internal response times. By tracking key indicators in real time and linking them to customer-focused objectives, the business reduced complaint resolution time by 30% and improved satisfaction scores within just six months.
Boosting Operational Efficiency in Manufacturing
A manufacturing company implemented a digital scorecard to improve internal process efficiency. With clear visibility over production targets, waste levels, and staff training, the company reduced downtime and cut process errors by 20%. Regular reviews and dashboard insights helped teams take action quickly when results slipped.
Aligning Teams in a Growing Organisation
A fast-growing UK-based firm used a digital BSC platform to align multiple departments with its expanding business strategy. Each team had its own dashboard linked to wider company goals. This approach helped improve collaboration, increase employee engagement, and achieve key growth milestones on time.
Driving Long-Term Improvement
These examples highlight how digital BSC tools help UK organisations track what matters, make better decisions, and turn plans into results. With clear goals, real-time data, and easy-to-use dashboards, businesses of all sizes can unlock long-term performance improvements.