What Is Visual Management and Why Does It Matter in Continuous Improvement?
Understanding Visual Management
Visual management is a method used to communicate key information quickly and clearly through visual cues. It involves using tools such as signs, labels, colour codes, charts, and boards to show what is happening in a process, what should be happening, and how to fix issues when they occur. The aim is to make the current state of work obvious to everyone involved.
Why Visual Management Matters
Visual management plays a big role in supporting continuous improvement. By making processes and problems visible, it helps teams spot delays, errors, or waste early. This clear visibility allows quicker decision-making and encourages immediate action when something goes wrong. It also helps workers stay focused, reduces the need for constant supervision, and improves teamwork.
Benefits in Daily Work
Using visual tools simplifies tasks and supports better organisation. When information is easy to understand at a glance, people can work with less confusion and more confidence. It improves safety, quality, and speed by keeping everyone aware of what is happening around them. Over time, this leads to a more efficient and consistent way of working.
Driving Continuous Improvement
As teams begin to rely on visual management, they naturally develop a habit of checking performance and thinking about how to make things better. This mindset is the heart of continuous improvement—finding small ways to improve every day. Visual management turns improvement into a shared goal that is seen, understood, and acted on by everyone.
Breaking Down SQDCM: What Each Letter Means and How It Drives Success
What Is SQDCM?
SQDCM is a simple but powerful way to measure and improve workplace performance. It stands for Safety, Quality, Delivery, Cost, and Morale. These five areas help teams focus on the most important parts of daily work. By tracking each one, teams can spot problems early and make steady improvements.
S – Safety
Safety always comes first. This part of SQDCM looks at how well the workplace protects people from harm. It includes checking for accidents, unsafe actions, or hazards. A safe workplace builds trust and keeps everyone focused and healthy.
Q – Quality
Quality means doing things right the first time. It focuses on making products or services free from errors. Tracking quality helps find where mistakes happen and how to prevent them in the future.
D – Delivery
Delivery is about getting things done on time. This means meeting deadlines, following schedules, and keeping promises to customers or team members. Good delivery builds reliability and trust.
C – Cost
Cost looks at how resources are used. It helps teams find waste, control spending, and work more efficiently. Managing cost well supports long-term success and growth.
M – Morale
Morale is the spirit of the team. It includes job satisfaction, motivation, and teamwork. A positive workplace boosts energy and helps people work better together.
How SQDCM Supports Success
By tracking SQDCM daily, teams stay focused on what matters most. It encourages action, supports clear thinking, and creates a culture of ongoing improvement and shared success.
How to Set Up an Effective SQDCM Board in Your Workplace
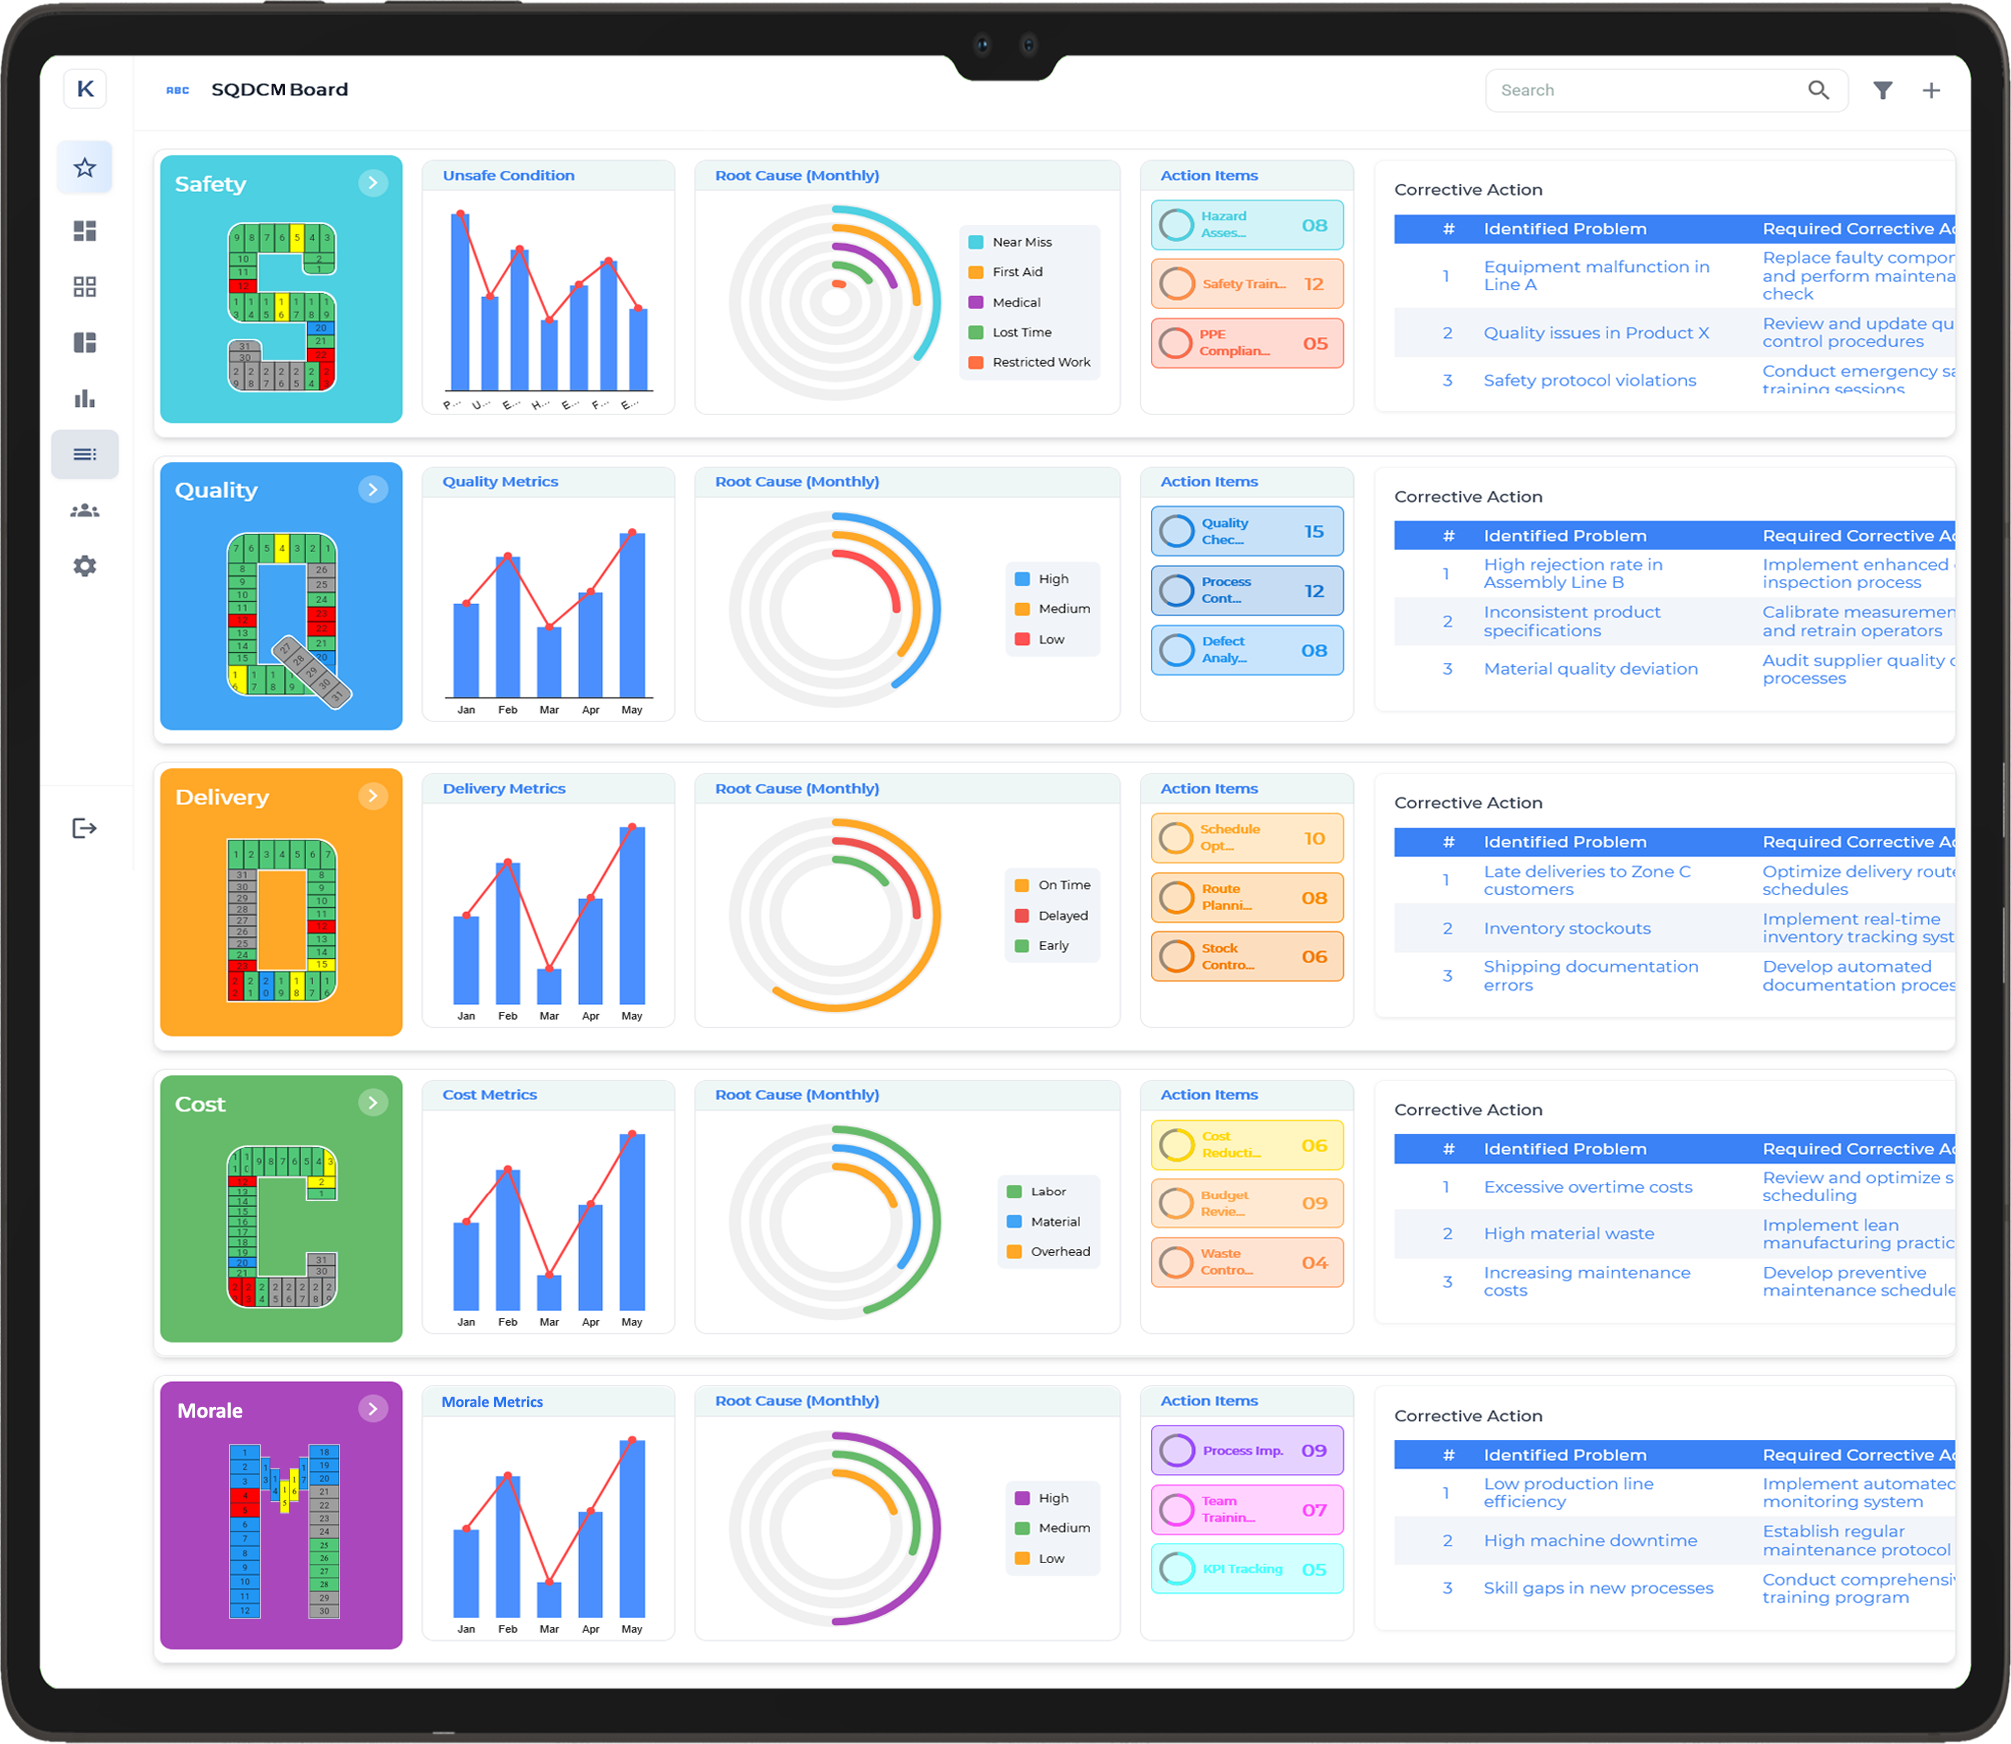
What Is an SQDCM Board?
An SQDCM board is a visual tool used to track key performance areas: Safety, Quality, Delivery, Cost, and Morale. It helps teams see how they are doing each day and where improvements are needed. When used well, it becomes a strong part of daily routines and team communication.
Step 1: Choose the Right Place
Place the board where everyone can see it, such as near the team’s work area or meeting point. Easy access means people are more likely to use and update it often.
Step 2: Design Clear Sections
Divide the board into five areas – one for each part of SQDCM. Use colours, labels, or simple icons to make each section stand out. Keep the layout clear and easy to understand at a quick glance.
Step 3: Set Daily Metrics
Choose simple daily measures for each area. For example, count safety checks, quality issues, on-time tasks, cost-saving ideas, and team feedback. Use ticks, scores, or colour-coded cards to show results clearly.
Step 4: Involve the Team
Make it part of the team’s daily habit. Involve team members in updating the board and discussing results. This builds ownership and keeps everyone focused on shared goals.
Step 5: Review and Improve
Use the board in daily or weekly meetings to spot trends, raise issues, and plan improvements. Over time, this helps build a culture of continuous improvement and team success.
Visual Tools to Track Safety, Quality, Delivery, Cost, and People Metrics
Why Use Visual Tools?
Visual tools help teams see key performance information at a glance. When used daily, they make it easier to track progress, spot issues early, and support ongoing improvement. These tools are simple, clear, and keep everyone focused on shared goals.
Tracking Safety
For safety, visual tools can include colour-coded signs, charts showing incident rates, and daily checklists. These help teams stay alert to risks and ensure the workplace stays safe for everyone.
Monitoring Quality
Quality boards often show data on defects, errors, or inspection results. Visual signals such as green and red markers quickly highlight good or poor results. This encourages fast action to fix problems and maintain high standards.
Measuring Delivery
Delivery tracking tools show if work is being done on time. This could include daily plans, completed task charts, or timeline boards. Teams can clearly see what’s on schedule and what needs extra attention.
Controlling Cost
Cost metrics can be tracked using charts that show usage of materials, energy, or time. These help identify waste and support cost-saving efforts. Simple visual cues make it easy to share this information with all team members.
People and Morale
Visual tools for people metrics may include feedback charts, attendance records, or recognition boards. These help track team spirit and well-being. Positive morale supports better teamwork and higher performance.
Bringing It All Together
When visual tools are used for all five areas, they create a full picture of how the team is doing. This makes daily management easier and helps drive steady improvements across the board.
Real-Time Problem Solving with SQDCM Visual Management
What Is Real-Time Problem Solving with SQDCM?
Real-time problem solving with SQDCM involves using a visual management system to address issues as they arise in the workplace. The SQDCM framework focuses on five key areas: Safety, Quality, Delivery, Cost, and Morale. By tracking these areas in real time, teams can quickly identify problems and take immediate action to resolve them, improving overall performance.
The Role of Visual Management
Visual management is an effective tool for real-time problem solving. It uses simple visual cues such as charts, boards, and colour codes to display key information. These visual tools make it easy for teams to spot any issues and act quickly to correct them. When employees can see problems at a glance, they can work together to find solutions faster.
How SQDCM Helps with Problem Solving
By tracking Safety, Quality, Delivery, Cost, and Morale in real time, teams gain a clear view of where problems may occur. For instance, if there is a sudden dip in quality or delivery, it can be immediately addressed before it impacts the larger operation. Regular updates on these metrics keep everyone informed and focused on areas needing attention.
Benefits of Real-Time Problem Solving
Real-time problem solving using SQDCM helps prevent small issues from escalating into bigger problems. It increases efficiency, reduces downtime, and ensures that teams stay aligned with organisational goals. Additionally, it fosters a culture of continuous improvement, where everyone is encouraged to take responsibility for resolving issues and driving performance.
Using Traffic-Light Indicators for Quick Decision Making
What Are Traffic-Light Indicators?
Traffic-light indicators are a simple yet effective tool for making quick decisions in the workplace. They use colours—red, amber, and green—to represent different levels of urgency or status. This system allows teams to quickly understand the situation at a glance and take appropriate action without unnecessary delays.
How Traffic-Light Indicators Work
The three colours in traffic-light indicators carry clear meanings:
- Red: Indicates an urgent issue or problem that requires immediate attention.
- Amber: Signals caution, meaning there is a potential issue that needs monitoring or action but isn’t as critical as red.
- Green: Represents things are running smoothly, and no immediate action is needed.
Benefits of Using Traffic-Light Indicators
One of the main advantages of using traffic-light indicators is their simplicity. Team members can quickly assess the situation without having to read through lengthy reports or data. This helps improve reaction time and makes decision-making more efficient. It also provides a clear visual cue, reducing confusion and ensuring everyone is on the same page.
Improving Workplace Efficiency
Traffic-light indicators help prioritise tasks and allocate resources more effectively. When the status is green, teams can focus on other priorities. If amber or red appears, it’s a signal to address the issue immediately, which helps to maintain productivity and prevent potential disruptions.
How Trend Charts Support Data-Driven Continuous Improvement
Understanding Trend Charts
Trend charts are a valuable tool for visualising data over time. They allow teams to track performance, identify patterns, and make informed decisions based on real-time information. By showing how key metrics evolve, trend charts provide a clear picture of progress and areas needing attention. These charts are essential for any business committed to continuous improvement, as they turn raw data into actionable insights.
Tracking Performance and Progress
One of the primary benefits of trend charts is their ability to show performance over time. Whether it’s tracking sales, quality control, or customer satisfaction, trend charts help organisations monitor their progress. By observing how specific metrics change, teams can assess whether improvements are being made or if new strategies need to be implemented.
Identifying Patterns and Issues
Trend charts also help identify patterns or emerging issues early on. For example, if a trend shows a gradual decline in product quality or an increase in delays, it becomes clear where action is needed. Early detection allows teams to address problems before they escalate, promoting more efficient operations and reducing costly mistakes.
Driving Data-Driven Decisions
Data-driven decisions are at the heart of continuous improvement. By using trend charts to analyse data, organisations can make informed choices, set realistic goals, and allocate resources effectively. This approach ensures that improvements are based on solid evidence rather than assumptions, leading to more reliable and sustainable outcomes.
Standardising Daily Stand-Up Meetings with SQDCM Boards
What Are Daily Stand-Up Meetings?
Daily stand-up meetings are short, focused gatherings where teams come together to discuss progress, challenges, and priorities for the day. The goal is to keep everyone aligned, address issues quickly, and ensure smooth operations. These meetings are often held in the morning to set the tone for the day and ensure the team is on the same page.
Using SQDCM Boards for Stand-Up Meetings
To make daily stand-up meetings more effective, many teams incorporate SQDCM boards into their routine. SQDCM stands for Safety, Quality, Delivery, Cost, and Morale—five critical areas that drive performance. By using a visual SQDCM board, teams can track these key metrics and quickly assess the status of ongoing projects and tasks.
How SQDCM Boards Improve Daily Stand-Ups
Incorporating SQDCM boards into daily stand-ups helps standardise the process and keeps the meeting focused on what matters most. Each area of the board can be reviewed in turn, with the team discussing any red flags or areas of concern. This method ensures that safety, quality, and efficiency are prioritised, while also addressing any potential cost issues or team morale challenges.
Benefits of Standardisation
Standardising daily meetings with SQDCM boards ensures that all team members stay engaged, understand priorities, and know exactly where their focus should be. It reduces confusion, improves communication, and fosters a culture of continuous improvement, where everyone is actively working towards better performance each day.
Integrating Root Cause Analysis Tools Like Fishbone & A3 into Your SQDCM Process
What is Root Cause Analysis?
Root Cause Analysis (RCA) is a problem-solving method used to identify the underlying causes of issues in a process. By using RCA tools such as the Fishbone diagram and A3 reports, teams can address problems at their source, ensuring that solutions are effective and long-lasting. Integrating these tools into your SQDCM process can enhance the continuous improvement journey and drive better results across Safety, Quality, Delivery, Cost, and Morale.
Using the Fishbone Diagram for SQDCM
The Fishbone diagram, also known as the Ishikawa diagram, helps teams visually map out potential causes of a problem. It breaks down complex issues into categories such as people, processes, equipment, and materials. When integrated with SQDCM, it helps identify root causes of problems like quality issues, delivery delays, or safety concerns. By addressing the root causes, teams can improve performance in all five SQDCM areas.
Applying A3 Reports in SQDCM
The A3 report is a structured problem-solving tool that summarises the problem, analysis, and proposed solutions on a single sheet of paper. It encourages clear, concise thinking and helps teams stay focused on solving the problem. Integrating A3 reports with SQDCM ensures that issues are systematically addressed, whether it’s related to cost overruns, safety violations, or low morale, leading to more effective and sustainable improvements.
Enhancing Continuous Improvement with Root Cause Analysis
By incorporating Fishbone and A3 tools into your SQDCM process, you ensure that issues are tackled from the root up. This approach promotes a culture of continuous improvement, enabling teams to identify and resolve problems more efficiently, improve performance, and drive success in all key areas of the business.
Visual Cues That Reinforce Team Accountability and Daily Focus
Why Visual Cues Matter
Visual cues are powerful tools for reinforcing team accountability and focus. By using simple, clear visual signals, teams can easily track progress, highlight priorities, and stay aligned with their goals. These cues make it easy for everyone to understand what needs attention and when, helping to ensure that tasks are completed on time and to a high standard.
Colour-Coded Systems
Colour-coded systems are a simple yet effective way to highlight important information. For example, using red to indicate urgent tasks, green for completed tasks, and yellow for tasks in progress provides immediate clarity. These colour cues make it easy for team members to quickly assess the status of work, prioritising attention where it's needed most.
Kanban Boards and Task Lists
Kanban boards are excellent tools for visualising workflow and enhancing team accountability. By using cards or sticky notes to represent tasks, teams can see at a glance what needs to be done, what's in progress, and what's been completed. This visual display helps keep everyone focused and ensures no task is overlooked.
Progress Charts and Milestone Tracking
Progress charts or milestone trackers are ideal for monitoring long-term projects. These tools show how much work has been completed and what's still to be done, motivating teams to stay on track. When visual progress is clear, team members feel a greater sense of ownership and responsibility for their work.
Fostering Team Focus
Visual cues not only keep team members accountable but also foster a culture of focus. By providing constant visual reminders of priorities and progress, teams stay engaged, aligned, and motivated to achieve their goals together. This leads to improved productivity and better results overall.
How Kanban Complements SQDCM for Task and Workflow Visibility
Understanding Kanban and SQDCM
Kanban and SQDCM are both valuable tools for improving task management and workflow visibility. Kanban is a visual system that helps teams track tasks as they move through different stages of work. SQDCM, which stands for Safety, Quality, Delivery, Cost, and Morale, focuses on key performance metrics to ensure the smooth running of operations. By combining these two systems, teams can achieve better organisation, clearer priorities, and a more efficient approach to continuous improvement.
Kanban’s Visualisation of Workflow
Kanban uses boards to visually represent tasks, typically organised into columns like "To Do," "In Progress," and "Completed." This visual layout makes it easy for teams to see what work is being done, what’s waiting to be started, and what’s already finished. By integrating this with SQDCM, teams can track how each task impacts safety, quality, delivery, cost, and morale in real time.
Aligning SQDCM Metrics with Kanban
Kanban boards can be customised to reflect SQDCM metrics, such as colour-coded cards for high-priority safety tasks or quality issues. This allows teams to quickly identify areas needing attention and align their efforts to meet performance goals. By tracking metrics such as delivery deadlines or cost, Kanban helps to maintain focus on continuous improvement while providing clear visibility into task progress.
Improving Efficiency and Team Collaboration
Kanban’s ability to visually represent tasks, combined with SQDCM’s focus on performance, ensures that everyone in the team is aligned and aware of their priorities. This collaborative approach helps improve overall efficiency and boosts team morale by providing clear goals and real-time feedback on progress.
Training Frontline Teams to Use SQDCM Effectively
What Is SQDCM?
SQDCM stands for Safety, Quality, Delivery, Cost, and Morale—five critical metrics that help teams monitor and improve their performance. It provides a structured framework to assess and drive improvement in key areas that impact the success of any organisation. For frontline teams, understanding and applying SQDCM effectively can significantly enhance productivity, safety, and overall performance.
The Importance of Proper Training
Training frontline teams on how to use SQDCM effectively is essential for ensuring that they are equipped to manage tasks efficiently and align their efforts with company goals. Proper training ensures that team members understand the importance of each metric and how their actions can directly influence safety, quality, delivery, cost, and morale. When teams are well-trained, they are more likely to contribute to continuous improvement and deliver better results.
Key Steps in Training Frontline Teams
Effective training begins with clear communication. Start by explaining the relevance of each SQDCM metric in a way that is easy for everyone to understand. Use real-life examples to demonstrate how small improvements in one area can positively impact others. Next, provide hands-on training using visual tools such as boards or charts, which help make the SQDCM process more tangible and accessible. Encourage team members to actively engage with these tools during daily operations.
Fostering a Continuous Improvement Mindset
To ensure the success of SQDCM, frontline teams must be encouraged to adopt a continuous improvement mindset. Training should emphasise problem-solving and decision-making skills, allowing team members to identify issues early and take proactive steps to resolve them. Regular reviews of performance metrics and team feedback sessions will help reinforce this approach and keep everyone motivated to improve.
Digitising Your SQDCM Board: Benefits and Best Practices
Why Digitise Your SQDCM Board?
Digitising your SQDCM (Safety, Quality, Delivery, Cost, and Morale) board offers several advantages for organisations looking to streamline their operations and improve performance. A digital version makes it easier to track key metrics in real-time, update information instantly, and share progress with the team. With a digital board, you can move away from paper-based systems, which can be time-consuming and prone to errors. The ability to access your board from multiple devices ensures that your team stays aligned and can quickly respond to changes or issues.
Improved Visibility and Accessibility
One of the main benefits of a digital SQDCM board is improved visibility. Team members and managers can access the board from anywhere, making it easy to keep track of tasks and progress. Whether working remotely or in the office, everyone has access to the most up-to-date information. This transparency fosters accountability, as it’s clear which tasks are on track and which require attention.
Real-Time Updates and Instant Communication
Digital boards allow for instant updates, so changes to tasks or metrics can be made in real-time. This ensures that everyone has the same information and can act quickly when issues arise. Additionally, digital systems often have built-in communication features, such as comments or alerts, which make it easier for teams to discuss problems and solutions without leaving the platform.
Best Practices for Digitising Your SQDCM Board
When digitising your SQDCM board, it’s important to keep things simple and intuitive. Ensure that the board is user-friendly and that team members are trained on how to use it effectively. Customise the board to reflect your specific workflow and key performance indicators (KPIs). Regularly review and update the board to keep it aligned with your goals, and make use of automated notifications to stay on top of changes.
Using Visual Metrics to Drive Lean Culture and Employee Engagement
What Are Visual Metrics?
Visual metrics are simple, graphical representations of key performance indicators (KPIs) that help teams track progress and performance at a glance. These visual tools, such as charts, graphs, and dashboards, make complex data easy to understand and accessible to everyone, from frontline workers to management. In a lean culture, visual metrics play a crucial role in fostering transparency and continuous improvement.
Why Visual Metrics Matter in Lean Culture
Lean culture is centred around the idea of reducing waste, improving processes, and delivering value to customers. Visual metrics make these principles easier to implement and sustain. By using visuals to track safety, quality, delivery, cost, and morale, teams can quickly identify areas for improvement and focus their efforts on what matters most. These metrics are not only a reflection of progress but also serve as constant reminders of goals and performance standards.
Boosting Employee Engagement with Visual Metrics
When employees can easily see how their work contributes to the overall success of the organisation, it boosts engagement and morale. Visual metrics make it clear how individual actions impact team and company performance. By involving employees in tracking these metrics, they become more invested in the success of the business, fostering a sense of ownership and accountability. Additionally, seeing real-time progress can motivate employees to make improvements and celebrate achievements.
Best Practices for Using Visual Metrics
To get the most out of visual metrics, make sure they are easy to understand and regularly updated. Display them in common areas where all team members can see them, ensuring they remain top of mind. Encourage open discussions about the metrics, and use them to drive problem-solving and decision-making. This approach will keep the lean culture thriving and employee engagement high.
Common Mistakes to Avoid When Implementing Visual SQDCM Boards
1. Overcomplicating the Design
One of the most common mistakes when implementing a visual SQDCM board is making it too complicated. The purpose of an SQDCM board is to provide clarity and focus. If the design becomes overly complex, with too many metrics or unnecessary details, it can confuse the team instead of helping. Keep the board simple and intuitive, highlighting only the key metrics that matter most to the team’s performance, such as safety, quality, delivery, cost, and morale.
2. Lack of Regular Updates
Another mistake is neglecting to update the SQDCM board regularly. A visual board is only effective if it reflects the most current information. Failing to update it can result in outdated data, leading to misinformed decisions and reduced accountability. Set a routine for updating the board, whether it’s daily or weekly, depending on the needs of your team. This ensures that the board remains relevant and useful for decision-making.
3. Not Involving the Team
Implementing a visual SQDCM board without involving the team is a significant mistake. The board should be a collaborative tool that everyone uses to track progress and identify areas for improvement. If team members don’t understand the purpose or how to interact with the board, it becomes ineffective. Train your team on how to use the board, encourage feedback, and make sure they take ownership of the process.
4. Ignoring the Human Element
While a visual board is a tool for tracking metrics, it’s essential not to ignore the human aspect. Morale, for example, is a key component of SQDCM, but it’s not always easy to measure visually. Make sure that your board reflects both quantitative data and qualitative insights, ensuring a balance between performance metrics and team wellbeing.