FCIL Board
The FCIL Performance Board is a visual management tool used to track and communicate performance across four key strategic pillars: Financial, Customer, Internal Processes, and Learning & Growth. This framework helps teams across FCIL align daily activities with long-term organisational goals, identify performance gaps quickly, and drive continuous improvement through focused, data-driven insights.
1. Financial
Monitors FCIL’s financial performance by tracking key metrics such as revenue, operating costs, budget adherence, and cost-saving initiatives. This pillar ensures financial sustainability and supports sound decision-making aimed at long-term profitability and efficiency.
2. Customer
Captures customer-related metrics, including satisfaction scores, complaint resolution rates, delivery performance, and service quality. This section reinforces FCIL’s commitment to delivering value, building trust, and exceeding customer expectations across all touchpoints.
3. Internal Processes
Assesses the effectiveness and efficiency of FCIL’s internal operations by monitoring process compliance, productivity, lead times, and innovation efforts. This area supports continuous improvement and operational excellence across departments and functions.
4. Learning and Growth
Tracks the development of FCIL’s workforce through metrics such as training completion, skill advancement, employee engagement, and leadership development. This pillar ensures that the organisation builds a capable, agile, and future-ready team to support strategic objectives.
Book Free Demo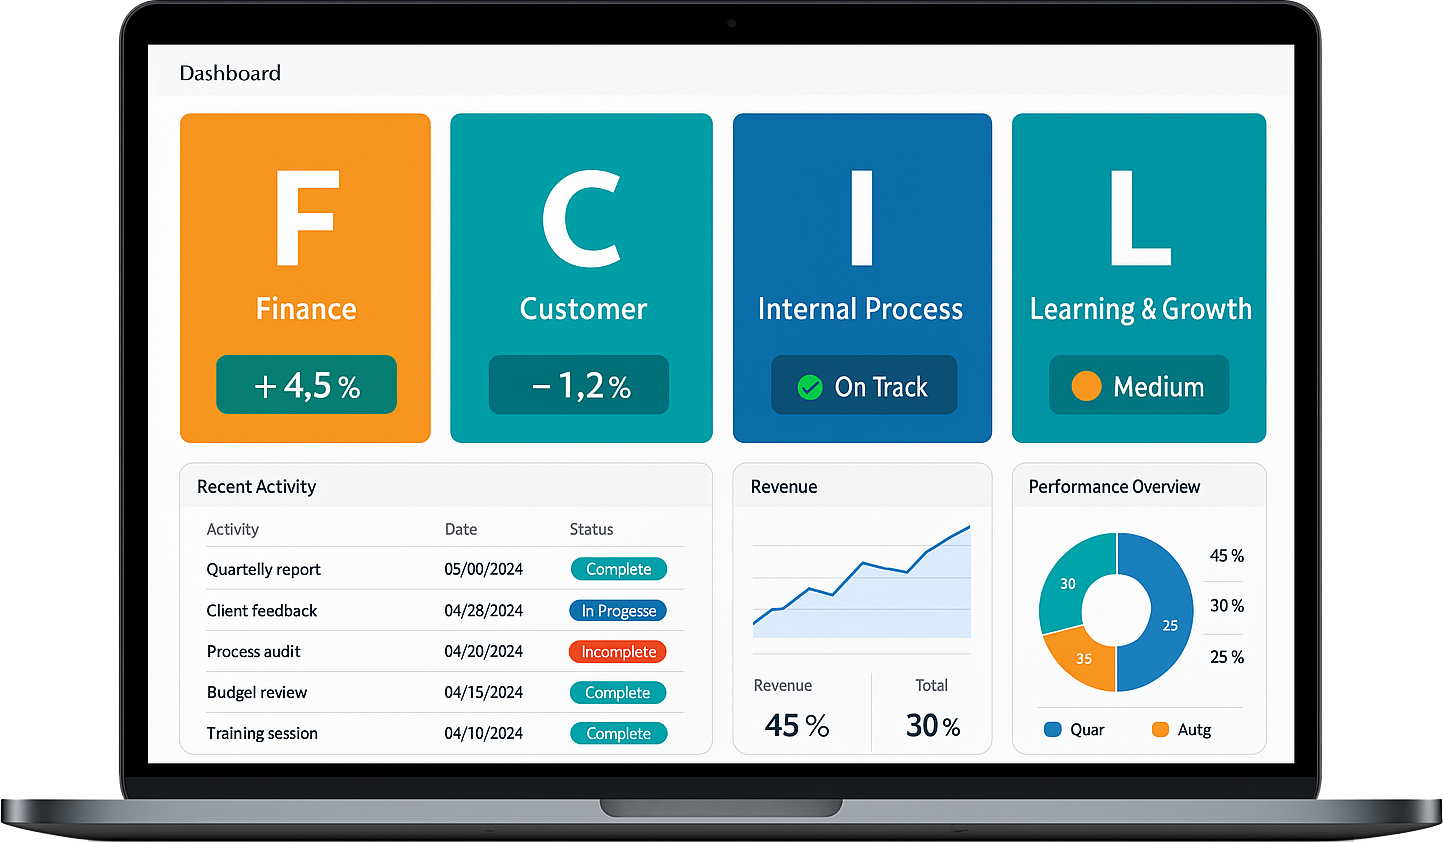
SQDCP Board
An SQDCP Board is a visual management tool used to track and communicate performance across five critical operational categories: Safety, Quality, Delivery, Cost, and People. Widely used in manufacturing, logistics, and project environments, the SQDCP Board helps teams align with daily operational goals, identify issues quickly, and drive continuous improvement in a structured, visible manner.
1. Safety
Monitors workplace safety metrics such as incidents, near misses, hazard reports, and compliance with safety protocols. This section ensures a proactive focus on creating and maintaining a safe working environment.
2. Quality
Tracks quality indicators like defect rates, first-pass yield, rework cases, and customer complaints. It helps teams uphold product and process quality standards and resolve quality-related issues promptly.
3. Delivery
Displays key delivery metrics such as on-time delivery performance, schedule adherence, lead times, and production output. It ensures teams stay focused on meeting delivery commitments and maintaining operational flow.
4. Cost
Captures cost performance, including waste reduction, cost-saving initiatives, material usage, and efficiency indicators. This section supports financial discipline while promoting continuous improvement efforts.
5. People
Highlights workforce engagement, training participation, cross-skilling, absenteeism, and team involvement in improvement activities. It reinforces the value of employee development and participation in achieving operational excellence.
Book Free Demo
SQDCM Board
An SQDCM Board is a visual management tool used to monitor and communicate performance across five essential operational pillars: Safety, Quality, Delivery, Cost, and Morale. Commonly implemented in manufacturing and service environments, the SQDCM Board enables teams to stay aligned with daily performance targets, quickly identify problems, and promote continuous improvement through transparent, structured updates.
1. Safety
Tracks safety performance metrics such as incident rates, near misses, hazard identification, and adherence to safety standards. This area keeps workplace safety top of mind and promotes a culture of proactive risk prevention.
2. Quality
Monitors product or service quality indicators, including defects, errors, rework, and customer complaints. This section supports efforts to maintain high standards and drive improvements in process consistency and output quality.
3. Delivery
Displays metrics related to delivery performance, such as on-time delivery, lead times, schedule adherence, and throughput. It helps ensure that operations meet customer expectations for timely service and delivery.
4. Cost
Highlights cost efficiency indicators such as material usage, production costs, scrap rates, and savings initiatives. This section encourages cost-conscious behavior and identifies areas for financial improvement without sacrificing performance.
5. Morale
Focuses on employee morale through metrics like team feedback, engagement levels, recognition activities, and workplace satisfaction. It promotes a positive work environment and supports initiatives aimed at boosting motivation and well-being.
Book Free Demo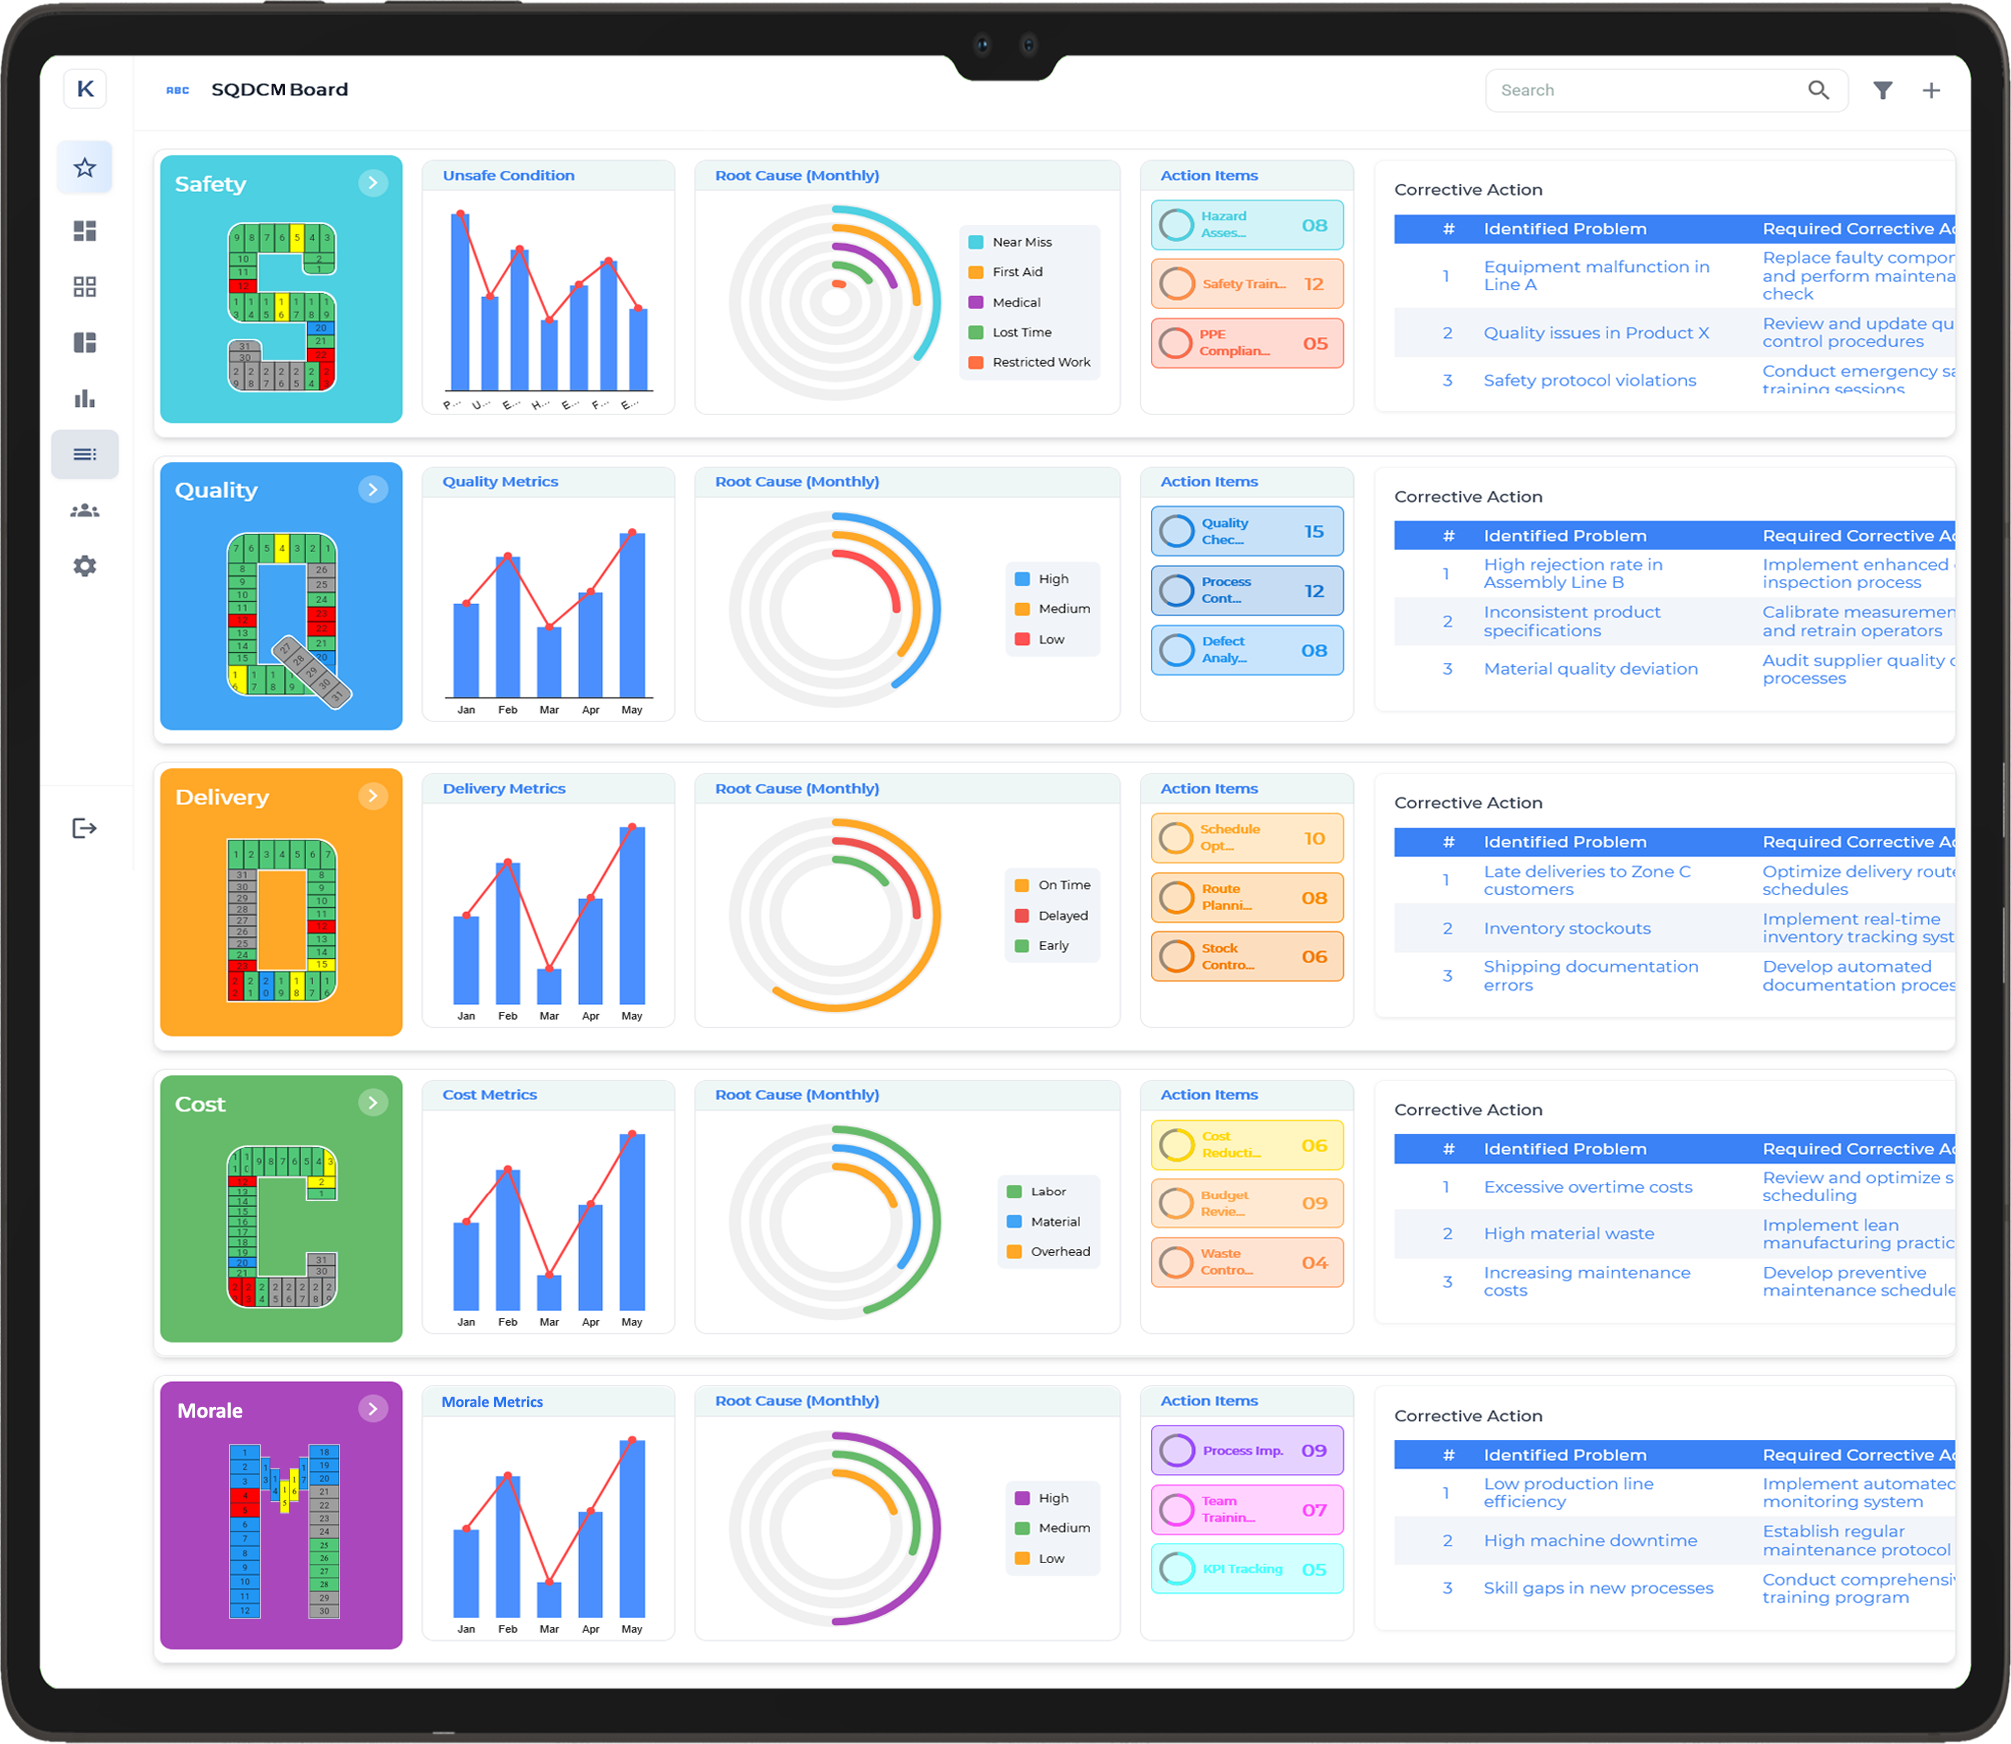
SQDCL Board
An SQDCL Board is a visual management tool used to track and communicate performance across five key operational pillars: Safety, Quality, Delivery, Cost, and Lean. Commonly implemented in manufacturing and service environments, the SQDCL Board helps teams align with daily performance targets, identify issues quickly, and foster a culture of continuous improvement through structured updates focused on Lean principles.
1. Safety
Tracks safety performance metrics such as incident rates, near misses, hazard identification, and compliance with safety protocols. This area ensures a proactive focus on creating and maintaining a safe working environment, essential for team well-being and operational success.
2. Quality
Monitors product or service quality indicators, including defect rates, errors, rework, and customer complaints. This section helps maintain high-quality standards and focuses on reducing variation and improving consistency in processes.
3. Delivery
Displays key delivery metrics such as on-time performance, lead times, schedule adherence, and throughput. It ensures that teams stay focused on meeting delivery commitments and maintaining customer satisfaction through timely service and product delivery.
4. Cost
Captures cost-related metrics, including material usage, production costs, waste, and savings initiatives. This section encourages a focus on cost efficiency while maintaining performance standards, helping the organisation balance quality with financial discipline.
5. Lean
Focuses on Lean principles such as waste reduction, process optimisation, continuous improvement, and employee empowerment. This section tracks efforts to eliminate non-value-added activities, improve flow, and foster a culture of problem-solving and innovation, aligning the team with Lean thinking to drive operational excellence.
Book Free Demo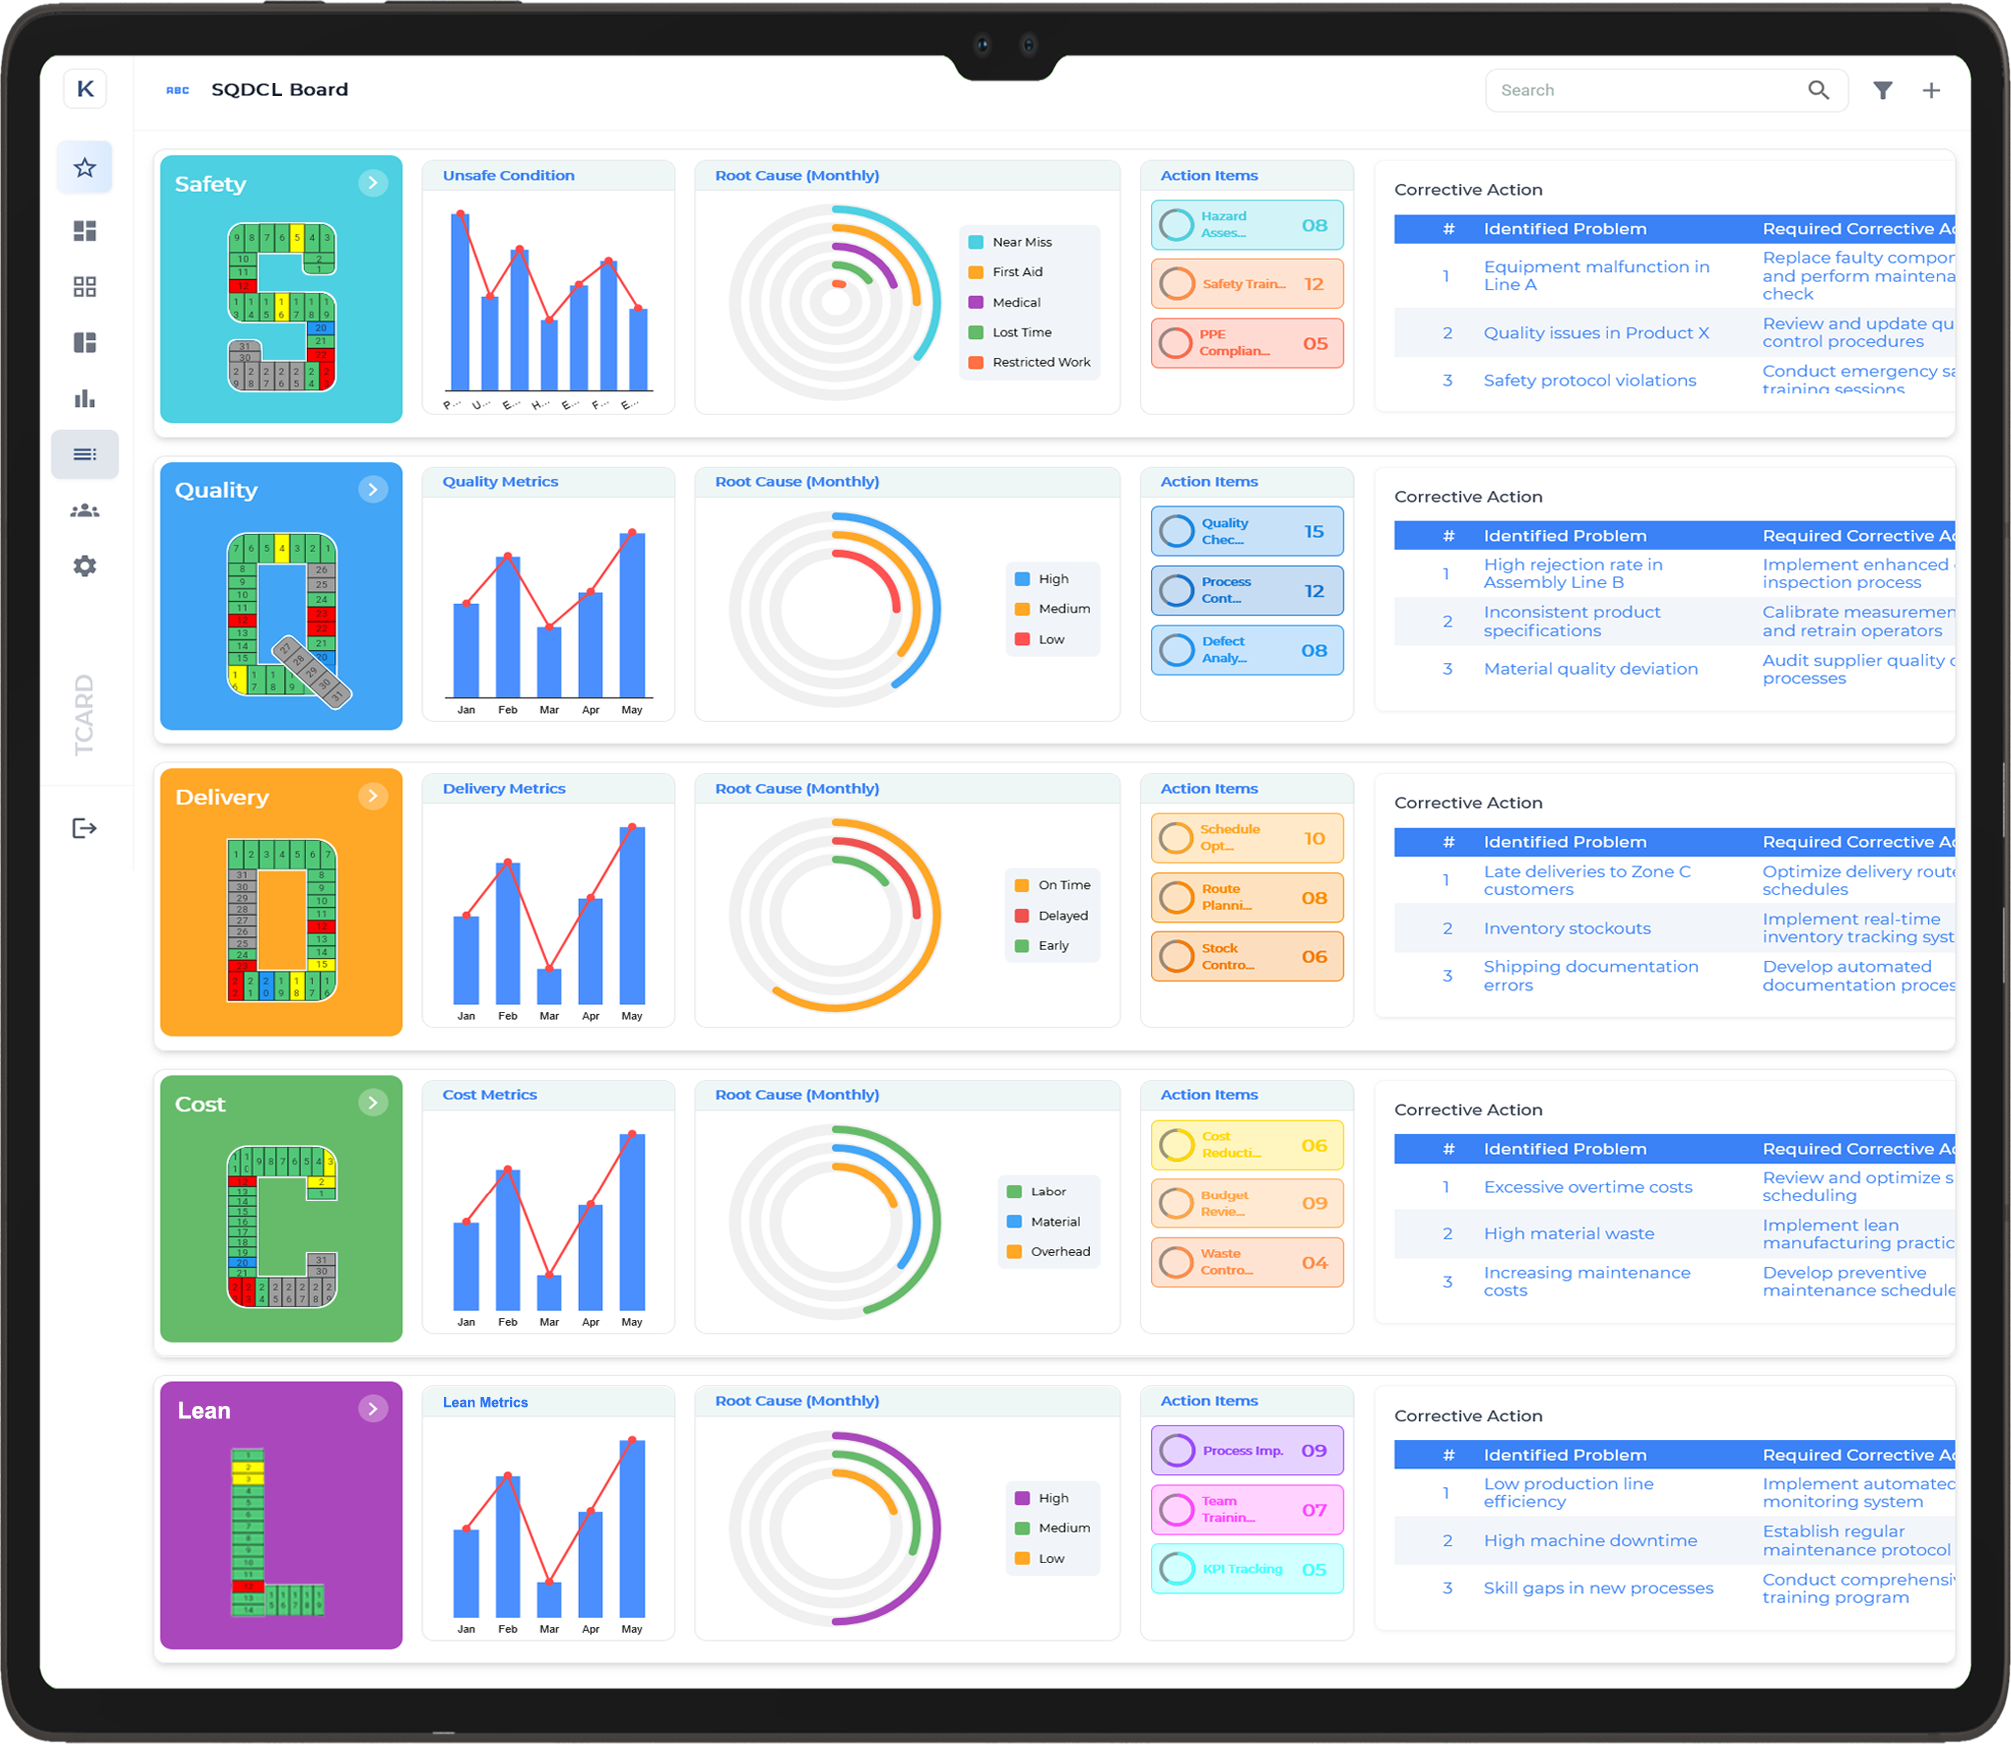
SQDCI Board
An SQDCI Board is a visual management tool used to track and communicate performance across five key operational pillars: Safety, Quality, Delivery, Cost, and Inventory. Widely used in manufacturing and service environments, the SQDCI Board helps teams align with daily performance targets, quickly identify issues, and maintain operational efficiency through structured updates focused on inventory management and cost control.
1. Safety
Tracks safety performance metrics such as incident rates, near misses, hazard identification, and compliance with safety protocols. This area ensures that safety remains a top priority, fostering a culture of risk prevention and ensuring the well-being of all team members.
2. Quality
Monitors product or service quality indicators, such as defect rates, errors, rework, and customer complaints. This section helps maintain consistent quality standards and supports continuous improvement efforts to reduce defects and improve overall process stability.
3. Delivery
Displays delivery metrics such as on-time performance, lead times, schedule adherence, and throughput. This area ensures that teams remain focused on meeting customer expectations for timely product or service delivery, keeping operations efficient and customer satisfaction high.
4. Cost
Captures cost-related metrics, including material usage, production costs, waste, and cost-saving initiatives. This section encourages a focus on cost efficiency, ensuring financial discipline while maintaining performance standards and quality outcomes.
5. Inventory
Monitors inventory levels, stock turnover, material availability, and inventory accuracy. This section helps teams manage inventory effectively by minimising excess stock, reducing stockouts, and ensuring that the right materials are available at the right time, contributing to streamlined operations and cost management.
Book Free Demo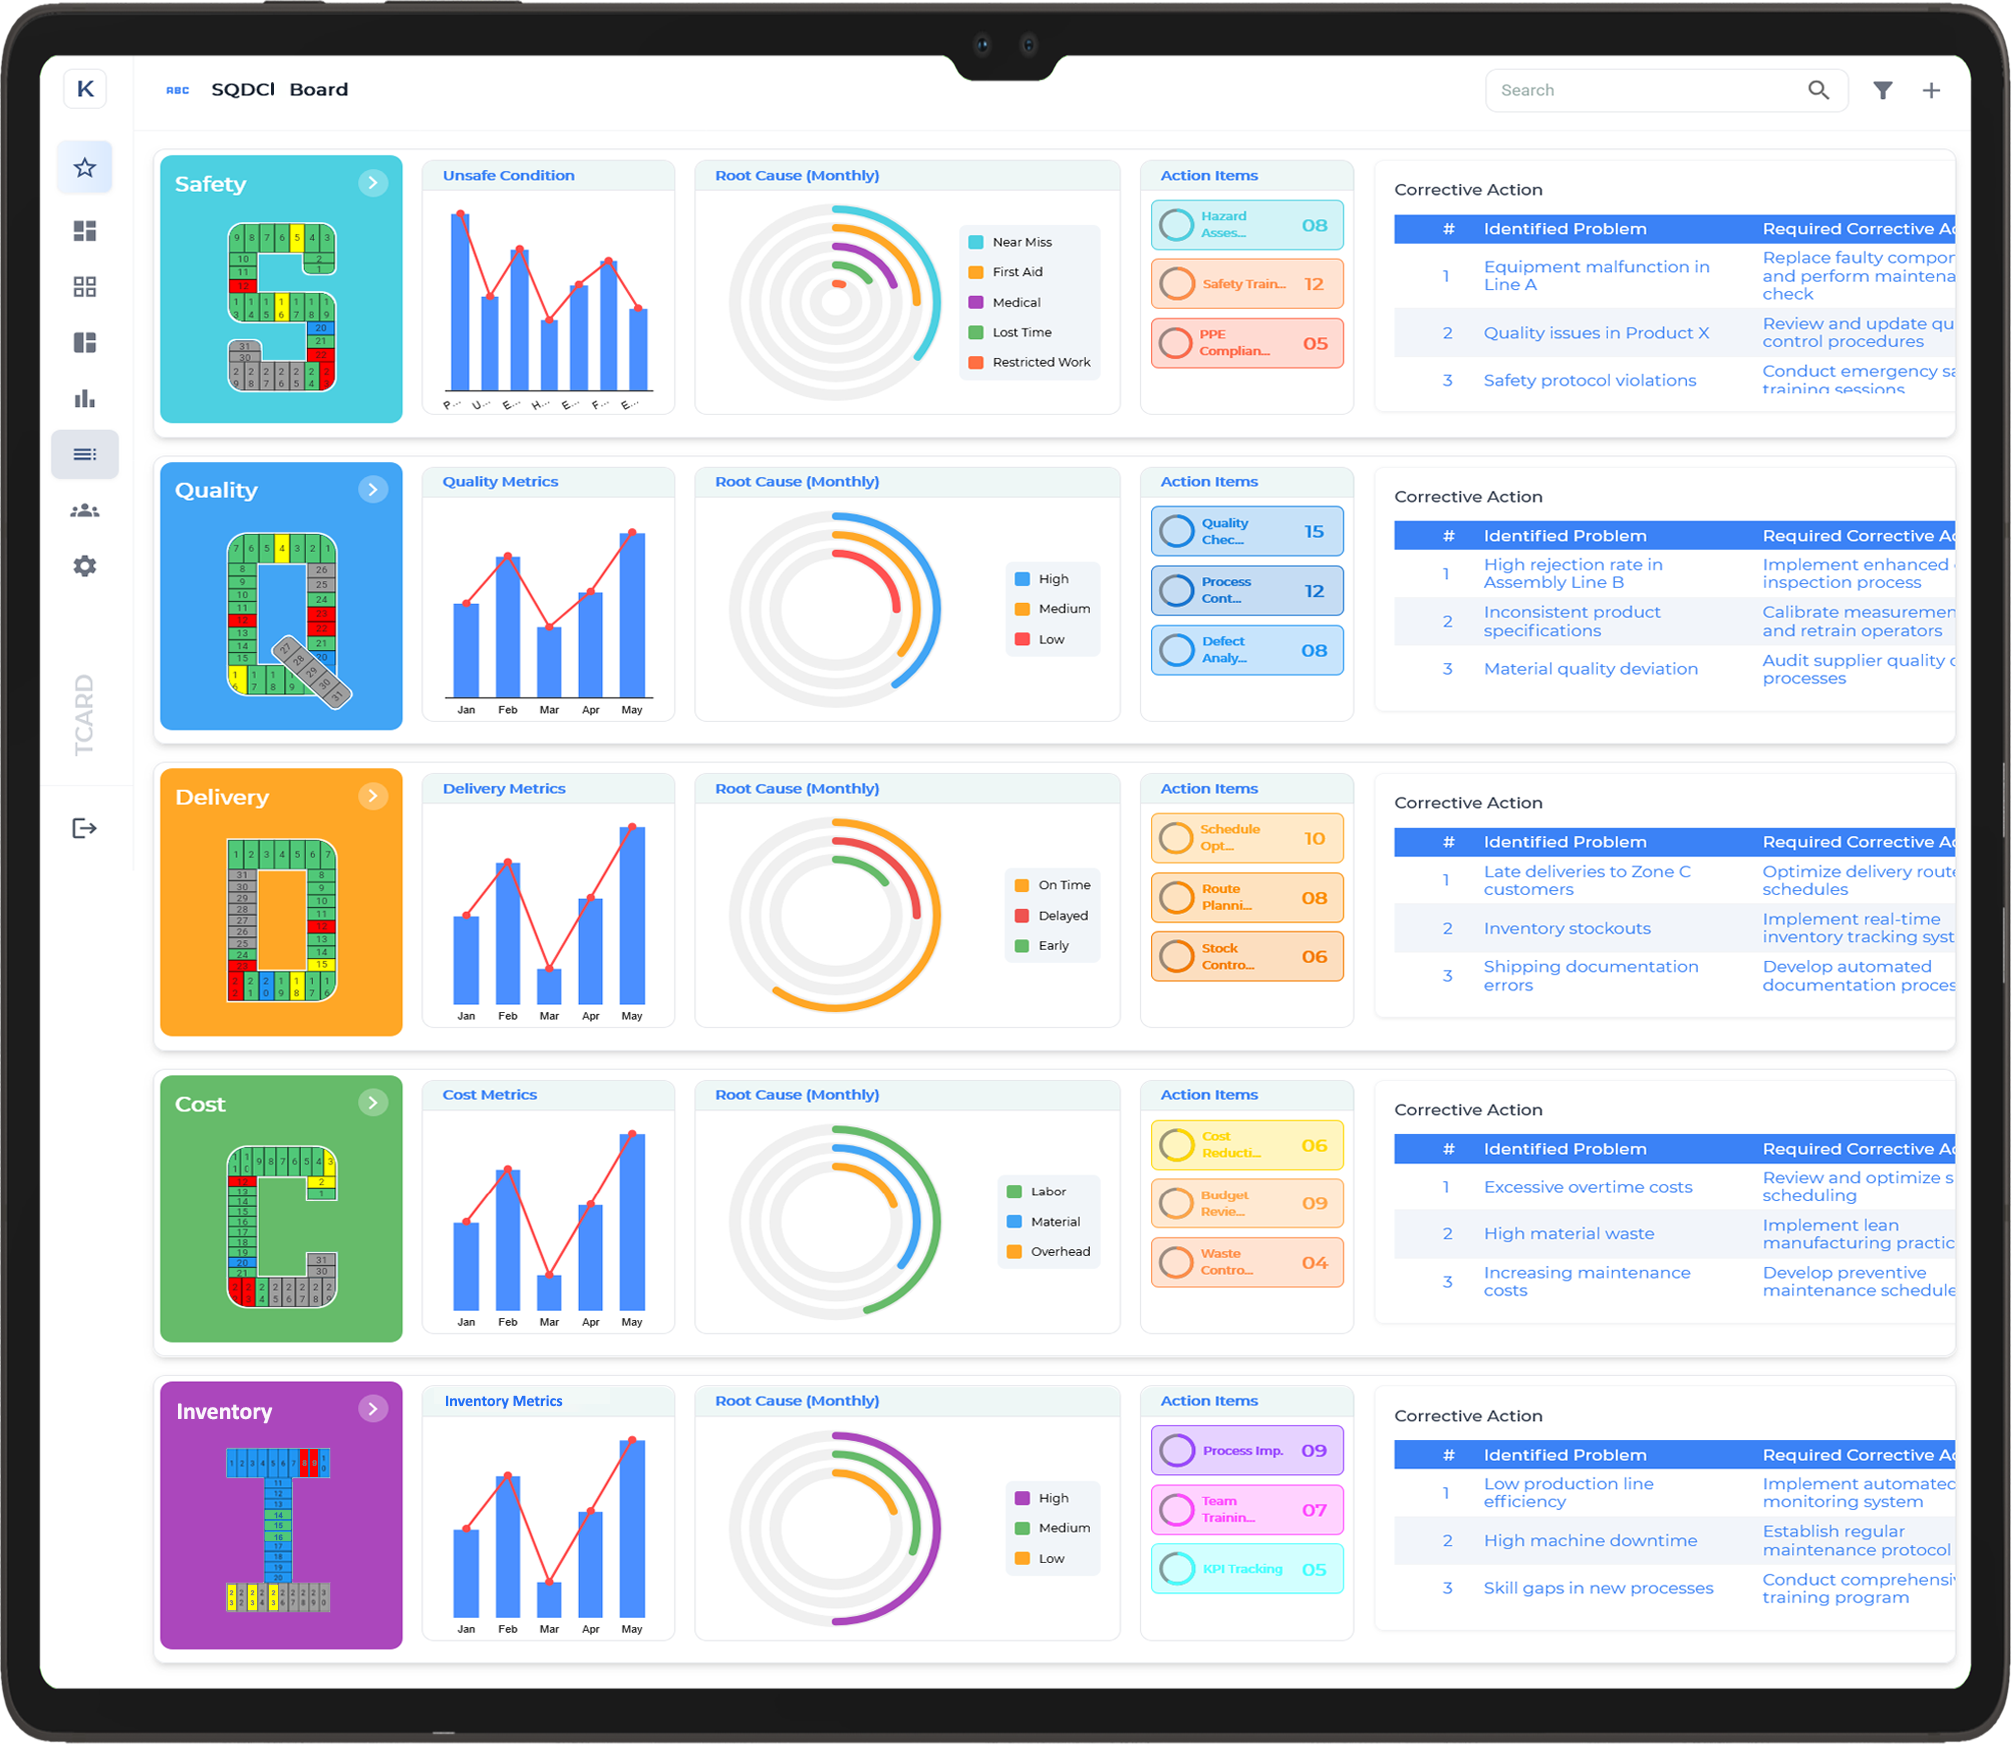
PQCDSM Board
An PQCDSM Board is a visual management tool used to track and communicate performance across six key operational pillars: Productivity, Quality, Cost, Delivery, Safety, and Morale. Commonly utilised in manufacturing and service environments, the PQCDSM Board helps teams stay aligned with performance objectives, quickly identify issues, and foster a culture of continuous improvement through transparent updates focused on both operational efficiency and employee well-being.
1. Productivity
Tracks productivity metrics such as output per unit of time, labor efficiency, and machine utilisation. This area ensures that teams are maximising their resources, improving throughput, and meeting production targets without overburdening the workforce.
2. Quality
Monitors quality indicators, including defect rates, rework, customer complaints, and first-pass yield. This section helps maintain high product or service standards, identifies areas for improvement, and ensures that quality is not compromised in the pursuit of other goals.
3. Cost
Captures cost-related metrics such as material usage, production costs, scrap rates, and cost-saving initiatives. This section promotes cost-conscious behavior, helping to control spending while maintaining operational performance and high-quality standards.
4. Delivery
Displays delivery metrics such as on-time delivery, lead times, schedule adherence, and throughput. This area ensures that the organisation meets customer expectations for timely and reliable product or service delivery, contributing to customer satisfaction and loyalty.
5. Safety
Tracks safety-related metrics, including incident rates, near misses, hazard identification, and compliance with safety protocols. This section reinforces the importance of a safe working environment, prioritising risk prevention and ensuring the health and safety of all team members.
6. Morale
Monitors employee morale through engagement levels, team feedback, recognition, and job satisfaction metrics. This section emphasises the importance of fostering a positive work environment, ensuring that employees are motivated, engaged, and actively contributing to continuous improvement efforts.
Book Free Demo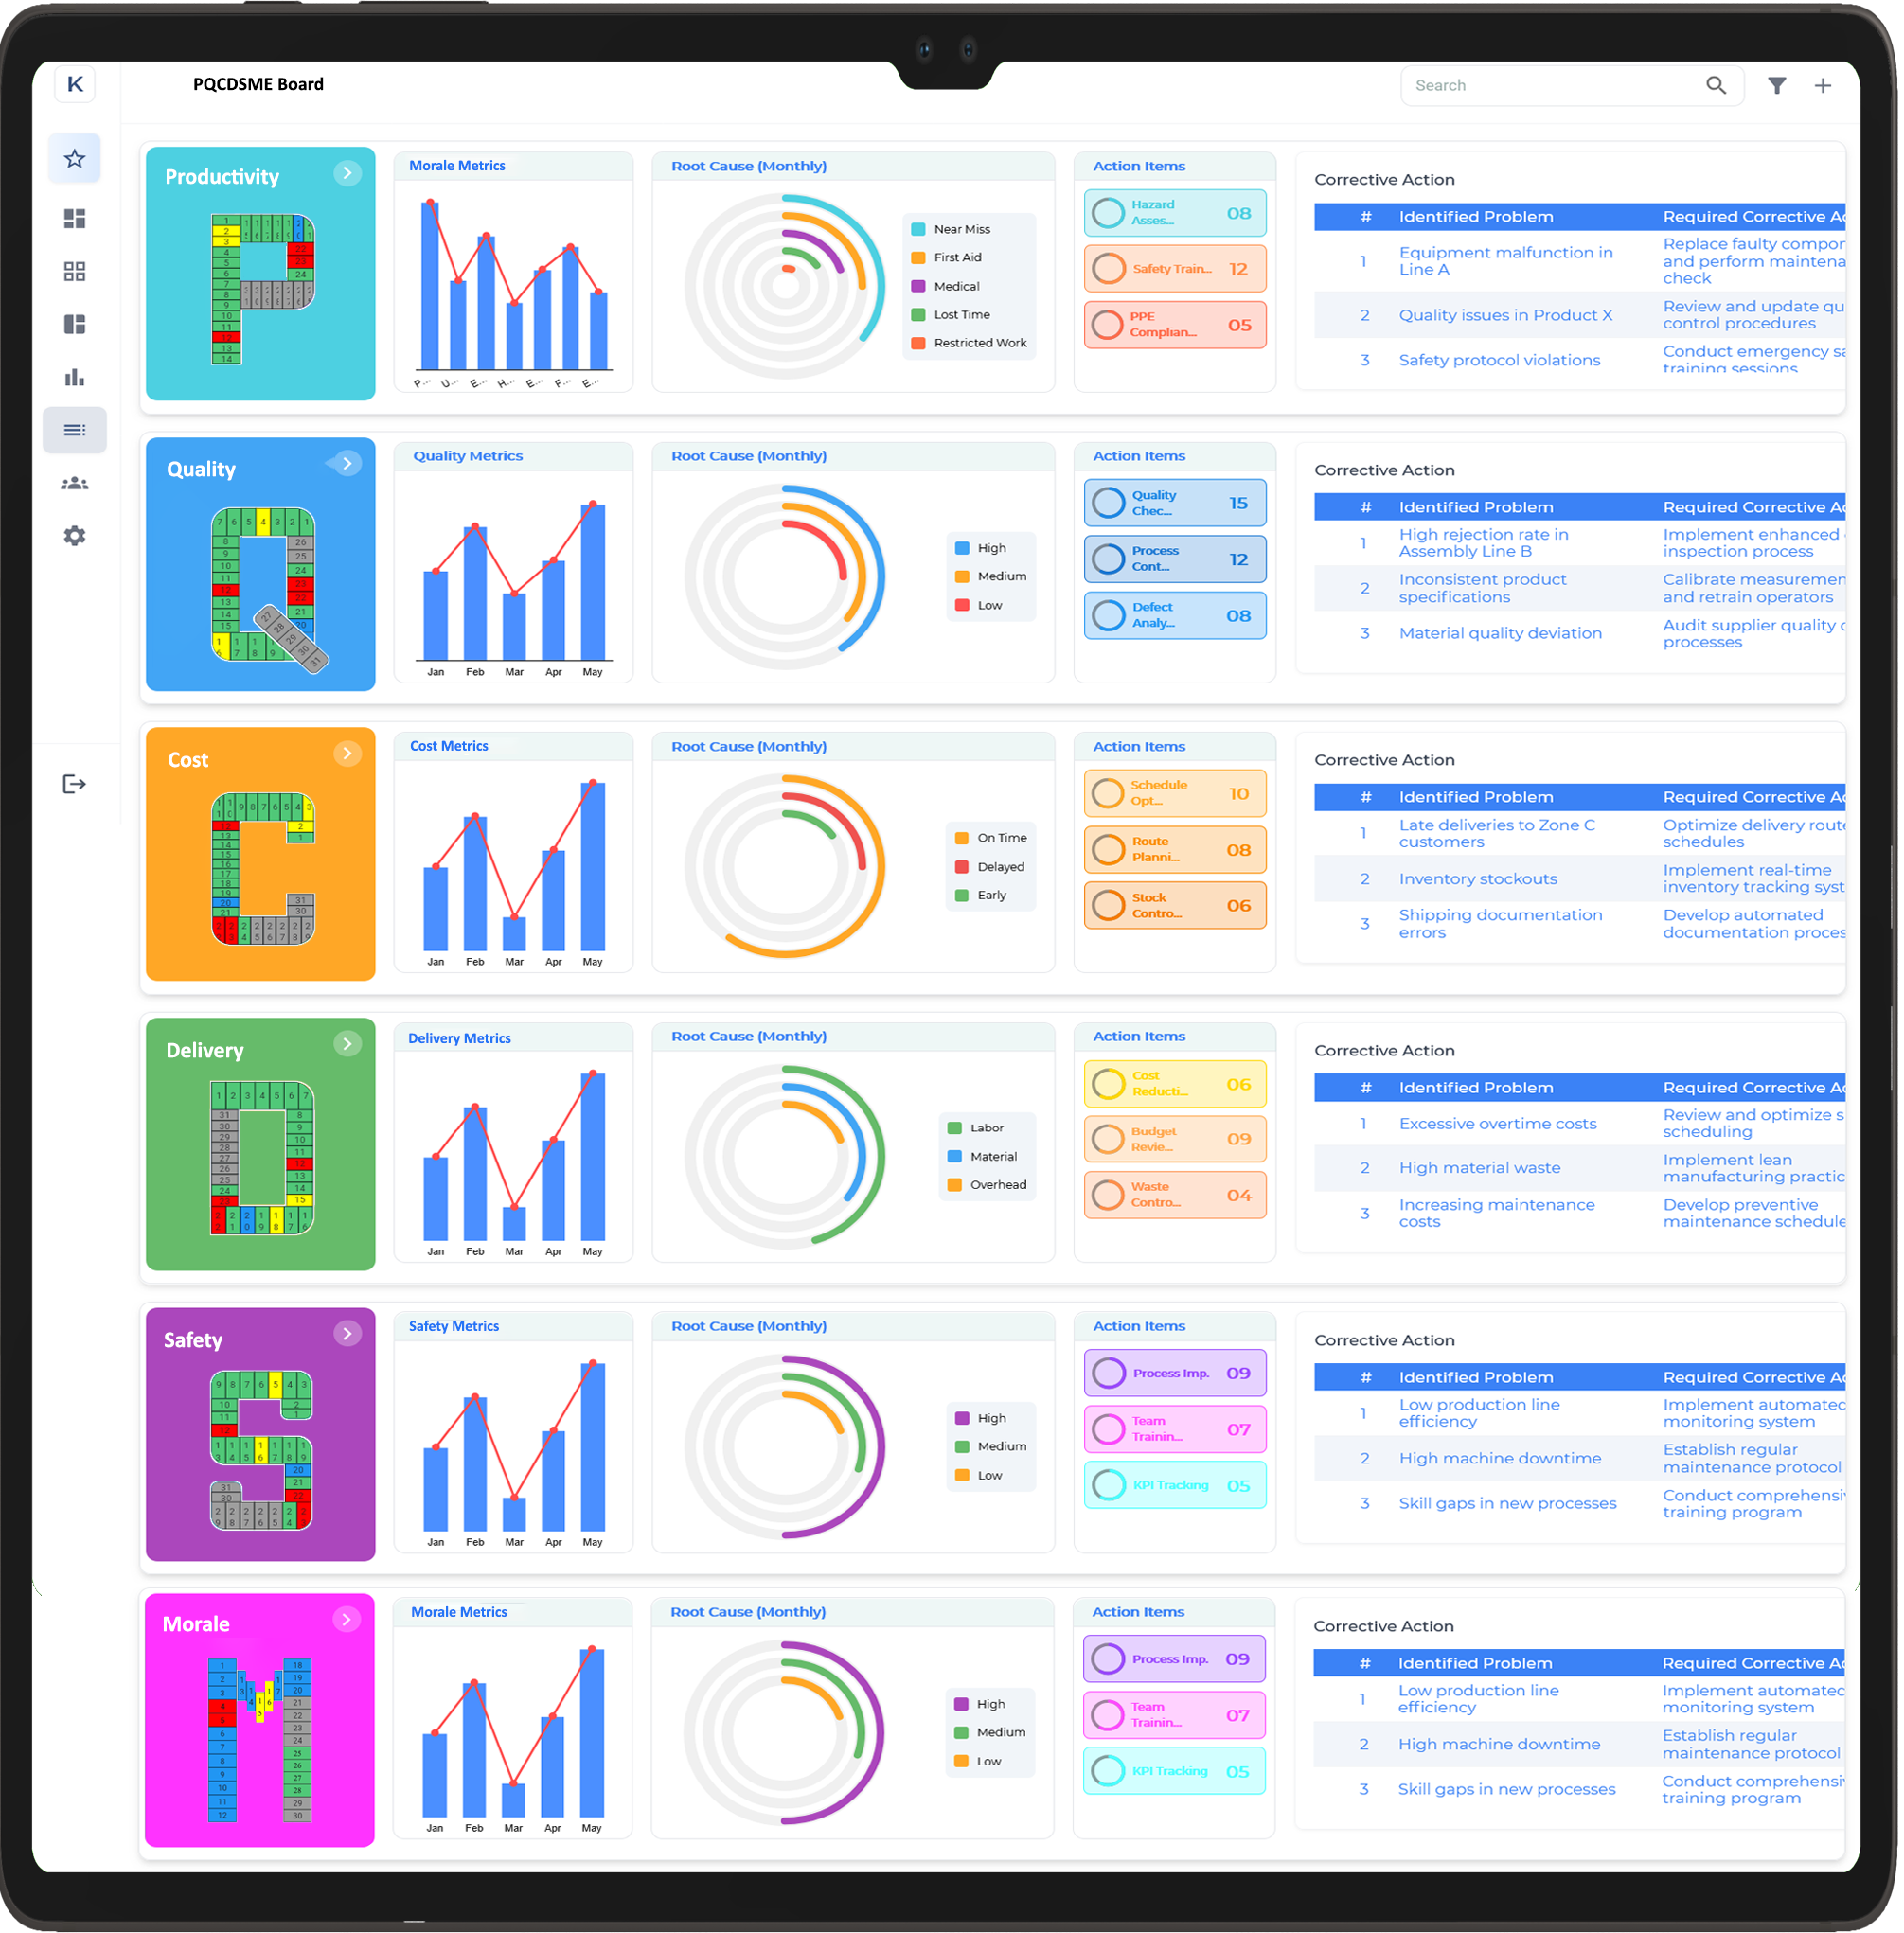
SQDCME Board
An SQDCME Board is a visual management tool used to track and communicate performance across six key operational pillars: Safety, Quality, Cost, Delivery, Morale, and Environment. Widely used in manufacturing and service environments, the SQDCME Board helps teams align with daily performance targets, quickly identify issues, and foster a culture of continuous improvement through structured updates focused on operational efficiency, employee well-being, and environmental responsibility.
1. Safety
Tracks safety-related metrics such as incident rates, near misses, hazard identification, and compliance with safety protocols. This section emphasises the importance of creating and maintaining a safe working environment, ensuring the well-being of all team members and fostering a culture of proactive risk management.
2. Quality
Monitors product or service quality indicators, including defect rates, rework, customer complaints, and first-pass yield. This section ensures that high standards of quality are upheld, drives continuous improvement, and ensures processes are in place to minimise errors and maintain consistency in output.
3. Cost
Captures cost-related metrics, such as material usage, production costs, waste, and cost-saving initiatives. This section promotes a focus on cost-efficiency, helping teams manage resources effectively while ensuring that financial discipline is maintained without compromising quality and performance.
4. Delivery
Tracks key delivery metrics, such as on-time delivery, lead times, schedule adherence, and throughput. This section ensures the organisation meets customer expectations for reliable and timely product or service delivery, which is essential for customer satisfaction and loyalty.
5. Morale
Monitors employee morale through engagement levels, team feedback, recognition, and job satisfaction metrics. This section highlights the importance of maintaining a positive workplace environment, where employees feel motivated, valued, and empowered to contribute to continuous improvement initiatives.
6. Environment
Tracks environmental performance metrics, such as waste reduction, energy efficiency, emissions, and sustainability initiatives. This section emphasises the importance of reducing the organisation's environmental footprint and implementing sustainable practices to protect the environment and promote long-term ecological responsibility.
Book Free Demo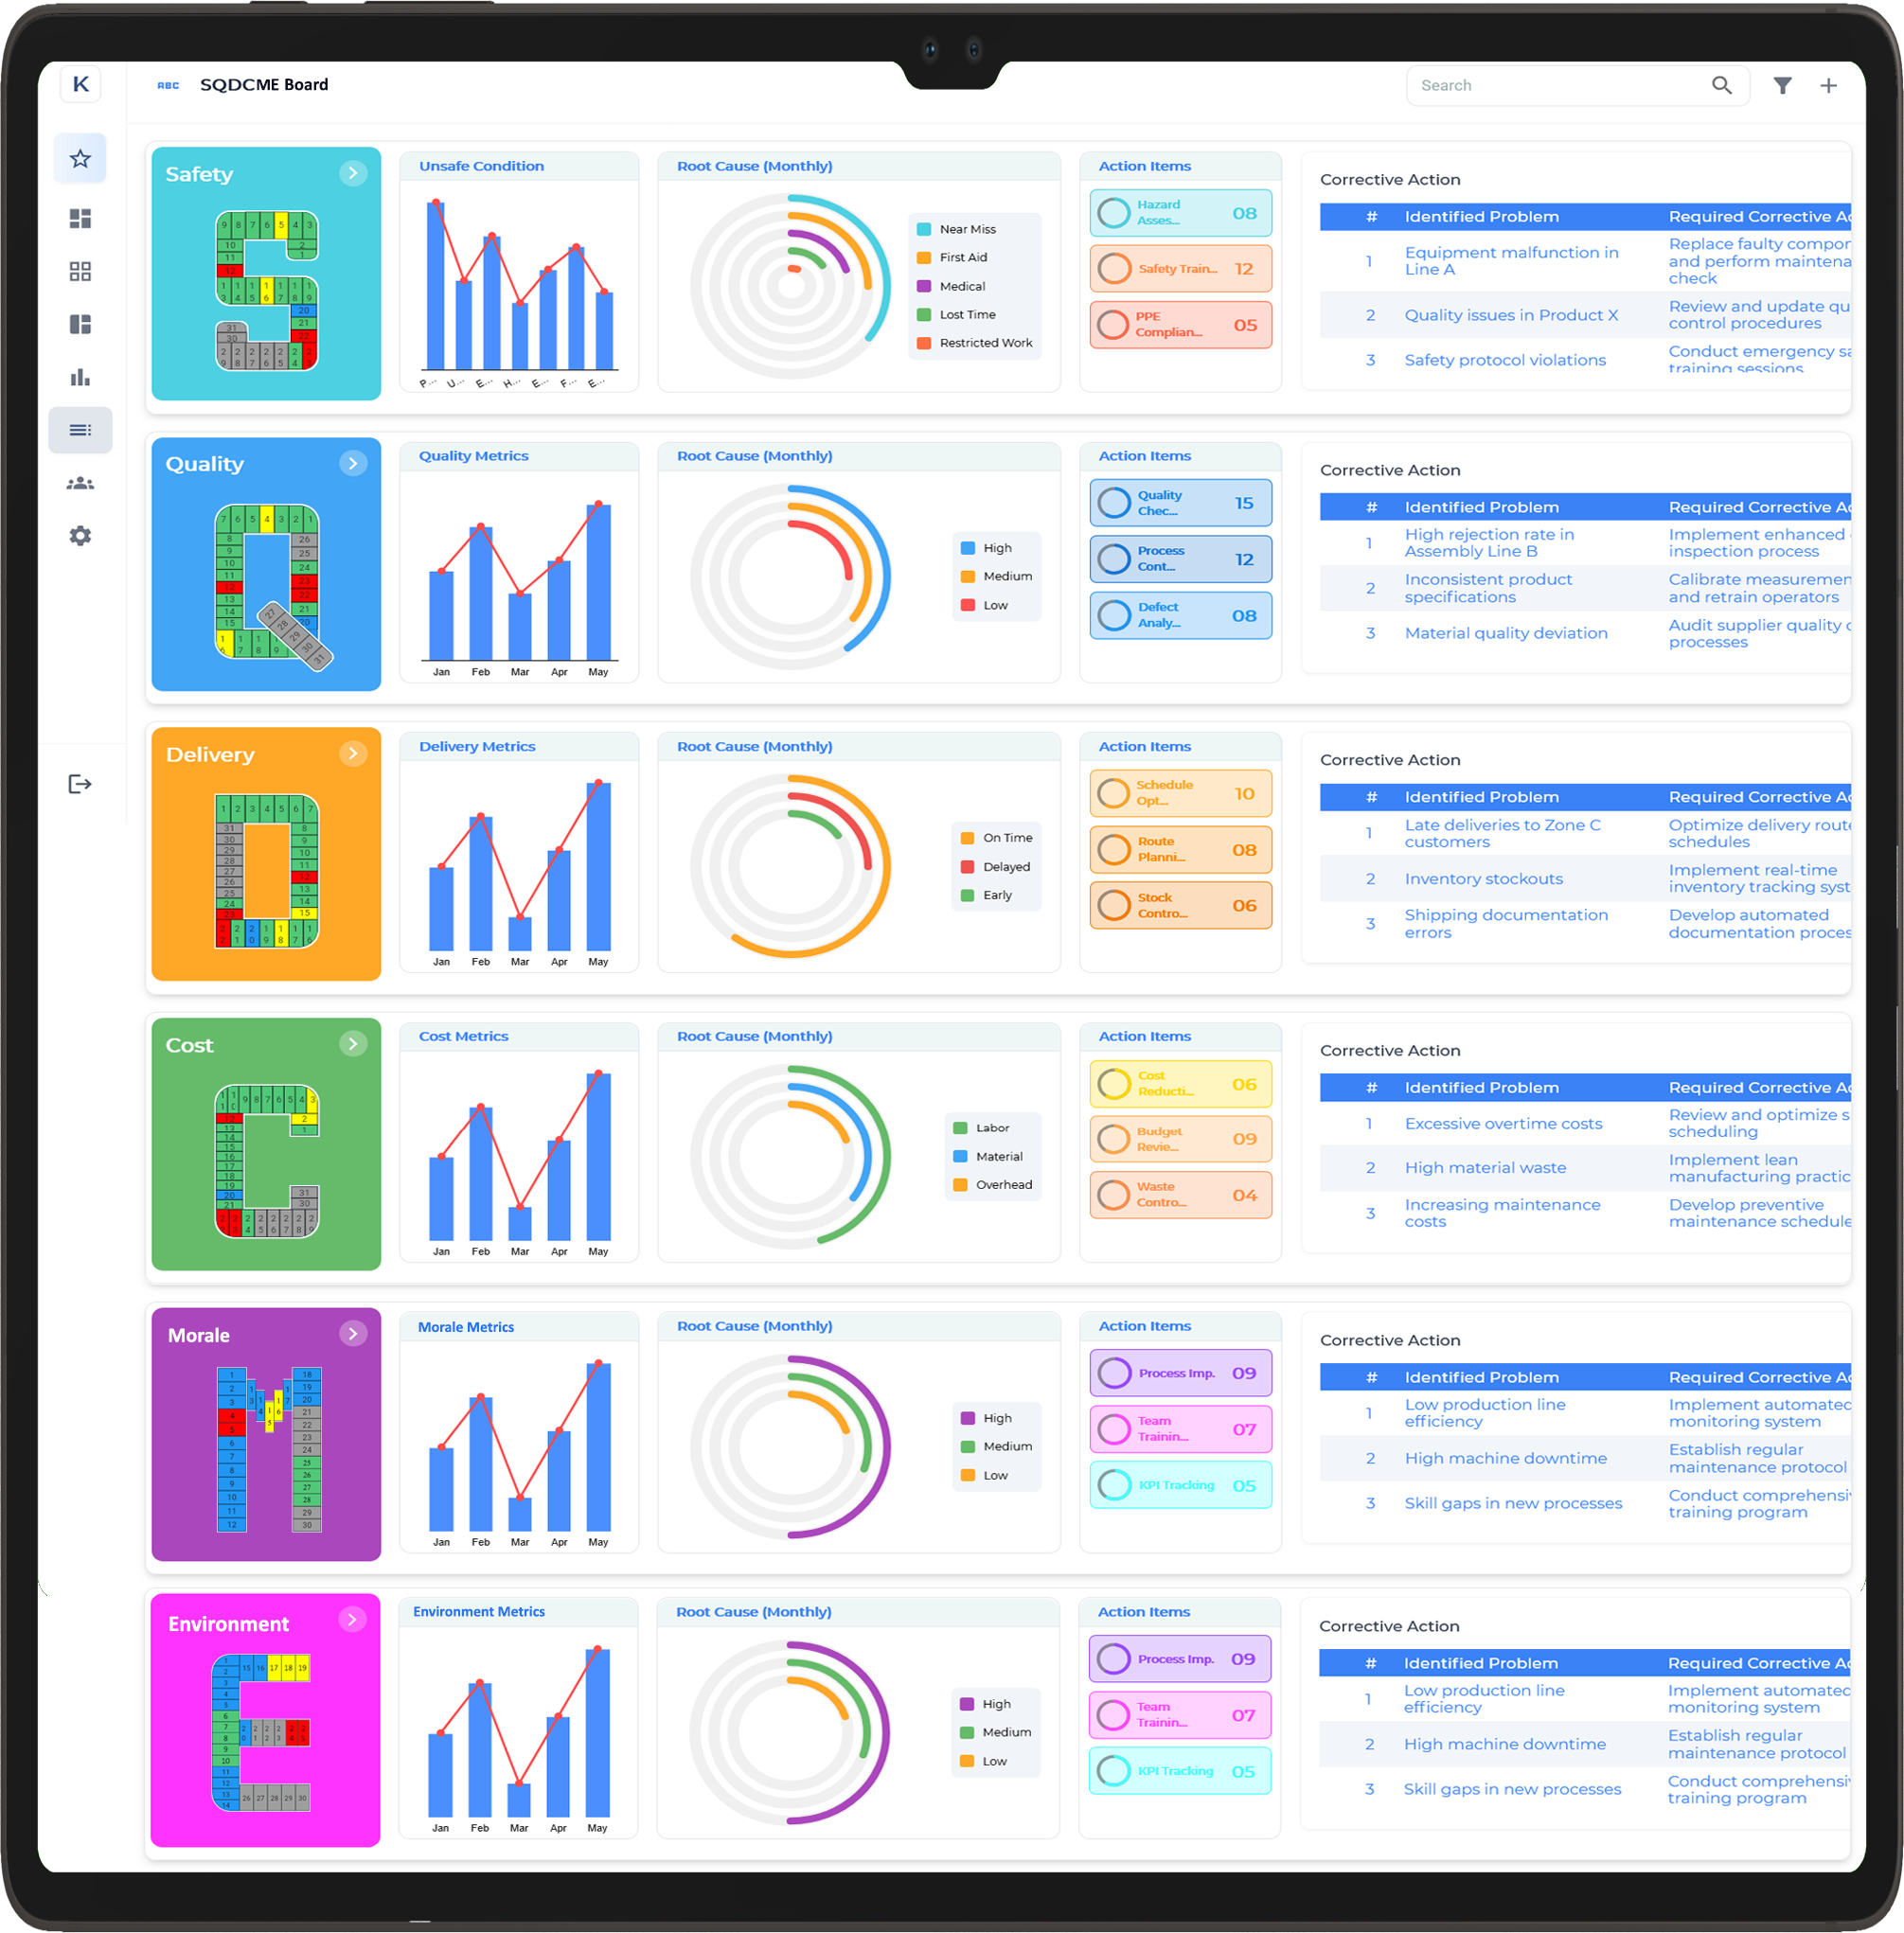
SQDIP Board
An SQDIP Board is a visual management tool used to track and communicate performance across five key operational pillars: Safety, Quality, Delivery, Inventory, and Productivity. Widely used in manufacturing and service environments, the SQDIP Board helps teams align with daily performance targets, quickly identify issues, and foster a culture of continuous improvement through structured updates focused on operational efficiency and the optimisation of resources.
1. Safety
Tracks safety-related metrics such as incident rates, near misses, hazard identification, and compliance with safety protocols. This section emphasises the importance of maintaining a safe working environment, ensuring the well-being of all team members, and fostering a proactive culture of risk prevention.
2. Quality
Monitors product or service quality indicators, including defect rates, rework, customer complaints, and first-pass yield. This section ensures that high-quality standards are upheld, drives continuous improvement, and guarantees that processes are in place to reduce defects and ensure consistency in outputs.
3. Delivery
Tracks key delivery metrics, such as on-time delivery, lead times, schedule adherence, and throughput. This section ensures the organisation meets customer expectations for timely and reliable delivery, playing a critical role in customer satisfaction and operational success.
4. Inventory
Monitors inventory metrics such as stock levels, turnover rates, material availability, and inventory accuracy. This section focuses on optimising inventory management, reducing stockouts, minimising excess inventory, and ensuring that materials are available when needed without tying up excessive capital in stock.
5. Productivity
Tracks productivity-related metrics such as output per unit of time, labor efficiency, and equipment utilisation. This section promotes resource optimisation, improving throughput, and maximising operational efficiency without overburdening staff or equipment, ensuring that production goals are consistently met.
Book Free Demo
SQDC Board
An SQDC Board is a visual management tool used to track and communicate performance across four key operational pillars: Safety, Quality, Delivery, and Cost. Widely used in manufacturing and service environments, the SQDC Board helps teams align with daily performance targets, quickly identify issues, and foster a culture of continuous improvement through structured updates focused on optimising operations, improving quality, and reducing costs.
1. Safety
Tracks safety-related metrics such as incident rates, near misses, hazard identification, and compliance with safety protocols. This section emphasises the importance of creating and maintaining a safe working environment, ensuring the well-being of all team members, and fostering a proactive approach to risk management.
2. Quality
Monitors product or service quality indicators, including defect rates, rework, customer complaints, and first-pass yield. This section ensures that high-quality standards are upheld, drives continuous improvement efforts, and guarantees that processes are in place to minimise defects and maintain consistency across outputs.
3. Delivery
Tracks key delivery metrics such as on-time performance, lead times, schedule adherence, and throughput. This section ensures that the organisation meets customer expectations for timely, reliable delivery, contributing to customer satisfaction and operational efficiency.
4. Cost
Captures cost-related metrics, such as material usage, production costs, waste, and cost-saving initiatives. This section encourages a focus on cost efficiency, ensuring financial discipline is maintained while optimising performance and upholding quality standards.
Book Free Demo
SQDP Board
An SQDP Board is a visual management tool used to track and communicate performance across four key operational pillars: Safety, Quality, Delivery, and People. Commonly used in manufacturing and service environments, the SQDP Board helps teams stay aligned with daily performance targets, quickly identify issues, and foster a culture of continuous improvement through structured updates that focus on operational excellence and the well-being of the workforce.
1. Safety
Tracks safety-related metrics such as incident rates, near misses, hazard identification, and compliance with safety protocols. This section highlights the importance of ensuring a safe working environment, prioritising the health and safety of all team members, and fostering a culture of proactive risk management and prevention.
2. Quality
Monitors quality indicators such as defect rates, rework, customer complaints, and first-pass yield. This section ensures that high-quality standards are consistently met, drives continuous improvement efforts, and puts processes in place to reduce defects and ensure the consistency of output across products or services.
3. Delivery
Tracks key delivery metrics, including on-time performance, lead times, schedule adherence, and throughput. This section focuses on ensuring that the organisation meets customer expectations by providing timely, reliable delivery of products or services, which is essential for customer satisfaction and operational success.
4. People
Monitors metrics related to workforce engagement, satisfaction, and well-being, including team feedback, training levels, and employee morale. This section underscores the importance of fostering a positive work environment, ensuring that employees are motivated, well-trained, and empowered to contribute to the organisation’s success.
Book Free Demo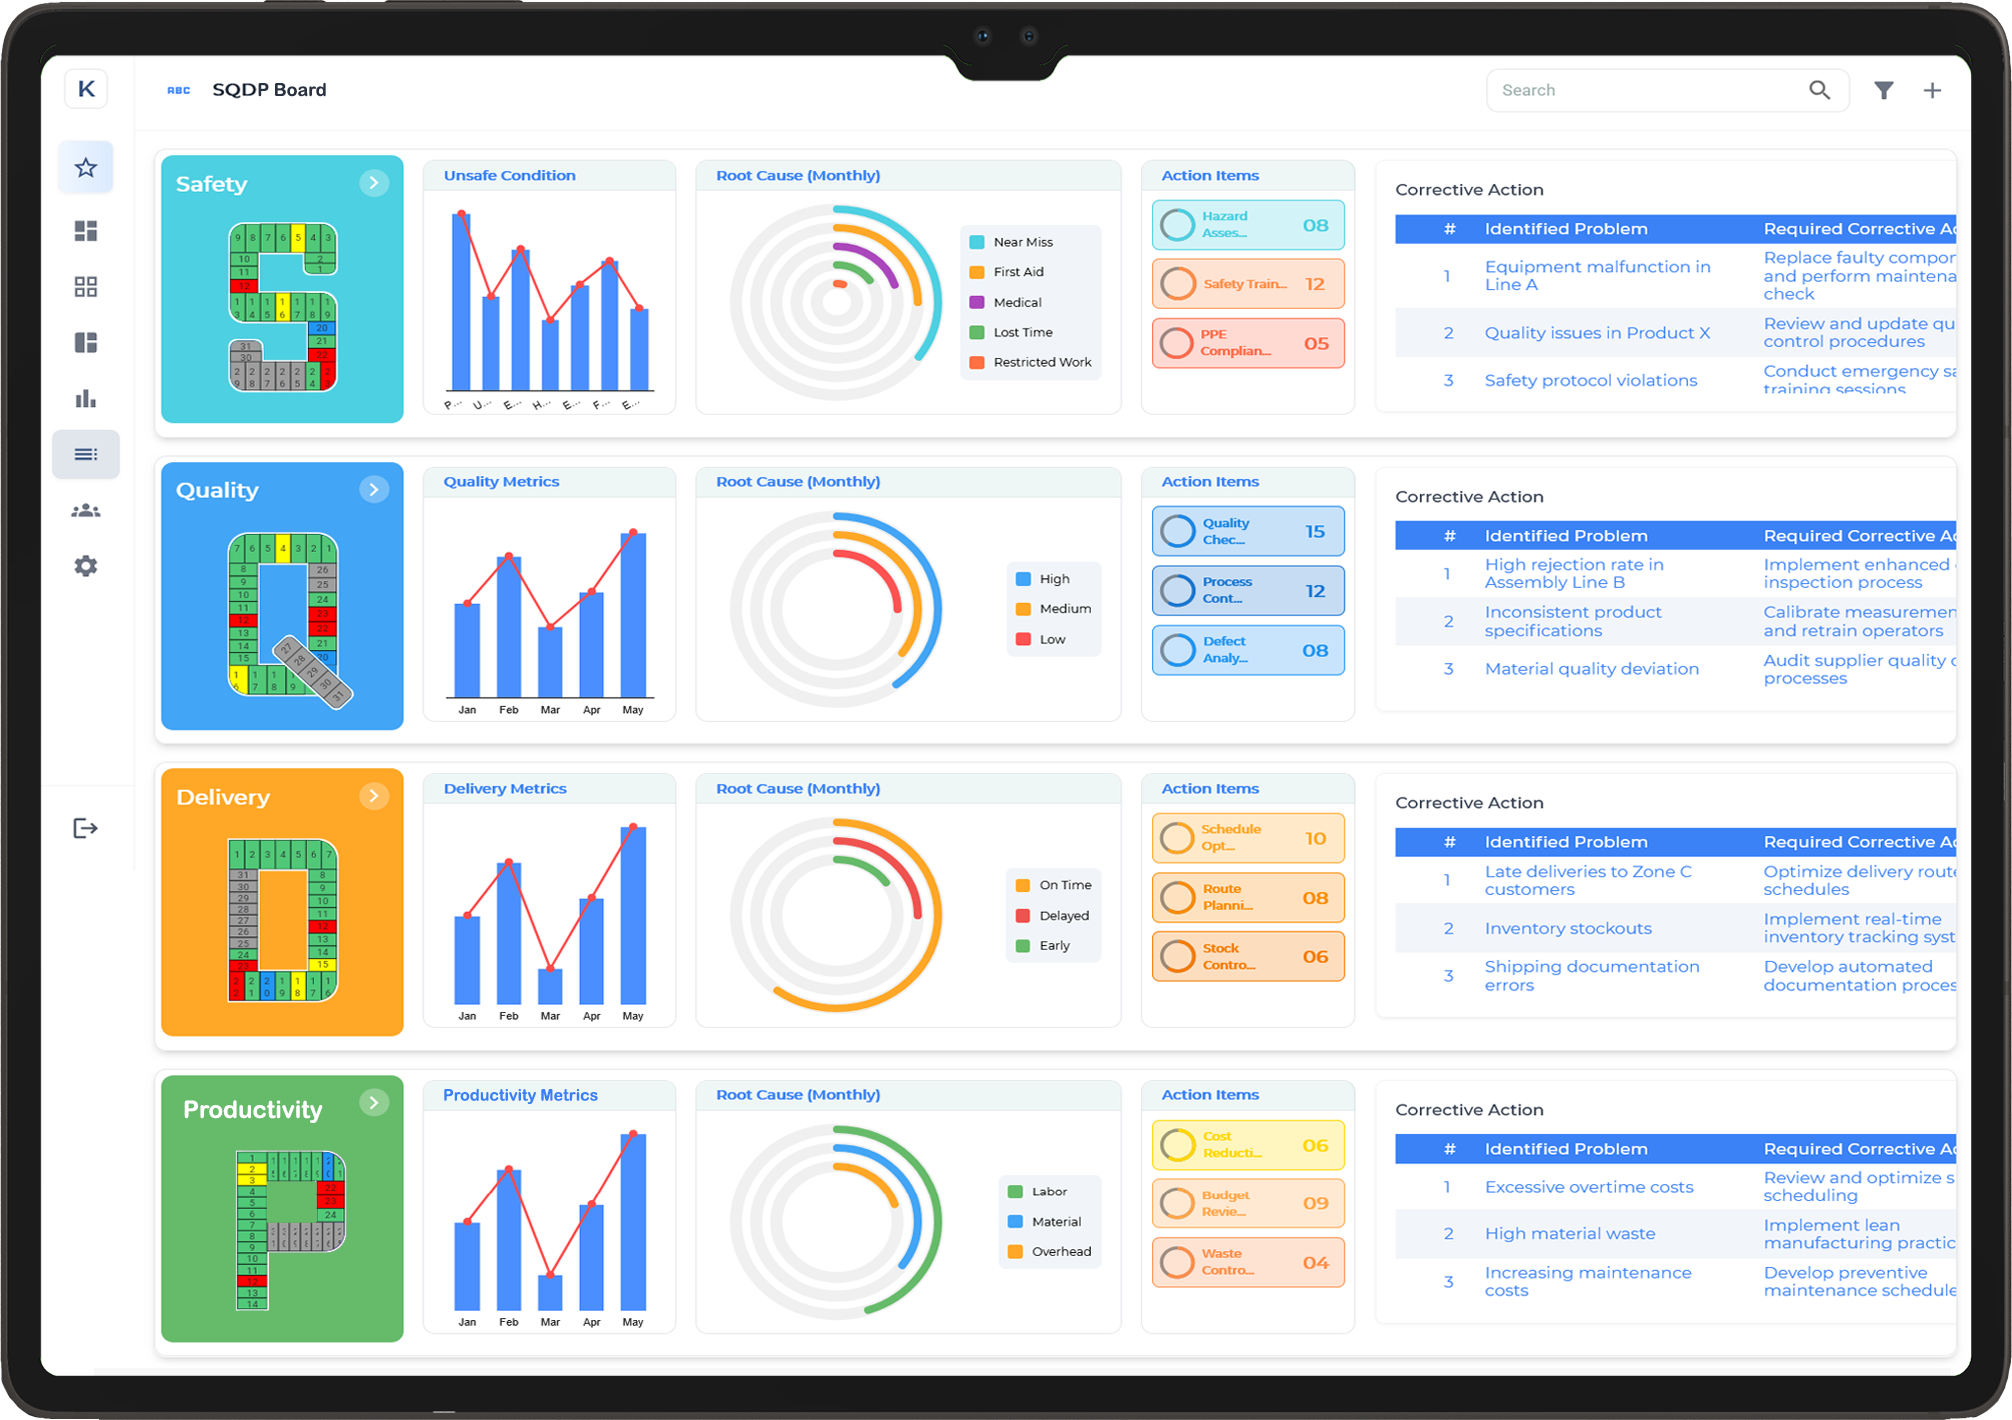
QCDMS Board
An QCDMS Board is a visual management tool used to track and communicate performance across five key operational pillars: Quality, Cost, Delivery, Morale, and Safety. Widely used in manufacturing and service environments, the QCDMS Board helps teams stay aligned with performance targets, quickly identify issues, and promote a culture of continuous improvement by focusing on product quality, cost efficiency, timely delivery, employee morale, and safety protocols.
1. Quality
Monitors key quality indicators, such as defect rates, rework, customer complaints, and first-pass yield. This section ensures that high standards of quality are consistently met, drives continuous improvement efforts, and ensures that processes are in place to reduce defects and maintain consistent output.
2. Cost
Tracks cost-related metrics, including material usage, production costs, waste, and cost-saving initiatives. This section encourages teams to focus on cost efficiency by identifying opportunities to reduce waste and manage resources effectively, while still maintaining quality standards and meeting delivery targets.
3. Delivery
Monitors key delivery metrics, such as on-time performance, lead times, schedule adherence, and throughput. This section ensures the organisation meets customer expectations by delivering products or services on time, enhancing customer satisfaction and operational efficiency.
4. Morale
Tracks metrics related to employee morale and engagement, including team feedback, recognition, and job satisfaction. This section emphasises the importance of maintaining a positive work environment where employees feel valued, motivated, and are empowered to contribute to continuous improvement initiatives.
5. Safety
Monitors safety-related metrics such as incident rates, near misses, hazard identification, and compliance with safety protocols. This section highlights the importance of creating a safe working environment by proactively managing risks and ensuring the well-being of all team members.
Book Free Demo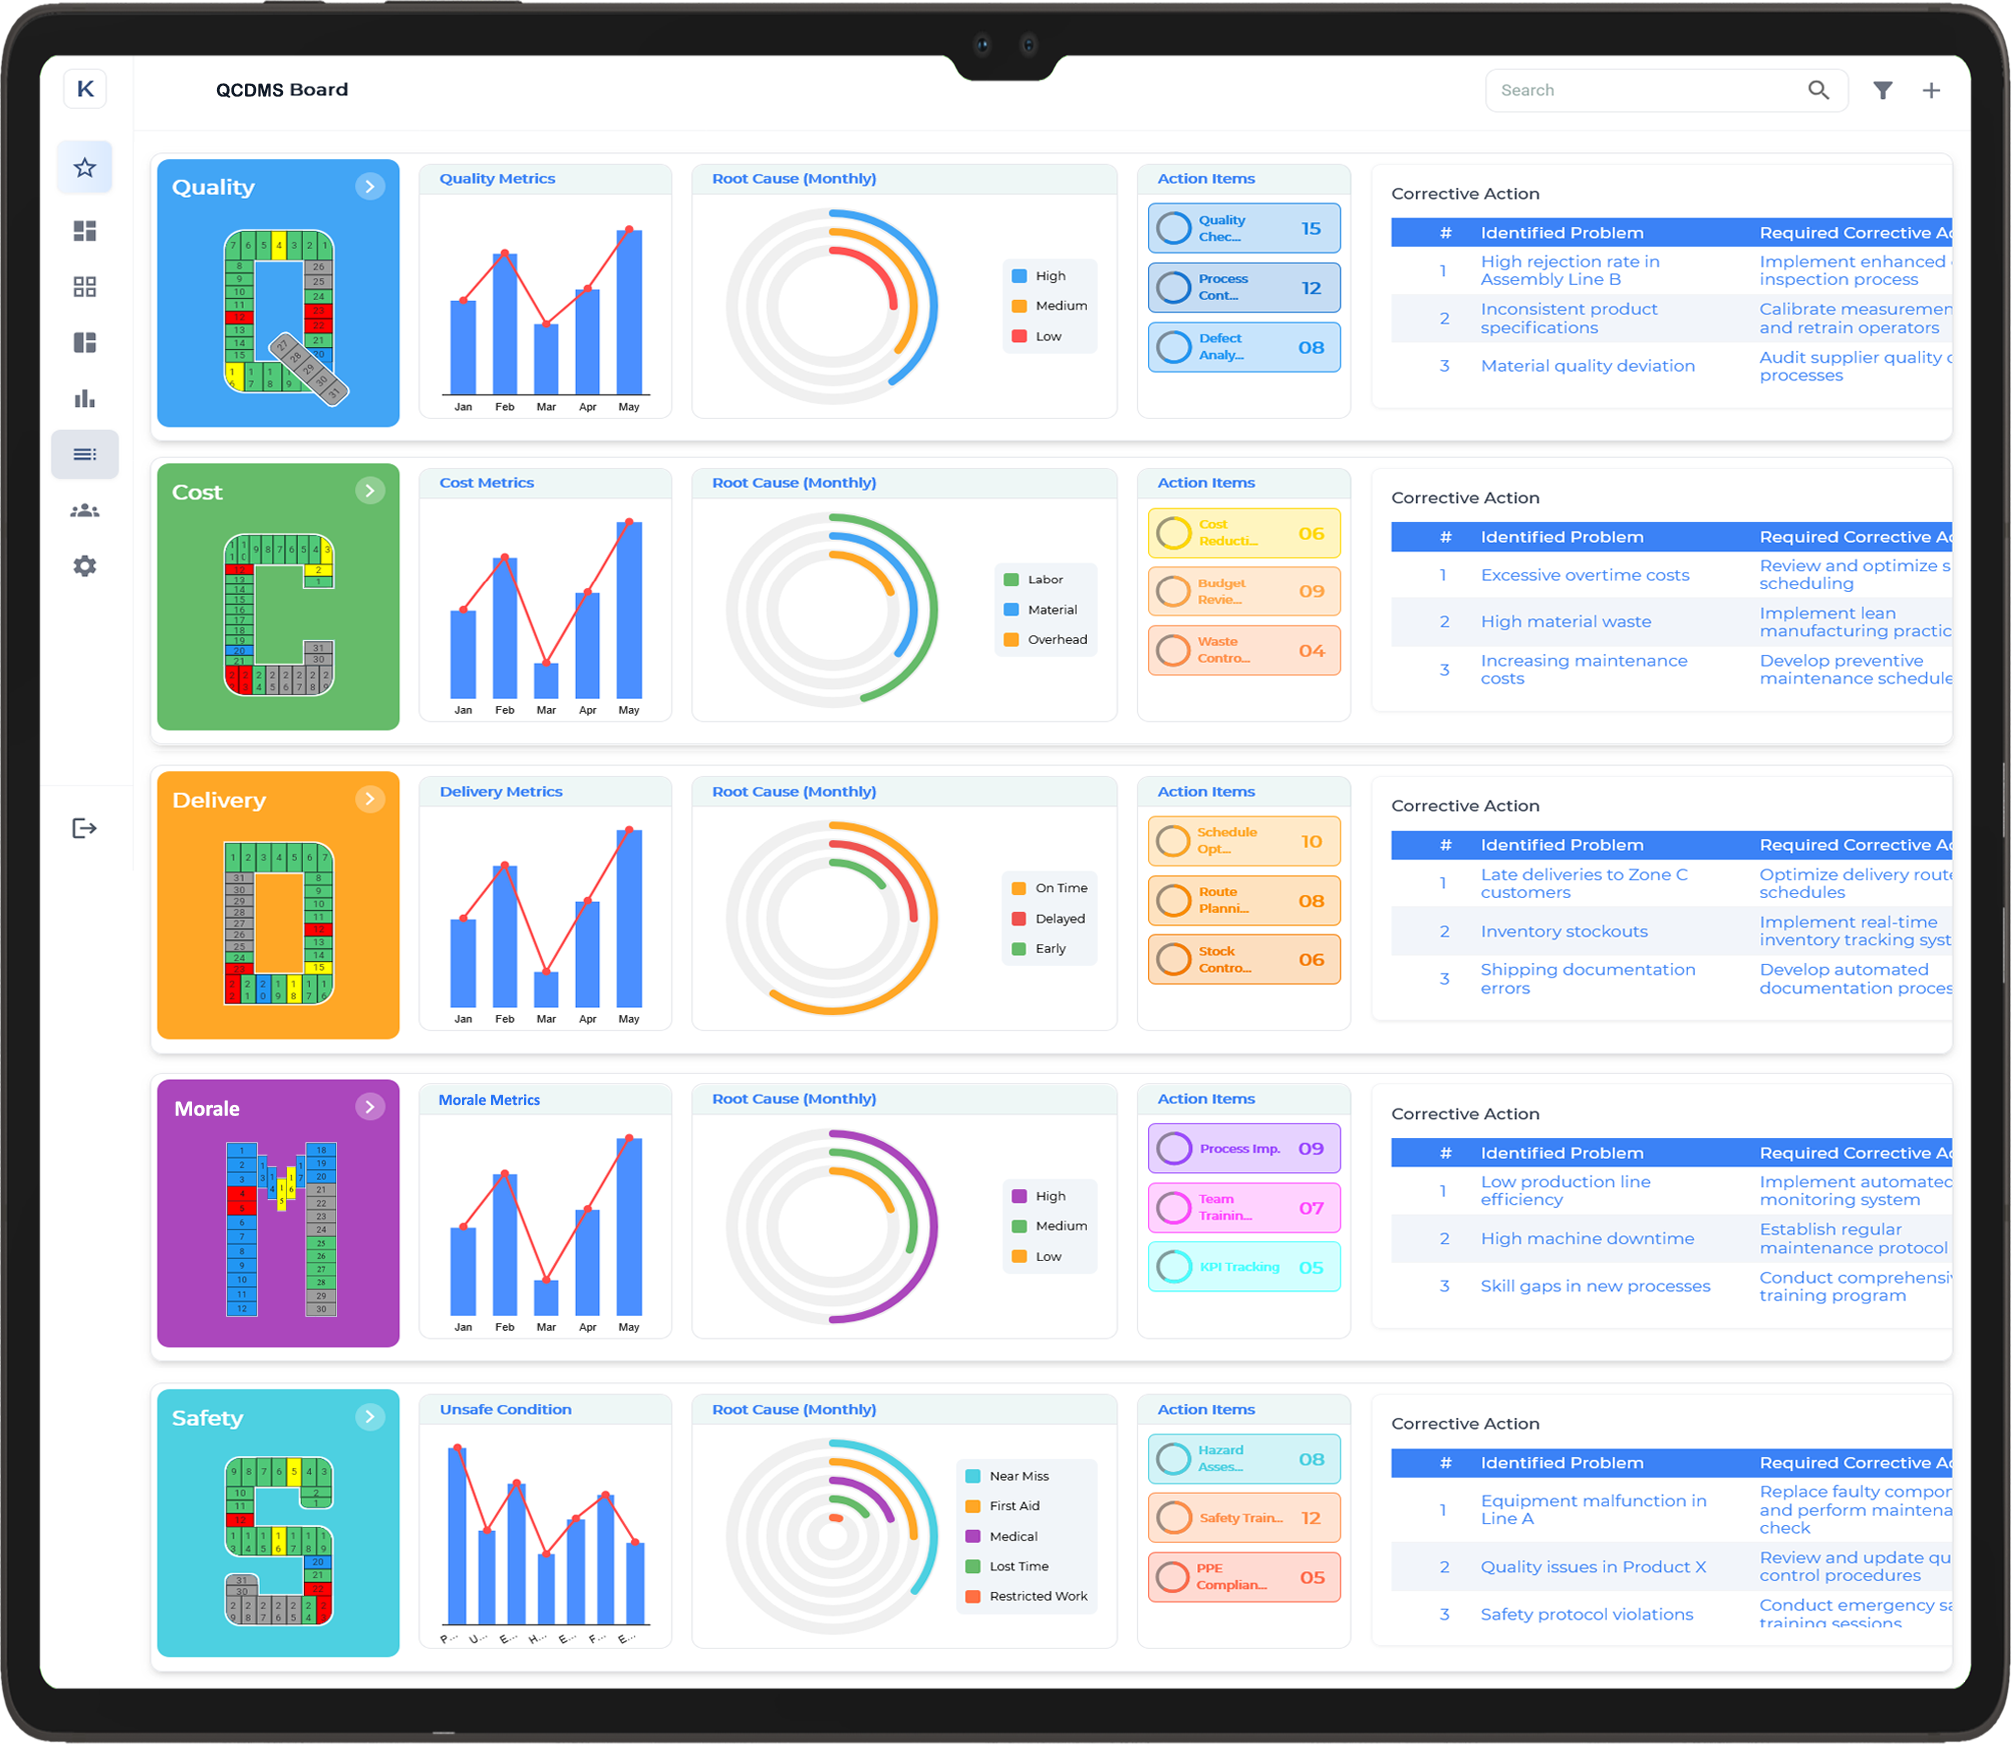
SQDEC Board
An SQDEC Board is a visual management tool used to track and communicate performance across five key operational pillars: Safety, Quality, Delivery, Engagement, and Cost. Commonly used in manufacturing and service environments, the SQDEC Board helps teams stay aligned with performance targets, quickly identify issues, and foster a culture of continuous improvement by focusing on safety, product quality, timely delivery, employee engagement, and cost management.
1. Safety
Tracks safety-related metrics such as incident rates, near misses, hazard identification, and compliance with safety protocols. This section emphasises the importance of ensuring a safe working environment, prioritising the well-being of all team members, and fostering a proactive approach to risk management and prevention.
2. Quality
Monitors key quality indicators, such as defect rates, rework, customer complaints, and first-pass yield. This section ensures that high standards of quality are consistently met, drives continuous improvement efforts, and ensures processes are in place to reduce defects and maintain consistent product or service output.
3. Delivery
Tracks key delivery metrics, such as on-time performance, lead times, schedule adherence, and throughput. This section ensures the organisation meets customer expectations by providing reliable, timely delivery of products or services, enhancing both customer satisfaction and operational efficiency.
4. Engagement
Monitors metrics related to employee engagement, satisfaction, and motivation, including team feedback, training, recognition, and involvement in improvement initiatives. This section highlights the importance of maintaining a positive and engaged workforce, fostering a culture where employees are motivated, valued, and empowered to contribute to the organisation’s success.
5. Cost
Tracks cost-related metrics such as material usage, production costs, waste, and cost-saving initiatives. This section encourages teams to focus on cost efficiency by identifying opportunities to reduce waste, manage resources effectively, and maintain financial discipline while still upholding quality standards and meeting delivery goals.
Book Free Demo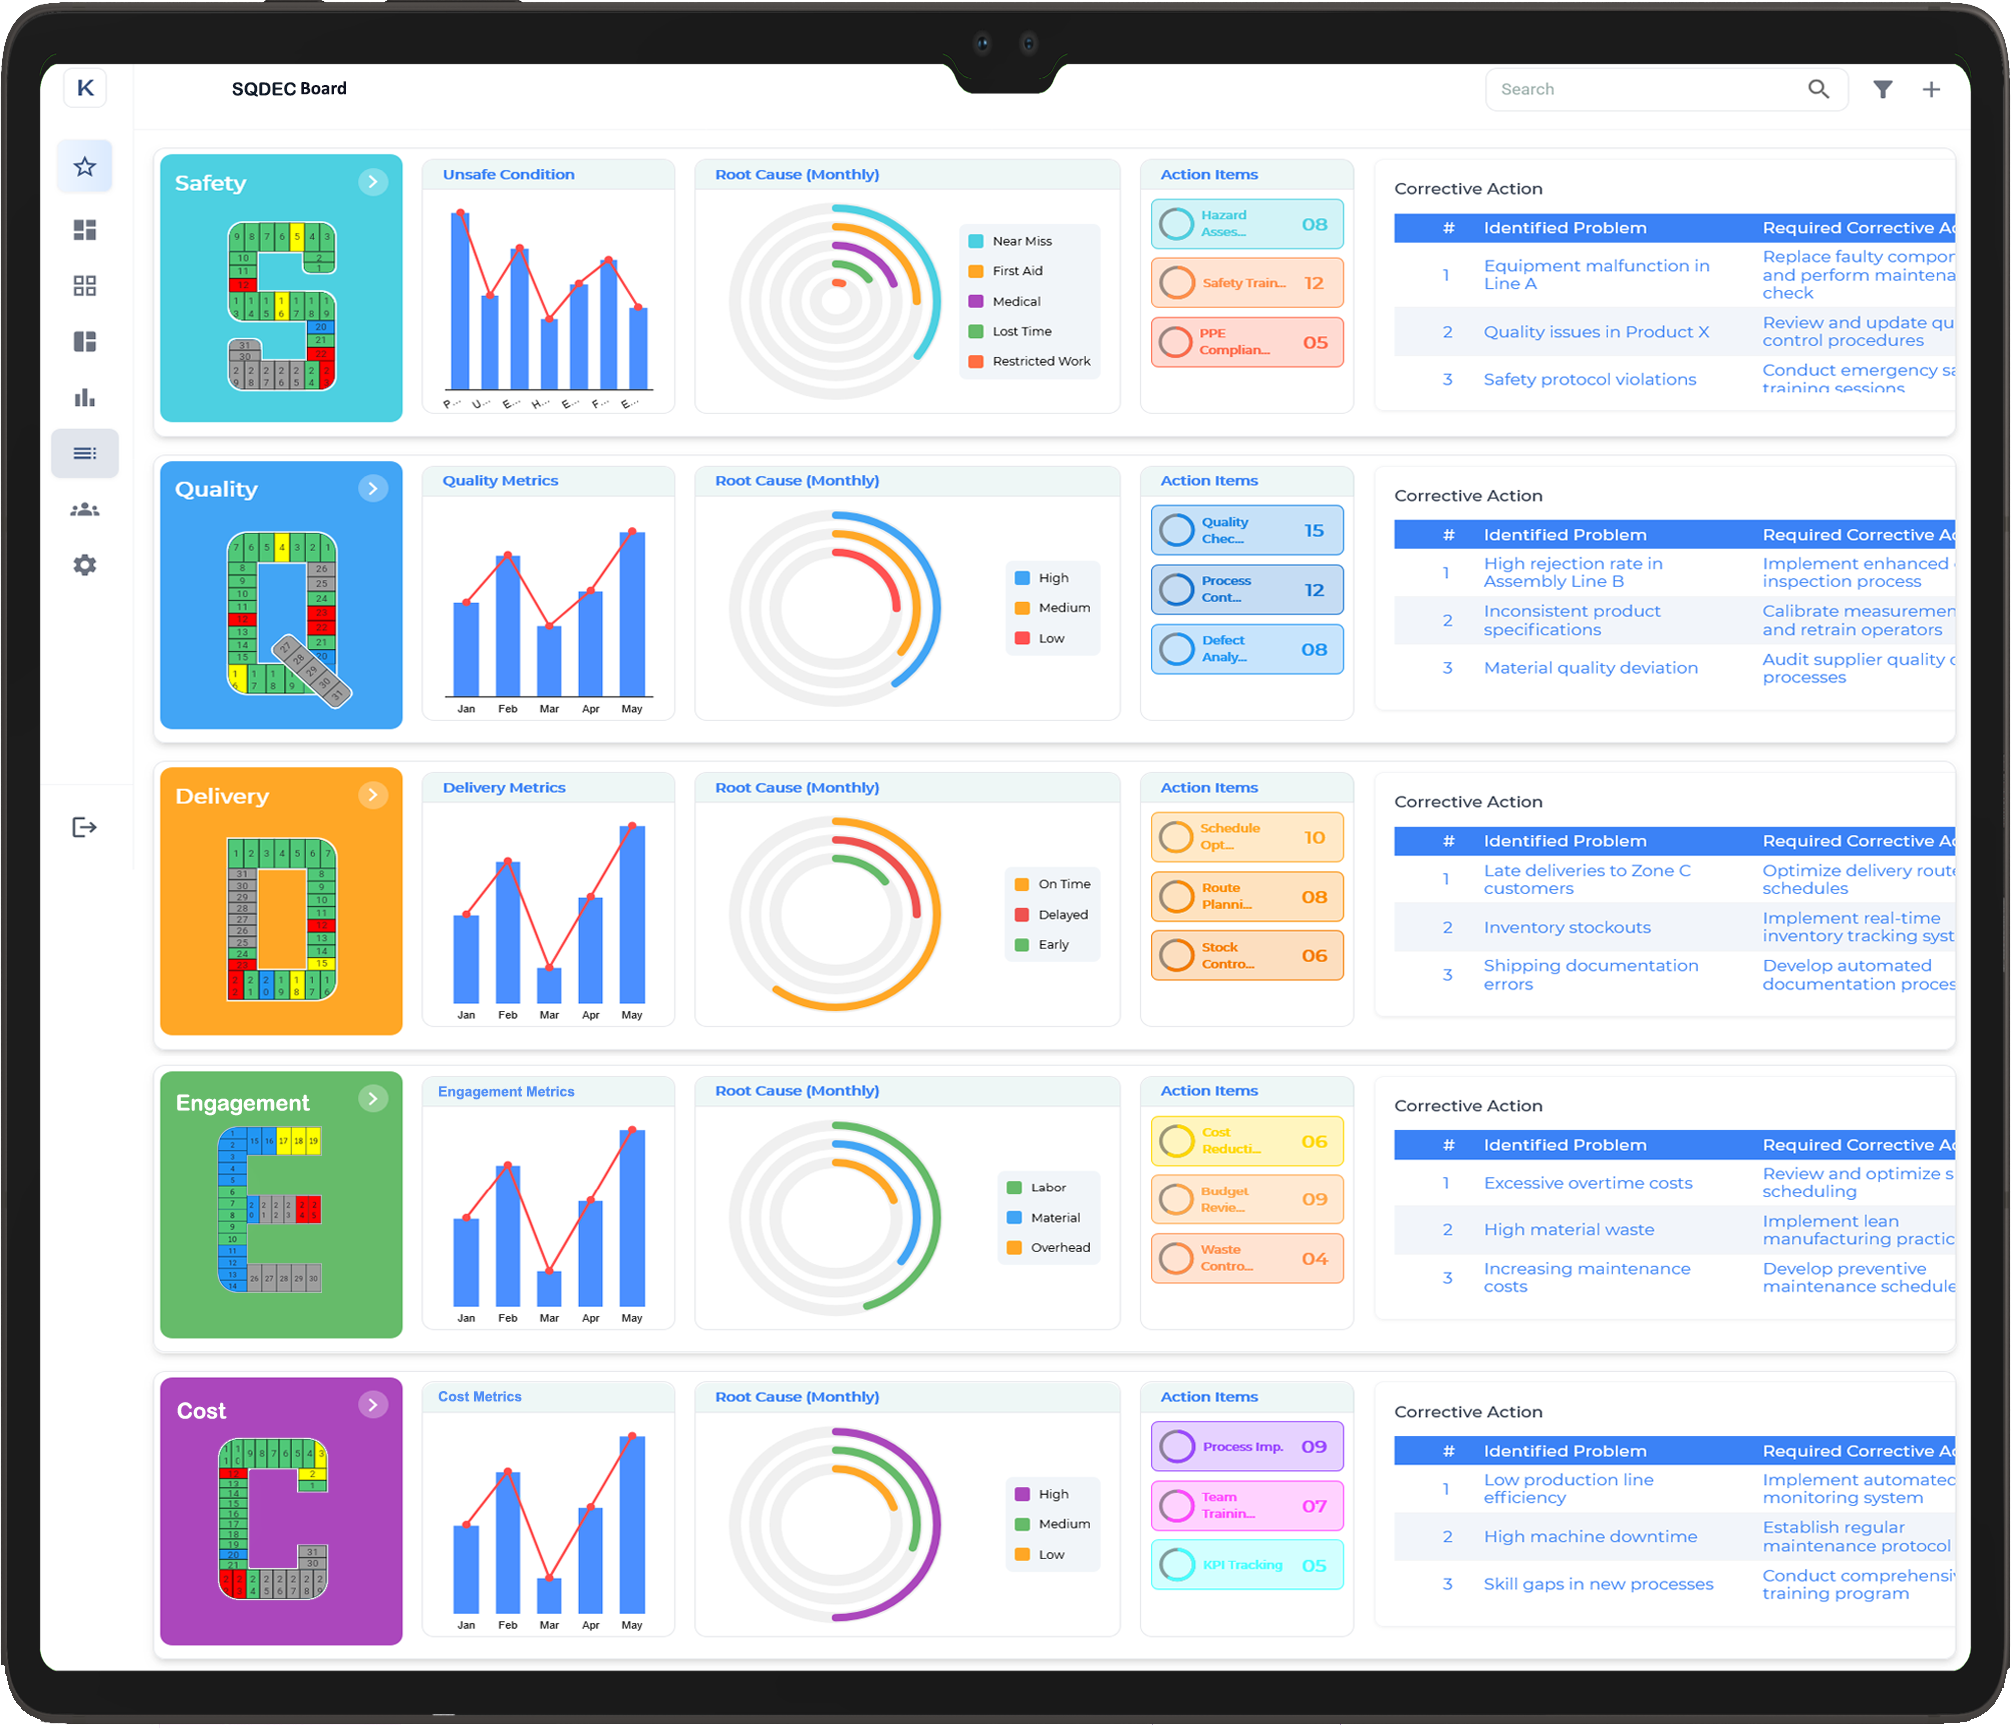
SQDECC Board
An SQDECC Board is a visual management tool used to track and communicate performance across six key operational pillars: Safety, Quality, Delivery, Engagement, Cost, and Compliance. Commonly used in manufacturing and service environments, the SQDECC Board helps teams stay aligned with performance targets, quickly identify issues, and promote a culture of continuous improvement by focusing on safety, product quality, timely delivery, employee engagement, cost management, and compliance with relevant regulations and standards.
1. Safety
Tracks safety-related metrics such as incident rates, near misses, hazard identification, and compliance with safety protocols. This section emphasises the importance of maintaining a safe working environment, prioritising the well-being of all team members, and fostering a proactive approach to risk management and prevention.
2. Quality
Monitors key quality indicators, such as defect rates, rework, customer complaints, and first-pass yield. This section ensures that high standards of quality are consistently met, drives continuous improvement efforts, and ensures processes are in place to reduce defects and maintain consistency across products or services.
3. Delivery
Tracks key delivery metrics, such as on-time performance, lead times, schedule adherence, and throughput. This section ensures the organisation meets customer expectations by providing reliable, timely delivery of products or services, contributing to enhanced customer satisfaction and operational success.
4. Engagement
Monitors metrics related to employee engagement, satisfaction, and motivation, including team feedback, training, recognition, and involvement in continuous improvement initiatives. This section underscores the importance of fostering a positive work environment where employees feel valued, motivated, and empowered to contribute to the organisation’s goals.
5. Cost
Tracks cost-related metrics such as material usage, production costs, waste, and cost-saving initiatives. This section encourages a focus on cost efficiency, identifying opportunities to reduce waste, optimise resources, and maintain financial discipline while ensuring that quality standards and delivery goals are upheld.
6. Compliance
Monitors compliance with industry regulations, standards, and internal policies, including safety regulations, environmental laws, and product certifications. This section ensures that the organisation adheres to all legal and regulatory requirements, mitigating risks associated with non-compliance and maintaining a strong reputation for ethical operations.
Book Free Demo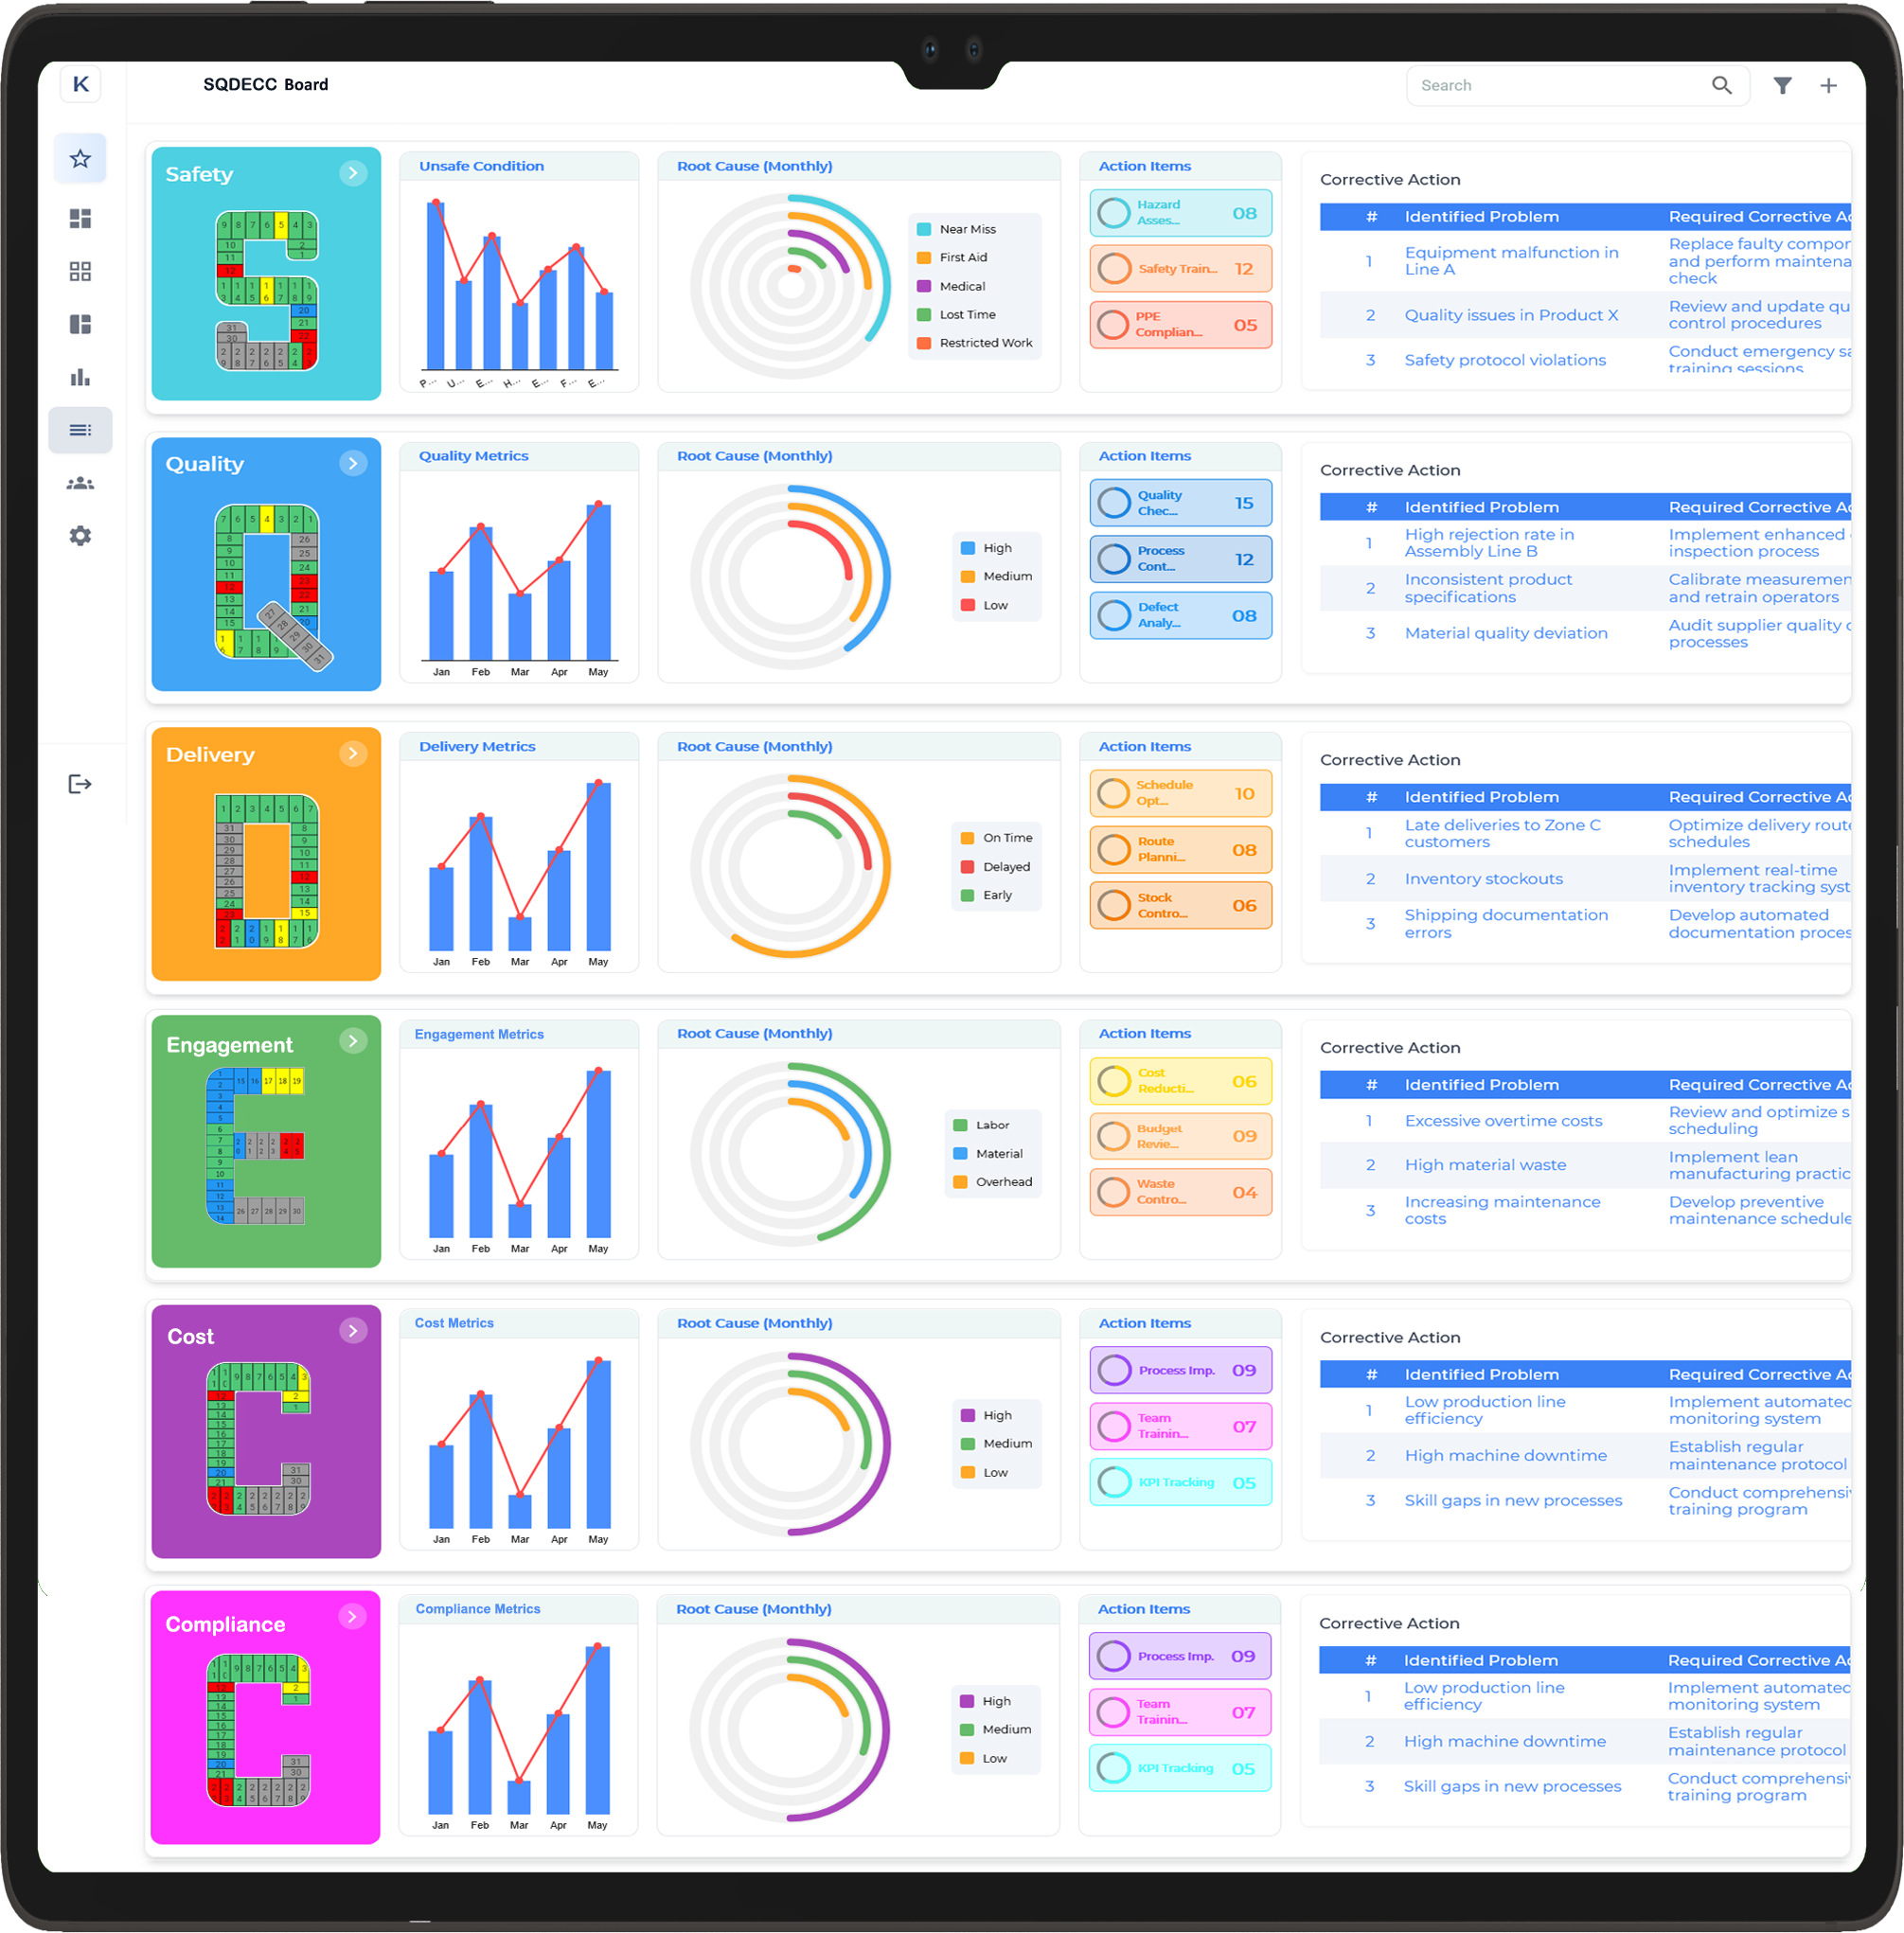
How Balanced Scorecard Visual Boards Drive Strategic Alignment
In today’s fast-paced business environment, ensuring that all teams are aligned with the company's strategic goals is crucial for success. Balanced Scorecard visual boards play a pivotal role in driving this alignment by providing a clear and visual representation of performance metrics that support strategic objectives.
Visual Clarity for Better Understanding
Balanced Scorecard visual boards offer a straightforward, visual format that enables teams to see at a glance how their performance ties into broader organisational goals. By displaying key metrics under financial, customer, internal processes, and learning and growth perspectives, everyone in the organisation can understand their role in achieving these goals. This clarity fosters better communication and focus across departments.
Aligning Daily Activities with Long-Term Goals
One of the primary benefits of Balanced Scorecard boards is their ability to link everyday actions with long-term strategic objectives. By tracking progress in real time, teams can adjust their efforts to ensure that they stay on track with overarching goals. This connection helps improve accountability, as everyone understands how their work impacts the company's strategic direction.
Promoting Continuous Improvement
Balanced Scorecard visual boards also help organisations identify areas for improvement by tracking performance trends. Teams can spot gaps in real time and take proactive steps to optimise processes, ultimately leading to continuous improvement across all areas of the business.
Balanced Scorecard visual boards are a powerful tool for driving strategic alignment. They provide clarity, accountability, and continuous improvement, ensuring that all teams are working together towards shared organisational objectives.
The Benefits of Using Visual Management Boards in Performance Tracking
Visual management boards are a powerful tool for improving performance tracking in organisations. By providing a clear, visual overview of key metrics, these boards help teams and leaders monitor progress, identify issues, and make informed decisions quickly. The use of visual management boards can significantly enhance communication, accountability, and overall operational efficiency.
Improved Transparency and Communication
One of the main advantages of visual management boards is their ability to improve transparency across teams. By displaying key performance indicators (KPIs) and metrics in a visual format, all members of the organisation can easily access and understand the data. This transparency fosters better communication, ensuring everyone is aligned with the company’s goals and objectives.
Real-Time Monitoring for Quick Decision-Making
With visual management boards, performance data is available in real time, enabling managers to make quick, informed decisions. The ability to track progress as it happens means that potential problems can be identified early, allowing for prompt corrective actions. This proactive approach helps to maintain productivity and minimise downtime.
Enhanced Accountability and Motivation
By clearly showing performance data, visual management boards help improve accountability within teams. When employees can see their individual and team progress in real-time, they are more motivated to reach targets and contribute to overall success. This visual feedback drives a sense of ownership and encourages continuous improvement.
Visual management boards offer numerous benefits for performance tracking. They enhance transparency, facilitate real-time decision-making, and promote accountability, leading to improved operational efficiency and organisational success.
Why Balanced Scorecards Are Essential for Organisational Success
A Balanced Scorecard is a strategic management tool that helps organisations translate their vision and strategy into actionable goals. By providing a comprehensive framework for tracking performance across multiple dimensions, it ensures that all aspects of an organisation are aligned with its long-term objectives. The balanced scorecard goes beyond financial metrics, considering customer satisfaction, internal processes, and learning and growth.
Comprehensive Performance Tracking
One of the key benefits of a balanced scorecard is its ability to track performance from multiple perspectives. By measuring not only financial outcomes but also customer satisfaction, internal efficiency, and employee development, organisations gain a well-rounded view of their operations. This holistic approach ensures that improvements are made across all areas, not just the financial bottom line.
Strategic Alignment Across Teams
The Balanced Scorecard ensures that all departments are aligned with the overall strategy of the organisation. It helps leaders set clear objectives and performance metrics, which are then communicated throughout the company. This alignment ensures that everyone works towards the same goals, making it easier to achieve long-term success.
Facilitates Decision-Making and Continuous Improvement
By regularly tracking key performance indicators (KPIs), the balanced scorecard helps leaders make informed decisions based on real-time data. It also highlights areas for improvement, fostering a culture of continuous learning and growth within the organisation. This adaptability makes it easier to respond to market changes and stay competitive.
In summary, a balanced scorecard is an essential tool for organisational success, providing a clear, balanced approach to performance tracking and strategic execution.
How to Create a Balanced Scorecard Board for Your Business
Creating a Balanced Scorecard board for your business is a great way to ensure your strategy is effectively implemented and tracked. A balanced scorecard provides a framework that helps measure performance from multiple perspectives: financial, customer, internal processes, and learning and growth. This tool ensures all areas of your business are aligned with your strategic objectives and are working towards the same goals.
Step 1: Define Your Strategic Objectives
Start by clearly defining your business’s strategic objectives. These should align with your long-term vision and goals. Focus on key areas like financial performance, customer satisfaction, operational efficiency, and employee development. Make sure your objectives are specific, measurable, achievable, relevant, and time-bound (SMART).
Step 2: Choose Relevant Metrics
Once your objectives are defined, select the right metrics to measure progress in each area. For example, in the financial perspective, you might track revenue growth or profitability. In the customer perspective, you could monitor customer satisfaction or retention rates. Ensure that each metric reflects the overall goals of your business.
Step 3: Visualise the Data
Set up your balanced scorecard board to display your objectives and metrics clearly. Use charts, graphs, or colour-coded indicators to make the data easy to interpret at a glance. The board should allow you to quickly assess performance and identify areas that need attention.
Step 4: Regularly Review and Update
Review your scorecard regularly to track progress and make necessary adjustments. Use it as a tool for continuous improvement, ensuring that your business stays on track with its strategic goals and adapts to changing circumstances.
By following these steps, you can create an effective Balanced Scorecard board that helps your business stay focused, measure success, and achieve its strategic goals.
The Role of KPIs in Balanced Scorecard Visual Management Boards
Key Performance Indicators (KPIs) play a crucial role in the effectiveness of balanced scorecard visual management boards. These boards are designed to provide a clear overview of an organisation’s performance across various areas, and KPIs act as the guiding metrics that track progress towards strategic goals. By visually displaying KPIs on a management board, businesses can quickly assess how well they are meeting their objectives in key areas such as financial performance, customer satisfaction, internal processes, and employee development.
Aligning KPIs with Strategic Goals
The first step in using KPIs effectively is aligning them with your organisation's strategic goals. Each perspective of the balanced scorecard – financial, customer, internal processes, and learning and growth – should have specific KPIs that reflect the key areas of focus. For example, a financial KPI might be revenue growth, while a customer KPI could focus on customer satisfaction or retention. By aligning KPIs with these broader objectives, organisations can ensure that their efforts are directed towards achieving their overall strategic vision.
Enhancing Decision-Making with Visualisation
Visualising KPIs on a Balanced Scorecard board allows leadership teams to make more informed decisions. With real-time updates and clear, visual representations, managers can spot trends, identify areas of concern, and take corrective action more quickly. This visualisation also promotes transparency, as teams can easily access the same data and work together towards common goals.
KPIs are essential for turning a balanced scorecard into a powerful tool for performance management. By focusing on the right KPIs and displaying them visually, organisations can ensure they are on track to achieve their strategic objectives.
Aligning Financial, Customer, Internal Processes, and Learning Goals
Aligning goals across four critical areas – financial, customer, internal processes, and learning and growth – is fundamental to achieving organisational success. A balanced approach ensures that every department and team member is working towards shared objectives, ultimately driving long-term performance. By aligning goals in these four key areas, businesses can maintain a balanced focus on growth, efficiency, and employee development.
Financial Goals: Ensuring Sustainable Profitability
Financial goals are essential for maintaining profitability and securing the future of the business. These goals typically revolve around increasing revenue, managing costs, improving margins, and ensuring a solid return on investment. Aligning financial targets with overall business strategy ensures that resources are allocated effectively, helping the business achieve sustainable growth.
Customer Goals: Enhancing Satisfaction and Loyalty
Customer-centric goals focus on improving customer satisfaction, loyalty, and retention. By aligning customer goals with the company’s broader strategy, businesses can deliver better products, services, and experiences. These goals often include enhancing customer service, improving product quality, and increasing customer engagement, all of which are critical to long-term success.
Internal Processes: Optimising Efficiency
Internal processes are the backbone of operational efficiency. Setting goals around process improvement, innovation, and quality control allows companies to reduce waste, lower costs, and improve productivity. Aligning these goals with the strategic vision ensures that operations are continually refined and optimised for better performance.
Learning and Growth: Investing in People
Finally, learning and growth goals focus on developing the skills, knowledge, and capabilities of employees. By fostering a culture of continuous improvement, businesses can empower their workforce, improve innovation, and increase job satisfaction. Aligning learning and growth goals with overall business objectives ensures that the workforce evolves in tandem with the organisation’s needs.
By aligning goals in these four areas, organisations can create a cohesive strategy that drives performance and fosters long-term success.
How Visual Management Boosts Employee Engagement with the Balanced Scorecard
Visual management plays a crucial role in improving employee engagement when used alongside the Balanced Scorecard framework. By providing clear, easily accessible visual cues about organisational performance, it empowers employees to take ownership of their roles and understand how their work contributes to the overall success of the business.
Clear Communication of Goals and Objectives
One of the primary benefits of visual management is its ability to communicate strategic goals and objectives in a simple, clear manner. By displaying the Balanced Scorecard on a visual board, employees can quickly grasp the company’s priorities in the four key areas: financial, customer, internal processes, and learning and growth. This helps employees align their day-to-day actions with the broader strategic vision, enhancing their sense of purpose and engagement.
Real-Time Performance Tracking
With real-time data presented visually, employees can track progress against key performance indicators (KPIs) instantly. This transparency not only fosters a sense of accountability but also motivates employees to stay focused on their goals. When employees see the direct impact of their work on performance metrics, they are more likely to stay engaged and strive for continuous improvement.
Encouraging Collaboration and Teamwork
Visual management boards foster collaboration by displaying team and individual performance, which encourages healthy competition and teamwork. Employees can quickly identify areas where support or improvement is needed, driving collective action towards achieving shared objectives. This promotes a more inclusive work culture and enhances team morale.
Ultimately, by making strategic goals and performance metrics visible, visual management with the Balanced Scorecard boosts employee engagement, increases motivation, and aligns individual efforts with organisational success.
Top Features to Look for in a Balanced Scorecard Visual Board
A Balanced Scorecard visual board is an effective tool for tracking and aligning organisational performance across four key areas: financial, customer, internal processes, and learning and growth. To ensure the board serves its purpose effectively, it’s important to choose one with the right features that make it easy to use and beneficial for strategic management.
1. Clear and Concise Layout
A well-organised visual board should present information in a clear and easy-to-understand layout. The layout should divide the board into sections for each of the four Balanced Scorecard perspectives. This allows employees and managers to quickly identify key goals, metrics, and performance status, ensuring clarity and focus.
2. Real-Time Data Display
For a Balanced Scorecard to be effective, it needs to display up-to-date data in real-time. This ensures that performance metrics reflect current conditions and allow for timely adjustments to strategies or goals. Real-time data empowers employees to make informed decisions and remain aligned with organisational objectives.
3. Customisable KPIs
Every organisation has its unique set of key performance indicators (KPIs). A good Balanced Scorecard visual board should allow for customisation, enabling businesses to track KPIs that are most relevant to their strategic goals. Customisable KPIs ensure that the board is tailored to reflect the company's priorities.
4. Visual Cues and Colour Coding
Incorporating visual cues such as colour coding, charts, and graphs makes it easier to interpret performance data at a glance. Red, yellow, and green indicators can highlight areas needing attention or celebration, providing quick insights into the company’s progress and areas of improvement.
5. Easy Integration with Other Tools
To maximise its usefulness, a Balanced Scorecard visual board should integrate seamlessly with other business tools and systems. Whether it’s linking to financial software or customer management platforms, this integration enables a more holistic view of performance across all areas of the business.
By focusing on these features, businesses can create an effective Balanced Scorecard visual board that drives performance, accountability, and strategic alignment.
Case Study: Successful Implementation of Balanced Scorecards in Companies
The Balanced Scorecard (BSC) has become a cornerstone for many organisations aiming to align their strategy with measurable performance outcomes. By providing a comprehensive view of business performance across key areas, it helps businesses track progress and make informed decisions. Several companies have successfully implemented Balanced Scorecards to drive growth and improve efficiency.
Aligning Strategy with Day-to-Day Operations
One notable success story comes from a manufacturing company that struggled with tracking performance across its different departments. By adopting a Balanced Scorecard, the company was able to measure not only financial performance but also customer satisfaction, internal processes, and employee development. This holistic approach allowed the management team to identify key areas for improvement, such as production bottlenecks and customer service delays, which were not as evident through traditional metrics.
Improving Employee Engagement
Another company in the services sector successfully used the Balanced Scorecard to enhance employee engagement. By aligning personal and team goals with the company’s overall strategy, employees became more motivated and accountable. The visual nature of the Balanced Scorecard made it easier for them to understand how their work contributed to broader objectives, fostering a sense of purpose and ownership.
Long-Term Strategic Success
Both companies saw improved decision-making, greater efficiency, and better alignment between strategic goals and day-to-day operations. The Balanced Scorecard proved to be an invaluable tool for driving long-term strategic success, providing clarity on performance and guiding decision-makers towards sustainable growth.
How to Link Strategic Goals with Operational Metrics Using Visual Boards
Linking strategic goals with operational metrics is essential for ensuring that a company’s day-to-day activities align with its long-term vision. One effective way to achieve this is by using visual boards, which provide a clear, concise way of tracking progress and performance across various departments.
Creating a Visual Connection
To start, define the strategic goals that are crucial for your business. These could include improving customer satisfaction, reducing costs, or increasing market share. Once these goals are established, break them down into actionable, measurable operational metrics. For example, if customer satisfaction is a strategic goal, operational metrics might include response time, customer feedback scores, or complaint resolution time.
Using Visual Boards for Clarity
Visual boards allow businesses to map these operational metrics against their strategic goals, creating a transparent overview of progress. Colour-coded indicators, such as green, amber, and red, make it easy to see how well each area is performing. These boards can be updated in real-time, ensuring that any issues are quickly identified and addressed.
Engaging Teams and Improving Alignment
When teams can see the direct impact of their efforts on the company’s overall strategy, engagement and accountability increase. Visual boards encourage cross-functional collaboration and help employees understand how their daily actions contribute to achieving organisational objectives. This alignment between strategic goals and operational metrics is key to driving continuous improvement and long-term success.
Integrating Balanced Scorecards with Other Performance Management Tools
Integrating balanced scorecards with other performance management tools can create a unified, data-driven approach to managing and improving business performance. By combining various tools, companies can ensure that strategic goals are clearly linked with daily operations, fostering alignment across all levels of the organisation.
Holistic Performance Monitoring
The balanced scorecard method focuses on measuring performance from four key perspectives: financial, customer, internal processes, and learning and growth. Integrating these insights with tools like KPIs (Key Performance Indicators), dashboards, and reporting software allows for a more comprehensive view of a company’s health. This combined approach enables businesses to track not only results but also the processes that drive those results.
Streamlining Data Flow
When the Balanced Scorecard is linked with other performance management systems, data flows seamlessly across platforms. For example, integrating a balanced scorecard with an ERP (Enterprise Resource Planning) system or project management software helps to synchronise real-time operational data with strategic objectives. This integration allows leaders to make data-driven decisions, address issues promptly, and optimise workflows for better outcomes.
Improved Decision-Making
By connecting the balanced scorecard with other performance management tools, companies gain deeper insights into areas of improvement, potential risks, and opportunities for growth. This integration improves decision-making by providing timely, accurate, and relevant data, ensuring that business strategies are adaptable and responsive to changing market conditions.
How Balanced Scorecards Help Managers Make Data-Driven Decisions
Balanced scorecards are an invaluable tool for managers, providing a clear, structured way to measure performance across multiple areas of the business. By tracking key metrics in four critical perspectives—financial, customer, internal processes, and learning and growth—managers can make informed decisions that align with the company's strategic objectives.
Providing a Clear Overview
Balanced scorecards present key performance indicators (KPIs) in a concise, easy-to-understand format, offering managers a snapshot of the organisation's performance. This clear overview allows managers to identify trends, spot issues early, and adjust strategies as needed to stay on course. By focusing on a balanced set of metrics, managers are not solely reliant on financial data but are encouraged to consider all aspects of the business.
Enabling Data-Driven Decisions
With a balanced scorecard, managers can move beyond intuition and base their decisions on real-time data. Whether it’s customer satisfaction scores, process efficiency metrics, or employee development indicators, managers are empowered to make strategic choices backed by solid evidence. This approach reduces the risk of poor decision-making and ensures that actions are aligned with long-term business goals.
Fostering Strategic Alignment
By linking performance measures to strategic objectives, balanced scorecards help managers ensure that every decision is aligned with the organisation’s vision. This creates a unified approach across departments, enhancing overall efficiency and driving sustainable growth.
The Importance of Regular Reviews on Balanced Scorecard Visual Boards
Regular reviews of balanced scorecard visual boards are essential for ensuring that organisations stay on track with their strategic objectives. By consistently evaluating key performance indicators (KPIs) across various perspectives, businesses can make timely adjustments to enhance performance and achieve their goals.
Maintaining Strategic Focus
One of the key benefits of conducting regular reviews is the ability to maintain a strong focus on strategic goals. Balanced scorecards help align daily operations with long-term objectives. Regularly reviewing the board ensures that the team remains focused on what's important, preventing distractions and ensuring that all actions contribute to the overall success of the organisation.
Identifying Issues Early
Frequent reviews allow managers to spot potential issues before they become significant problems. Whether it's a dip in customer satisfaction or an internal process inefficiency, early identification enables teams to address these challenges proactively. This early intervention can prevent costly delays or setbacks.
Fostering Continuous Improvement
Regular reviews also encourage continuous improvement. By assessing performance on an ongoing basis, organisations can identify areas of strength and areas needing attention. Adjustments to processes, resources, and priorities can be made to continuously optimise performance. This cyclical approach ensures that the business evolves in line with changing market conditions and internal growth.
Using Balanced Scorecard Boards to Foster Cross-Department Collaboration
Balanced scorecard boards are a powerful tool not only for tracking performance but also for fostering cross-department collaboration within an organisation. By visualising key metrics and goals, these boards provide a clear and shared understanding of the organisation's strategic direction, encouraging teams to work together towards common objectives.
Creating a Unified Vision
One of the primary advantages of using balanced scorecard boards is that they create a unified vision across different departments. By displaying objectives, KPIs, and progress in a centralised and easily accessible format, all teams can see how their efforts contribute to the overall strategy. This transparency encourages alignment, ensuring that departments work together rather than in silos.
Improving Communication and Accountability
Balanced scorecard boards promote regular communication between departments. As performance is reviewed on a consistent basis, teams can discuss challenges, share insights, and collaborate on solutions. This open communication fosters a culture of accountability, where each department understands its role in achieving organisational goals and is motivated to deliver results.
Enhancing Problem-Solving and Innovation
Collaboration facilitated by balanced scorecard boards can lead to more innovative solutions to organisational challenges. When different teams work together to solve problems, they bring unique perspectives and expertise to the table. This cross-pollination of ideas leads to creative approaches and improvements that benefit the entire organisation.
Why Digital Balanced Scorecard Boards Are the Future of Performance Management
In today’s fast-paced business environment, organisations need to make quick, data-driven decisions to stay competitive. Digital balanced scorecard boards are revolutionising performance management by providing real-time, accessible insights that help businesses achieve their strategic goals more effectively. These digital solutions offer many advantages over traditional paper-based or static methods, making them essential for modern organisations.
Real-Time Data and Instant Updates
Digital balanced scorecard boards allow managers and teams to access live data, ensuring that everyone is on the same page. This real-time visibility helps organisations monitor performance across key areas such as financials, customer satisfaction, internal processes, and learning & growth. Instant updates mean that adjustments can be made quickly, preventing potential issues from escalating.
Improved Collaboration and Transparency
Digital platforms enhance collaboration by enabling multiple departments to view and update the same scorecard simultaneously. This transparency ensures that everyone has access to the same information, improving communication and aligning all team members with organisational objectives. It also fosters a culture of accountability and makes it easier to identify and resolve issues across departments.
Scalability and Customisation
Unlike paper-based systems, digital balanced scorecard boards are highly scalable and customisable. As businesses grow, digital solutions can be easily adjusted to accommodate new KPIs or strategic goals. Customisable dashboards also allow users to focus on the metrics most relevant to their department or role, ensuring that performance management is tailored to specific needs.