What Is Balanced Scorecard Software and How Does It Drive Lean Management?
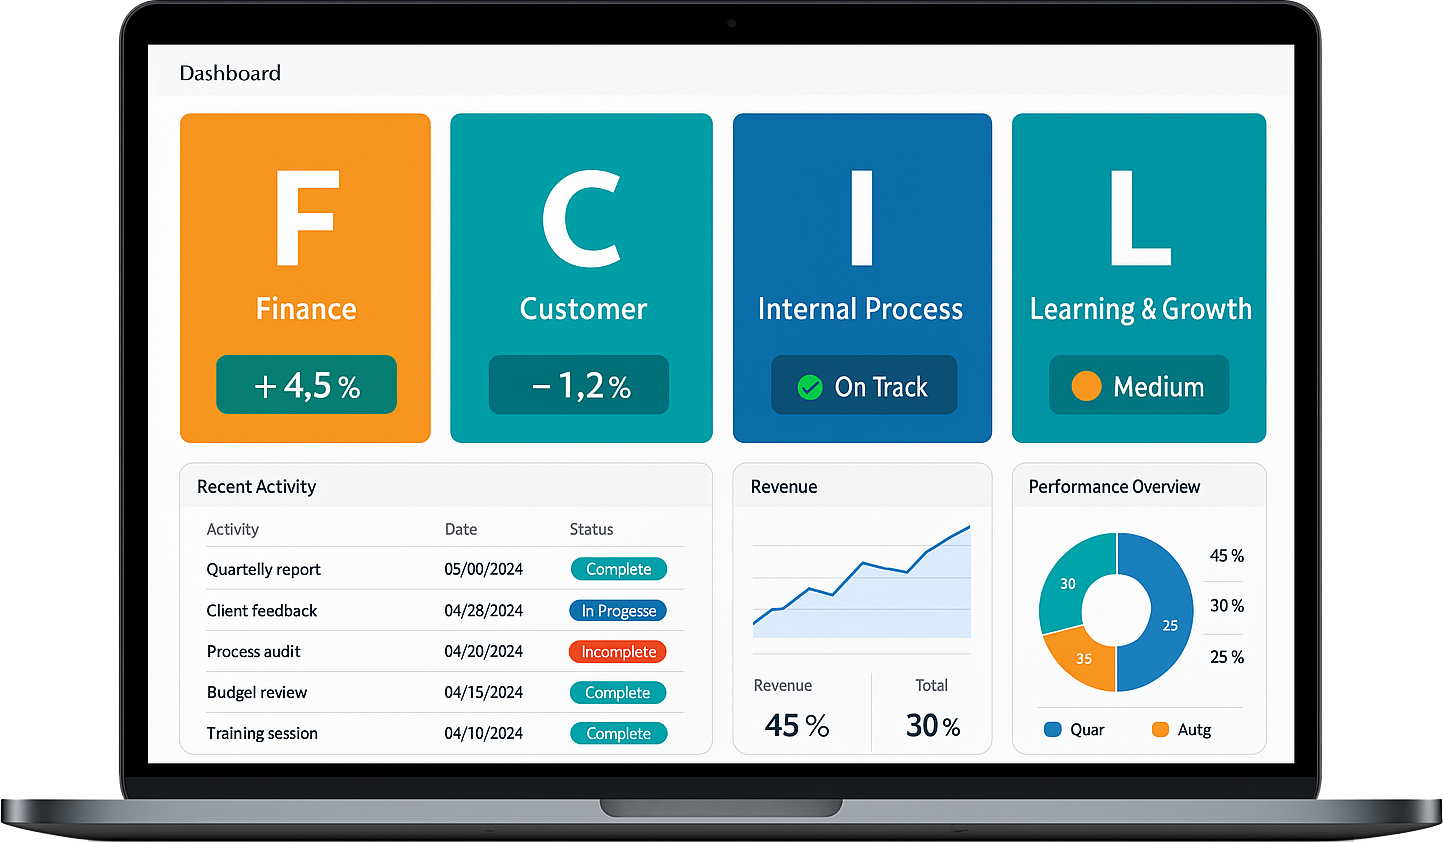
Balanced Scorecard software is a strategic tool used by organisations to measure and manage performance across key business areas. It aligns daily activities with long-term goals by tracking objectives in four main categories: financial, customer, internal processes, and learning and growth. This structured approach helps companies stay focused and ensures that every team works towards the same overall vision.
1. Supporting Lean Thinking with Clear Strategy
Lean management aims to eliminate waste, improve efficiency, and deliver more value to customers. Balanced Scorecard software supports this by clearly displaying goals and performance indicators that matter most. It helps managers spot issues early, set measurable targets, and take action based on real-time data. This ensures that resources are focused on what adds true value to the business.
2. Encouraging Continuous Improvement
With regular tracking and review of key metrics, Balanced Scorecard software encourages a culture of ongoing improvement. Teams can see how their efforts impact wider company goals, making it easier to adjust strategies and improve over time. This aligns well with lean principles, where small, consistent improvements lead to big results.
3. Improving Communication and Focus
The software acts as a central point for sharing performance updates across departments. This improves communication and helps every part of the organisation stay focused on what matters. Everyone knows what their role is, how success is measured, and where they stand in relation to the company’s goals.
In summary, balanced scorecard software is a valuable tool for driving lean management by linking strategy to action, promoting efficiency, and keeping teams aligned and informed.
How SQDCP Boards Help Track Safety, Quality, Delivery, Cost, and People Metrics
SQDCP boards are powerful visual tools used in daily operations to monitor key performance areas: Safety, Quality, Delivery, Cost, and People. By displaying real-time updates, these boards help teams stay focused, make informed decisions, and drive continuous improvement. Each section of the SQDCP board targets a core aspect of business performance, making it easy to track progress and identify issues quickly.
1. Monitoring Safety Performance
The Safety section tracks incidents, near-misses, and compliance with safety procedures. Visual signals like red, yellow, or green indicators alert teams to current safety levels. This helps promote a safe working environment and encourages employees to report and resolve hazards before they lead to accidents.
2. Maintaining Product and Process Quality
Quality metrics may include defects, rework rates, or inspection results. Displaying this data on the board allows teams to detect patterns and correct issues early, helping maintain high standards and customer satisfaction.
3. Ensuring Timely Delivery
The Delivery section tracks whether products or services are completed and delivered on time. Metrics such as on-time delivery percentage help teams manage schedules and adjust resources to avoid delays.
4. Controlling Operational Costs
Cost-related data on the board may include waste, overtime, or budget deviations. Keeping these figures visible allows for quicker action to reduce unnecessary spending and boost efficiency.
5. Supporting People and Engagement
The People section measures aspects like attendance, training, or employee suggestions. It encourages team involvement, supports staff development, and builds a positive workplace culture.
Overall, SQDCP boards make performance tracking simple, visual, and effective—helping businesses stay focused on what matters most every day.
Kanban-Style Tracking: Simplifying Task Management in Lean Environments
Kanban-style tracking is a visual method of task management that fits perfectly within lean environments. By using columns to represent different stages of work—such as "To Do", "In Progress", and "Done"—this system helps teams see the flow of tasks, reduce bottlenecks, and improve efficiency. It supports lean principles by focusing on reducing waste and delivering value faster.
1. Clear Visual Workflow
The heart of Kanban tracking is its simplicity. Tasks are displayed on cards and moved across columns as work progresses. This makes it easy for everyone to see what’s being worked on, what’s coming up, and what has been completed. It improves communication and creates a shared understanding of priorities and progress.
2. Limiting Work in Progress
One of the key benefits of Kanban is its focus on limiting the number of tasks in progress at any one time. This helps prevent overload, reduces switching between tasks, and ensures that work is finished before new tasks are started. Teams can stay focused and maintain a steady workflow.
3. Enabling Continuous Improvement
With regular reviews and updates, teams using Kanban boards can quickly identify delays or inefficiencies. Adjustments can then be made to improve performance over time. This aligns closely with lean principles, encouraging small, ongoing improvements rather than large, disruptive changes.
In summary, Kanban-style tracking simplifies task management, enhances visibility, and supports lean goals—making it a powerful tool for any team focused on efficiency and clarity.
Using Root Cause Analysis Tools (A3 and Fishbone Diagrams) with Your Balanced Scorecard
Integrating root cause analysis tools like A3 reports and fishbone diagrams with your Balanced Scorecard can significantly improve problem-solving and strategic alignment. These tools help teams go beyond surface-level symptoms and uncover the real reasons behind performance gaps, enabling focused and effective action.
1. Aligning Root Cause Analysis with Strategic Goals
Balanced Scorecards track key areas such as financial performance, customer satisfaction, internal processes, and growth. When results fall short in any of these areas, using tools like A3 and fishbone diagrams helps teams dig deeper into the root causes. This ensures that corrective actions are directly tied to strategic objectives and not just temporary fixes.
2. Applying the A3 Approach
The A3 method is a structured problem-solving tool that uses a single page to outline the issue, root cause, countermeasures, and follow-up actions. It promotes clear thinking and accountability, making it ideal for scorecard reviews where clarity and structure are essential.
3. Visualising Issues with a Fishbone Diagram
A fishbone (or cause-and-effect) diagram helps teams visually organise possible causes of a problem. This encourages group discussion and identifies multiple contributing factors across categories like methods, people, materials, and environment. It’s especially useful when scorecard metrics show ongoing challenges that need a deeper look.
In summary, combining balanced scorecards with A3 and fishbone tools enhances both strategy and operations. It supports smarter decisions, ensures root causes are addressed, and drives continuous improvement across the business.
How Actionable Insights Through Traffic-Light Indicators Can Boost Decision-Making
Traffic-light indicators are a simple yet powerful way to present data clearly and support quick decision-making. By using colours like red, amber, and green, these visual signals make it easy to understand performance at a glance. This system helps managers and teams take action promptly, stay focused on priorities, and drive better results across the business.
1. Clear Visual Status Updates
One of the key strengths of traffic-light indicators is their ability to simplify complex information. Green signals that performance is on track, amber warns of potential issues, and red highlights areas needing urgent attention. This colour-coding system removes guesswork and allows users to assess performance quickly without digging through detailed reports.
2. Supporting Faster, Smarter Decisions
When performance data is presented visually, decisions can be made with greater speed and confidence. For example, if a safety metric turns red, the team knows immediate action is needed. If customer feedback trends amber, resources can be redirected to prevent further decline. This rapid response supports continuous improvement and keeps operations running smoothly.
3. Encouraging Accountability and Ownership
Traffic-light indicators also promote accountability. When teams can see how their actions influence results in real time, they are more likely to stay engaged and proactive. It turns data into a daily conversation, not just a monthly report.
In short, traffic-light indicators transform data into clear, actionable insights—helping businesses respond faster, work smarter, and improve outcomes with greater ease.
Visualising KPIs with Trend Charts to Identify and Address Business Issues
Trend charts are an effective way to visualise key performance indicators (KPIs) over time, helping businesses track progress and respond to problems early. By displaying data in a clear, visual format, trend charts make it easier to spot patterns, assess changes, and understand whether performance is improving, staying steady, or declining.
1. Making Performance Data Easy to Understand
With trend charts, data is presented in a line or bar format across days, weeks, or months. This allows teams to see how a specific KPI—such as output, error rates, or delivery times—is performing over time. Unlike raw data tables, charts provide a quick overview that can be shared and understood by all team members.
2. Identifying Patterns and Changes Early
One of the main benefits of using trend charts is their ability to highlight when something starts to shift. A steady drop in output, a sudden rise in customer complaints, or an ongoing delay in delivery can be spotted immediately. This enables faster responses and helps stop small issues before they become larger problems.
3. Supporting Data-Driven Decisions
Trend charts support better decision-making by showing the impact of actions over time. If a new process was introduced, the chart will show whether it made a positive difference. This helps teams adjust plans, improve strategies, and keep goals in focus.
In summary, trend charts turn KPI tracking into a clear and practical tool—helping businesses stay informed, proactive, and focused on continuous improvement.
Why Visual Management Tools Like Balanced Scorecard Software Are Key to Lean Success
Visual management tools, such as Balanced Scorecard software, play a vital role in supporting lean practices across any organisation. They provide a clear, real-time picture of how the business is performing against key goals, helping teams focus on what matters most. These tools help reduce waste, improve flow, and drive continuous improvement—the core principles of lean success.
1. Making Strategy and Goals Visible
Balanced scorecard tools allow organisations to display their main objectives and related metrics in a simple, visual format. This ensures that everyone from top management to the shop floor understands the company’s goals. It aligns daily work with long-term strategy, helping teams stay focused and committed.
2. Improving Communication and Accountability
Visual tools improve communication by making data easy to access and understand. With colour-coded indicators and clear charts, teams can quickly identify what’s working and what needs attention. This encourages faster decision-making and creates accountability, as results are visible to all.
3. Supporting Continuous Improvement
Lean thinking relies on small, steady improvements. Visual management tools support this by allowing regular tracking of key performance indicators. Teams can measure the effects of changes, learn from results, and adjust their approach quickly. This ongoing cycle of review and action builds a strong foundation for long-term success.
In summary, Balanced Scorecard software and other visual tools are essential in lean environments. They bring clarity, focus, and structure—making it easier to achieve efficiency, reduce waste, and drive real progress.
Integrating Lean Practices with Real-Time Performance Tracking via Digital Scorecards
Combining lean practices with real-time performance tracking using digital scorecards brings powerful results to any organisation. It helps eliminate waste, boost productivity, and keep everyone aligned with key business goals. Digital scorecards allow managers and teams to monitor performance instantly, making it easier to take timely action and support continuous improvement.
1. Enabling Fast, Data-Driven Decisions
Real-time tracking means that performance data is updated instantly as activities happen. This allows decision-makers to respond quickly when issues arise. If a delay, error, or drop in quality is spotted, teams can act straight away. This agility is a key strength of lean thinking and helps keep processes smooth and efficient.
2. Aligning Lean Goals with Daily Operations
Lean methods focus on delivering value, reducing waste, and improving flow. Digital scorecards make these goals visible by tracking relevant metrics such as cycle time, downtime, quality levels, and cost efficiency. This visibility ensures that daily activities support the wider lean strategy, keeping everyone on the same page.
3. Driving a Culture of Continuous Improvement
Digital scorecards encourage teams to reflect on performance regularly. With real-time updates and easy-to-read visuals, employees can spot trends, compare results, and identify areas for improvement. This supports a culture where progress is tracked, shared, and acted upon—key to lean success.
In summary, integrating lean practices with digital scorecards strengthens your operations by improving visibility, speeding up decisions, and supporting lasting improvements across all levels.
How to Use Balanced Scorecards for Effective Continuous Improvement and Lean Monitoring
Balanced Scorecards are powerful tools that support both continuous improvement and lean monitoring by helping teams focus on key performance areas. By tracking strategic and operational goals across multiple categories, scorecards offer a clear view of progress and highlight areas needing attention. This structured approach helps organisations stay aligned, reduce waste, and improve over time.
1. Linking Strategy to Daily Activities
A balanced scorecard translates high-level goals into measurable objectives across areas such as operations, finance, customer service, and internal processes. By connecting these goals to daily tasks, teams can see how their work directly supports long-term success. This creates clarity and direction across departments.
2. Tracking Performance in Real Time
With digital scorecards, performance metrics are updated regularly—sometimes instantly—giving managers a real-time view of what’s happening. This helps detect issues early, allowing for fast corrective action. Regular reviews also keep everyone focused on continuous progress rather than reactive fixes.
3. Supporting Lean Principles
Lean practices rely on visibility and data to eliminate waste and drive efficiency. Balanced scorecards reinforce this by showing where performance is off target. Whether it’s longer cycle times or increased costs, the scorecard makes these issues clear, helping teams take informed action to improve outcomes.
In short, using balanced scorecards allows organisations to combine lean thinking with performance management—creating a culture of constant improvement and results-focused decision-making.
Driving Operational Excellence with a Comprehensive Approach to Safety, Quality, and Cost Metrics
Operational excellence is achieved when an organisation consistently delivers value through efficient, safe, and high-quality processes. A key part of this is monitoring safety, quality, and cost metrics in a balanced and ongoing way. When these areas are measured together, it becomes easier to identify problems, improve workflows, and achieve long-term success.
1. Keeping Safety at the Core
Safety is the foundation of any effective operation. By tracking incidents, near-misses, and compliance levels, organisations can quickly identify risks and take steps to protect their teams. A strong focus on safety not only reduces accidents but also builds trust and morale across the workforce.
2. Maintaining Consistent Quality Standards
Quality is closely linked to customer satisfaction and business reputation. Regular monitoring of defect rates, rework, and error trends allows teams to detect problems early and take corrective action. This leads to fewer delays, better outcomes, and less waste throughout the production process.
3. Controlling Costs through Efficient Practices
Cost metrics help reveal where resources are being used inefficiently. By analysing spending, downtime, and productivity data, businesses can make smarter decisions that reduce waste without sacrificing performance. Cost control becomes more effective when paired with quality and safety metrics, creating a more complete view of operations.
In summary, focusing on safety, quality, and cost together allows organisations to work smarter, respond faster, and reach higher standards—building a strong foundation for continuous improvement and excellence.
Simplifying Complex Data with Visual Dashboards and Kanban for Task Progress
In today’s fast-paced business world, simplifying complex data is essential for effective decision-making and task management. Visual dashboards and Kanban boards offer intuitive, easy-to-understand solutions to monitor and manage task progress, turning complex data into actionable insights.
1. Enhancing Visibility with Visual Dashboards
Visual dashboards provide a clear, at-a-glance overview of key performance indicators (KPIs), project statuses, and team progress. By using charts, graphs, and colour-coded metrics, these dashboards allow teams to quickly identify trends, track progress, and spot any issues. This real-time visibility ensures that everyone is aligned and can take immediate action when necessary.
2. Organising Tasks with Kanban Boards
Kanban boards are a highly effective tool for tracking task progress. By visually representing tasks in columns such as "To Do," "In Progress," and "Completed," Kanban helps teams manage workloads, prioritise tasks, and visualise bottlenecks. It makes it clear who is working on what and how close each task is to completion, improving workflow efficiency and collaboration.
3. Streamlining Communication and Collaboration
Both visual dashboards and Kanban boards promote clear communication and teamwork. As team members update the status of tasks and KPIs, everyone remains informed and on the same page. This reduces misunderstandings, fosters collaboration, and ensures that team efforts are aligned with overall goals.
In summary, by integrating visual dashboards and Kanban boards, businesses can simplify complex data, improve task management, and foster a more efficient, collaborative work environment.
The Role of SQDCP Boards in Ensuring Cross-Departmental Alignment and Focus
SQDCP boards, which track Safety, Quality, Delivery, Cost, and People metrics, play a crucial role in ensuring cross-departmental alignment and focus within an organisation. These boards help various teams and departments work together towards common goals, improving overall efficiency and performance.
1. Improving Visibility Across Teams
One of the key benefits of SQDCP boards is their ability to make performance metrics visible to all departments. By displaying essential data such as safety records, quality standards, delivery timelines, cost control, and employee morale, everyone can see how their work contributes to the broader organisational goals. This transparency helps align teams around shared objectives and creates a sense of accountability.
2. Encouraging Collaboration and Communication
When all departments are aware of the key performance indicators (KPIs) that matter, it encourages open communication and collaboration. For instance, the operations team may collaborate with the safety department to address concerns that impact both quality and delivery. SQDCP boards facilitate these conversations, ensuring that solutions are aligned with overall business priorities.
3. Aligning Goals and Priorities
SQDCP boards help ensure that departments are working toward common, prioritised goals. By tracking key metrics across different areas, teams can identify potential roadblocks and adjust their strategies accordingly. This unified focus fosters better decision-making and drives continuous improvement across the organisation.
In conclusion, SQDCP boards are invaluable tools for aligning departments, enhancing communication, and ensuring a shared commitment to key business objectives, ultimately leading to greater operational success.
How Balanced Scorecard Software Helps Create a Culture of Accountability and Performance
Balanced Scorecard software is an effective tool for fostering a culture of accountability and performance within an organisation. By linking strategic objectives to measurable goals, this software helps teams stay focused, track progress, and take ownership of their performance, driving continuous improvement across all levels.
1. Clear Alignment with Organisational Goals
Balanced Scorecard software ensures that individual and team goals are directly aligned with the broader organisational strategy. This clarity makes it easier for employees to understand how their daily tasks contribute to long-term success, reinforcing accountability and encouraging proactive behaviour towards achieving business objectives.
2. Transparent Performance Metrics
One of the key advantages of balanced scorecard software is its ability to display performance metrics transparently. When performance data is visible to all team members, it creates a sense of responsibility. Employees can track their progress, identify areas for improvement, and stay motivated to meet targets. This openness fosters a culture where everyone is accountable for their results.
3. Real-Time Feedback and Continuous Improvement
With real-time updates and feedback, Balanced Scorecard software allows organisations to quickly identify underperformance and take corrective action. Regular performance reviews based on accurate data lead to more informed decision-making, better coaching, and an ongoing commitment to growth. As a result, teams consistently strive for excellence, knowing their efforts are closely monitored and valued.
In conclusion, balanced scorecard software helps build a culture of accountability by providing clear goals, transparent metrics, and continuous feedback, ultimately driving better performance and organisational success.
Customising Balanced Scorecards to Reflect Your Organisation’s Lean Goals and Priorities
Customising balanced scorecards to align with your organisation’s Lean goals and priorities is essential for ensuring that all efforts are directed towards continuous improvement and operational excellence. A tailored balanced scorecard not only supports the overarching strategy but also promotes a culture of efficiency, waste reduction, and value creation.
1. Aligning Key Performance Indicators (KPIs) with Lean Objectives
To begin, you should adjust the key performance indicators (KPIs) to reflect the specific Lean principles your organisation is focusing on, such as reducing cycle time, minimising waste, and improving flow. These KPIs should clearly capture improvements in process efficiency, employee engagement, customer satisfaction, and quality—all fundamental elements of Lean methodology.
2. Prioritising Process Improvements
Incorporating Lean priorities such as eliminating bottlenecks and enhancing production efficiency into your Balanced Scorecard ensures that these areas remain at the forefront of decision-making. Each department or team should have measurable targets that reflect their contributions to streamlining operations, improving quality, and cutting unnecessary costs.
3. Driving Continuous Improvement Through Regular Review
Regularly reviewing and updating your scorecard is crucial to maintaining momentum in Lean initiatives. This ensures that the data remains relevant, and teams stay focused on the most impactful areas of improvement. By continuously assessing progress, organisations can make necessary adjustments and stay on track towards achieving their Lean goals.
In conclusion, customising your balanced scorecard to reflect Lean goals not only enhances organisational focus but also helps drive sustainable improvements that lead to greater operational efficiency and success.
Case Study: How UK Manufacturers Leverage SQDCP, Kanban, and Balanced Scorecards for Lean Transformation
UK manufacturers have increasingly embraced the power of SQDCP boards, Kanban systems, and balanced scorecards as part of their Lean transformation strategies. By integrating these tools, organisations can improve operational efficiency, boost productivity, and foster a culture of continuous improvement across all departments.
1. Streamlining Operations with SQDCP Boards
Many UK manufacturers use SQDCP boards to track Safety, Quality, Delivery, Cost, and People metrics, ensuring a balanced approach to performance. These boards provide clear visibility into key areas of the business, helping teams stay focused on reducing waste and improving quality. By monitoring these critical aspects, manufacturers can quickly identify bottlenecks and inefficiencies, leading to timely corrective actions.
2. Visualising Workflows with Kanban
Kanban boards have become a staple in UK manufacturing environments, offering a simple yet effective way to visualise work progress. With colour-coded cards representing tasks and stages of completion, teams can easily manage workloads, ensure the smooth flow of production, and reduce cycle times. Kanban supports the Lean goal of continuous flow by highlighting areas that need attention and preventing overproduction or underproduction.
3. Tracking Performance with Balanced Scorecards
Balanced scorecards allow UK manufacturers to align daily operations with long-term strategic goals. These tools help track performance across financial, customer, internal processes, and learning and growth perspectives. By regularly updating scorecards, manufacturers ensure that everyone from the shop floor to management is aligned and working towards common objectives, driving consistent improvements in overall performance.
In conclusion, the combination of SQDCP boards, Kanban, and balanced scorecards provides UK manufacturers with the tools they need to drive their Lean transformation initiatives successfully, improving efficiency, reducing costs, and enhancing overall competitiveness.