What’s the Difference Between a Balanced Scorecard and a KPI Dashboard?
While both a Balanced Scorecard and a KPI dashboard are valuable tools for tracking performance, they serve different purposes and offer different types of insights. Understanding the difference between them can help businesses use each one more effectively.
Balanced Scorecard: Strategy-Focused
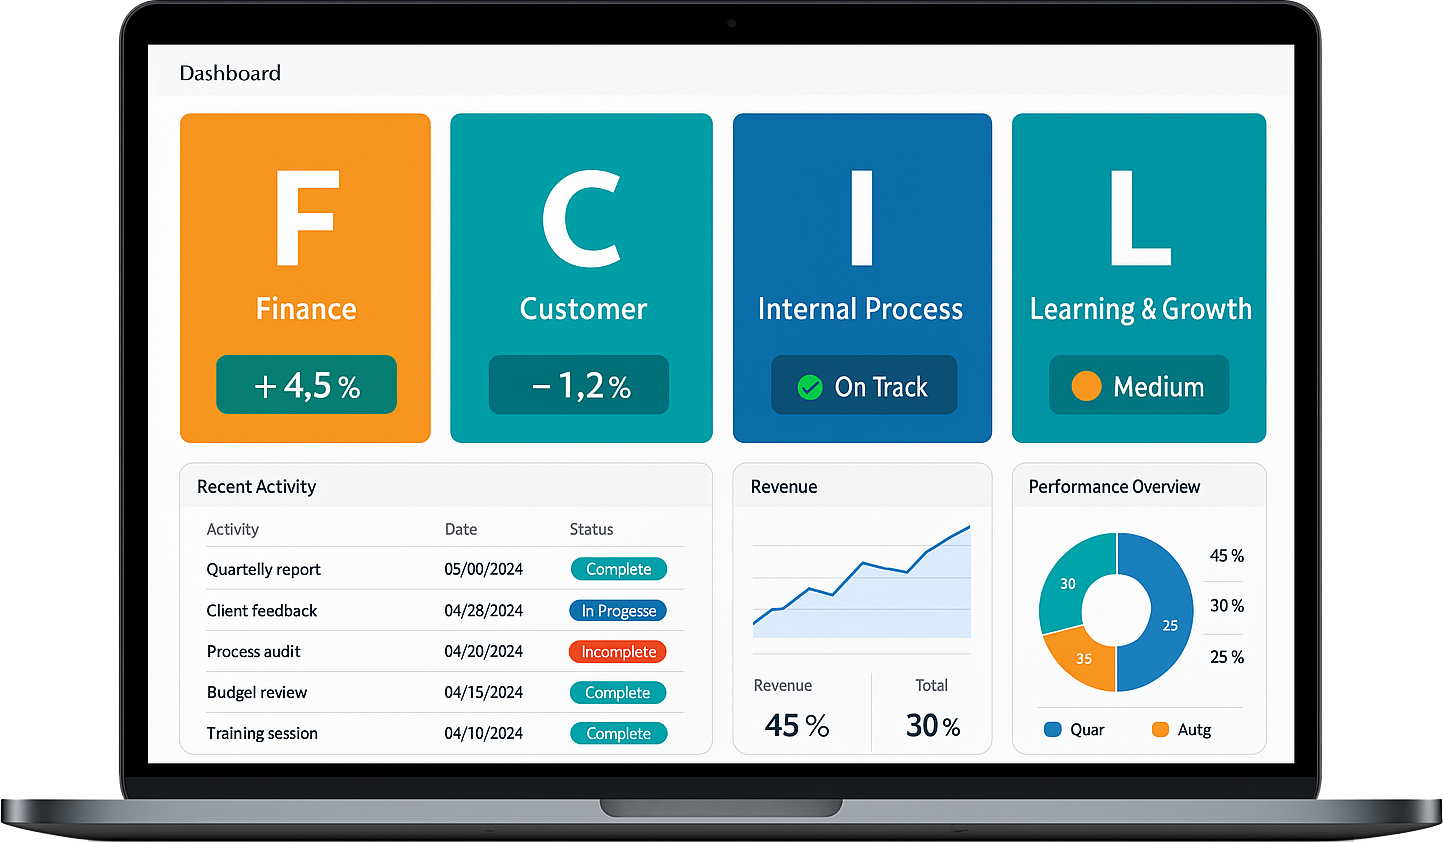
A balanced scorecard is a strategic planning tool that helps organisations align their day-to-day activities with long-term goals. It looks beyond just financial results and covers four key areas: financial, customer, internal processes, and learning and growth. This broader view helps ensure that all areas of the business are contributing to overall success. It also encourages teams to focus on long-term improvements rather than only short-term results.
KPI Dashboard: Performance Monitoring
In contrast, a KPI dashboard provides a real-time view of key performance indicators. It shows how different parts of the business are performing through easy-to-read visuals like charts and graphs. Dashboards are great for day-to-day tracking and quick decision-making, especially when immediate action is needed. However, they often focus on specific metrics rather than the bigger picture of strategy.
Working Together
Although different, both tools can work well together. The balanced scorecard helps define which KPIs are most important, while the dashboard tracks those KPIs in real time. Used together, they give businesses a strong combination of strategic focus and practical performance tracking.
How to Combine Scorecards and Dashboards for Smarter Strategy Execution
Combining Balanced Scorecards and KPI dashboards allows businesses to link long-term strategy with real-time performance. When used together, these tools provide a complete view of where the organisation is headed and how well it's performing right now. This makes strategy execution clearer, more focused, and easier to manage.
Use the Scorecard to Define Strategic Objectives
The Balanced Scorecard helps businesses set clear goals across key areas like finance, customers, internal processes, and staff development. These objectives are not just targets—they reflect the overall direction the business wants to move in. Each goal is supported by measurable indicators that show progress over time.
Use Dashboards to Monitor Progress Daily
Dashboards turn those indicators into live data visuals. They make it easy to spot trends, problems, or successes as they happen. While the scorecard helps keep teams aligned with strategy, the dashboard ensures that action is taken quickly when performance shifts. This balance is key to staying on track.
Make Strategic Decisions Based on Real Data
When scorecards and dashboards are linked, leaders can adjust plans based on facts, not guesswork. If a certain strategy isn’t delivering the expected results, the dashboard will highlight the issue early, and the scorecard can be updated accordingly.
In short, combining these tools helps organisations stay strategic and responsive at the same time, leading to better decisions and stronger results.
Why Visual KPI Dashboards Help You Make Faster Business Decisions
Visual KPI dashboards play a key role in helping businesses respond quickly and confidently to changing conditions. By turning raw data into clear visuals, dashboards allow managers and teams to understand performance at a glance, without the need for deep analysis or time-consuming reports.
Instant Visibility Across Key Areas
Dashboards display key performance indicators in real-time, making it easy to see how different parts of the business are performing. Whether it’s production, sales, or operations, leaders can quickly spot areas that need attention and take action immediately. This visibility reduces the time spent searching for answers and increases decision speed.
Simplifying Complex Information
Instead of sifting through spreadsheets or reports, dashboards present data in easy-to-read charts, graphs, and colour-coded visuals. This helps teams of all levels understand performance trends, spot issues, and track progress without needing specialist knowledge. The simplicity of presentation supports quicker understanding and better team alignment.
Better Communication and Focus
Visual dashboards also support clearer communication. Teams can share information more easily and stay focused on the right priorities. When everyone can see the same data, it encourages faster discussions, quicker updates, and more aligned action across departments.
In today’s fast-paced world, businesses that use visual KPI dashboards are better equipped to act quickly, reduce delays, and stay ahead of the curve.
Tracking Key Metrics Across Financial, Customer, Process & Learning Goals
Monitoring the right performance metrics is essential for any organisation aiming for balanced and long-term growth. Using a structured approach helps businesses keep track of progress across different areas, not just financial results. Focusing on financial, customer, internal process, and learning goals allows teams to stay aligned and improve overall performance.
Financial Metrics
Financial indicators such as revenue growth, cost control, and profit margins help assess the health of the business. These metrics show how well the organisation is using its resources and whether it is achieving its targets over time.
Customer-Focused Measures
Customer metrics provide insight into satisfaction, loyalty, and service quality. Monitoring feedback, response times, and repeat business helps identify trends and areas where customer experience can be improved.
Internal Process Indicators
By measuring how efficiently operations are running, businesses can spot bottlenecks and areas for improvement. Metrics might include cycle time, error rates, or on-time delivery – all crucial for maintaining high-quality service and output.
Learning and Growth Insights
This area focuses on staff development, training effectiveness, and innovation. Metrics might include employee engagement, training completion rates, or skill improvements. These help track how well the organisation is preparing for future success.
Tracking these four areas together gives a balanced view of performance and supports better strategic decisions, keeping every part of the organisation moving in the same direction.
How a Balanced Scorecard Translates Strategy into Clear KPIs
The Balanced Scorecard is a powerful tool that helps organisations turn high-level strategies into practical actions. By linking long-term goals to everyday activities, it ensures that everyone across the business understands what needs to be achieved and how progress will be measured. This method makes complex strategies more manageable and results more trackable.
Breaking Down Strategic Goals
Strategies often start broad, focusing on growth, customer satisfaction, or operational excellence. The Balanced Scorecard breaks these down into specific, achievable objectives across four key areas: financial, customer, internal process, and learning and development. This structure makes it easier to focus efforts where they are most needed.
Defining Measurable KPIs
Once objectives are clear, the next step is to create key performance indicators (KPIs) that show whether progress is being made. For example, a goal to improve customer service might have a KPI like reducing support response times or increasing satisfaction scores. These metrics make it possible to track success over time.
Aligning Teams and Resources
The balanced scorecard ensures that teams understand how their work contributes to wider business goals. By aligning tasks, responsibilities, and resources with strategic KPIs, the entire organisation moves in the same direction, improving focus and results.
Overall, the Balanced Scorecard makes strategy visible and measurable, helping businesses stay on course and make informed decisions for long-term success.
Using Dashboards to Monitor Strategic Progress in Real Time
Dashboards offer a smart, efficient way for organisations to monitor strategic progress as it happens. With real-time data displayed in a clear, visual format, decision-makers can quickly spot trends, track performance, and adjust actions to stay aligned with business goals. This approach replaces guesswork with informed decision-making.
Visualising Key Performance Metrics
A well-designed dashboard brings together important metrics from across the business, all in one place. It provides an at-a-glance view of how different departments or projects are performing in relation to strategic targets. This makes it easier to detect issues early and celebrate wins when goals are being met.
Supporting Faster, Smarter Decisions
When leaders can see real-time updates on key indicators, they’re better equipped to act quickly and effectively. Whether it’s a dip in customer satisfaction or a rise in operational costs, a dashboard helps identify the cause and take corrective action before problems grow.
Keeping Everyone on the Same Page
Dashboards also support team alignment by giving everyone access to the same information. From senior managers to frontline teams, having a shared understanding of goals and progress encourages accountability and collaboration.
In summary, real-time dashboards are a valuable tool for driving strategy execution. By offering clear insights into performance, they help organisations stay agile, focused, and on track to meet their long-term objectives.
Setting Up the Right KPIs for Your Balanced Scorecard Framework
Choosing the right KPIs (Key Performance Indicators) is a vital step in making your Balanced Scorecard effective. KPIs help translate your organisation’s strategy into measurable goals, giving a clear picture of how well you’re performing across different areas. Without the right KPIs, it becomes difficult to track progress or make informed decisions.
Aligning KPIs with Strategic Objectives
Each KPI should be directly linked to a strategic goal. Start by reviewing the four key perspectives of your Balanced Scorecard—financial, customer, internal process, and learning and growth. Identify what success looks like in each area and define KPIs that reflect those goals. This ensures that every metric is relevant and supports the bigger picture.
Choosing Clear and Measurable Metrics
Effective KPIs are easy to understand and measure. They should be specific enough to guide action and broad enough to cover important outcomes. Avoid vague or overly complex metrics. Instead, focus on figures that can be tracked regularly, such as response times, customer retention, or on-time delivery rates.
Reviewing and Updating KPIs Regularly
Your business will evolve, and so should your KPIs. Make time to review them periodically to ensure they still reflect your current strategy. Remove outdated metrics and add new ones as needed to stay aligned with changing priorities.
By setting the right KPIs, your balanced scorecard becomes a powerful tool for driving performance and long-term growth.
Benefits of Integrating BSC Software with Live Dashboard Reporting
Integrating Balanced Scorecard (BSC) software with live dashboard reporting brings powerful benefits to organisations aiming for better strategic control and visibility. This combination transforms static strategy documents into dynamic, real-time tools that support faster and smarter decision-making across all levels.
Real-Time Monitoring of Key Metrics
Live dashboards display up-to-date data linked directly to your strategic goals. This allows teams and leaders to see progress instantly, without waiting for manual updates or monthly reports. Early detection of issues means faster responses and fewer surprises.
Better Strategic Alignment
When BSC software is linked to dashboards, everyone from frontline staff to senior leaders has access to the same clear performance view. This encourages accountability and helps keep daily actions aligned with long-term goals. Teams stay focused and understand how their work contributes to wider objectives.
Time-Saving and Reduced Manual Work
Manually collecting and updating KPI data can be time-consuming and prone to errors. Integrated systems automate these tasks, saving time and reducing the risk of inaccuracies. This allows your team to focus on analysis and action, rather than data entry.
Improved Communication and Decision-Making
Live dashboards offer a simple and visual way to present complex data. They improve internal communication and support quicker decisions by making performance trends easy to understand. This helps managers and teams work more efficiently together.
By combining BSC software with live dashboards, organisations can improve agility, enhance performance tracking, and drive real strategic success.
From Data to Action: How Dashboards Drive Accountability
Dashboards play a key role in turning data into meaningful action by offering clear, real-time visibility into performance. When used correctly, they help build a culture of accountability across teams and departments, ensuring everyone stays focused on shared goals.
Clarity on Performance Expectations
A well-designed dashboard makes it easy to understand what is being measured and why. When team members can clearly see the key performance indicators linked to their roles, they are more likely to take ownership of their results. Everyone knows what success looks like and how their efforts contribute to it.
Transparent Tracking and Visibility
Dashboards remove ambiguity by offering an honest view of performance data. This transparency helps avoid confusion or miscommunication, making it easier to spot what’s working and where improvements are needed. Open access to this information creates trust and encourages constructive conversations.
Encouraging Timely Action
Because dashboards update in real time, they allow for quicker decisions and faster responses. When performance drops or targets are missed, teams can take immediate action. This speed is essential for solving issues before they grow into larger problems.
Driving a Results-Focused Culture
When data is visible and regularly reviewed, it reinforces a mindset focused on results. Teams learn to track progress regularly, celebrate wins, and take responsibility for shortfalls. This helps shift the organisation from reactive to proactive, improving outcomes across the board.
Creating Custom Dashboards That Match Your Business Objectives
Custom dashboards are essential tools that help organisations align day-to-day operations with long-term business goals. By tailoring dashboards to your specific objectives, you can gain clearer insight into what matters most, improve decision-making, and enhance team performance.
Aligning Dashboards with Strategic Goals
The first step in creating a custom dashboard is identifying your key business objectives. Whether your focus is on customer satisfaction, production efficiency, cost control, or growth, your dashboard should highlight the metrics that reflect progress in those areas. This ensures that teams stay focused on what drives success.
Selecting the Right KPIs
Not all data is equally useful. Effective dashboards use carefully chosen key performance indicators (KPIs) that are relevant, measurable, and aligned with your goals. Keeping the display clear and uncluttered helps teams easily interpret the information and act on it without delay.
Enabling Real-Time Insights
Custom dashboards provide real-time updates, offering an up-to-date picture of performance across departments. This allows managers and staff to spot issues early, respond faster, and maintain control over progress without relying on delayed reports.
Improving Collaboration and Accountability
When teams can see performance metrics that relate directly to their work, it boosts accountability and encourages collaboration. Everyone understands how their contributions support the bigger picture, which leads to improved alignment and stronger overall results.
Common Mistakes to Avoid When Building KPI Dashboards
KPI dashboards are powerful tools for tracking business performance, but they must be built correctly to deliver real value. Poor design, unclear data, or irrelevant metrics can lead to confusion rather than clarity. Avoiding common mistakes helps ensure your dashboard becomes a reliable decision-making asset.
Choosing Too Many Metrics
One of the most common issues is including too many KPIs on a single dashboard. This can overwhelm users and make it hard to focus on what truly matters. Instead, choose a small set of meaningful indicators that are directly linked to your goals and strategy.
Using Unclear or Inconsistent Data
If the data feeding your dashboard is unreliable or not updated regularly, it can mislead users and result in poor decisions. Ensure your data sources are accurate, consistent, and up to date. Clear labelling and simple formatting also help improve understanding.
Failing to Match Metrics to Business Goals
A dashboard should reflect what your business is trying to achieve. If your KPIs are not tied to strategic objectives, you risk measuring the wrong things. Always align your dashboard content with company targets to keep efforts focused and relevant.
Overcomplicating the Design
Effective dashboards are easy to read at a glance. Using too many colours, complex charts, or unclear layouts can distract from the message. Keep it clean, consistent, and visually simple to maximise impact and usability.
Balanced Scorecard vs KPI Dashboard: Which One Do You Need?
Both the Balanced Scorecard and KPI Dashboard are valuable tools used to track and manage business performance. While they may seem similar at first glance, they serve different purposes and are best suited to different business needs. Understanding the key differences can help you choose the right approach for your organisation.
Understanding the Balanced Scorecard
The Balanced Scorecard is a strategic planning tool designed to link a company’s vision and mission to specific goals. It looks at four key areas: financial performance, customer satisfaction, internal processes, and learning and growth. This method provides a complete view of organisational performance, helping leaders focus on long-term objectives.
What a KPI Dashboard Offers
A KPI Dashboard, on the other hand, is a more focused, real-time visual display of key performance indicators. It gives a quick snapshot of how specific parts of the business are performing. Dashboards are ideal for monitoring daily operations, spotting trends, and responding quickly to changes.
Which One Should You Choose?
If your goal is to align teams with long-term strategy and track progress across different perspectives, the Balanced Scorecard is the right fit. If you need to monitor immediate performance and make fast decisions, a KPI Dashboard is more suitable. In many cases, combining both tools gives the best results by supporting both strategic alignment and day-to-day management.
Using Dashboards to Communicate Strategy Across Teams
Clear communication is key when it comes to successful strategy execution. One of the most effective ways to share strategic goals across departments is by using dashboards. These visual tools help break down complex plans into easy-to-understand information, making it simpler for teams to stay aligned and focused on shared objectives.
Making Strategy Visible and Understandable
Dashboards turn business strategies into clear visuals, such as charts, graphs, and progress bars. When teams can see goals and performance indicators in real time, it removes guesswork and builds a shared understanding of what matters most. This visibility helps every department understand how their work supports the wider business strategy.
Encouraging Accountability and Team Focus
By displaying real-time data, dashboards highlight both achievements and areas needing attention. This encourages accountability, as teams can track their own progress and quickly see how their actions impact company goals. Regular dashboard reviews also keep strategy front of mind and support better decision-making at every level.
Connecting Daily Tasks with Big-Picture Goals
Dashboards link everyday tasks to overall objectives. Whether it's tracking customer service targets or production metrics, team members can easily see how their efforts contribute to wider goals. This connection builds engagement and helps everyone move in the same direction, improving results and driving growth.
Choosing the Right Software for Scorecards and KPI Visualisation
Selecting the best software for scorecards and KPI visualisation is an important step in making your business strategy clear and measurable. The right tool should support goal setting, performance tracking, and team alignment, all in one easy-to-use platform. With so many choices available, it’s important to focus on the features that truly support long-term success.
Look for User-Friendly Interfaces
The software should be simple to use, even for team members without technical backgrounds. A clear layout with drag-and-drop features, easy navigation, and customisable visuals helps everyone stay engaged with the data. If your team can update and access scorecards with ease, they’re more likely to use them regularly.
Customisation and Flexibility
Your software should adapt to your unique business goals and structure. This means the ability to create scorecards that reflect your own strategic themes, KPIs, and reporting needs. Whether you run a single site or multiple departments, flexibility ensures that the tool works for every part of your organisation.
Real-Time Data and Integration
For the best results, choose software that updates in real time and connects smoothly with your existing systems. When your KPIs are always up to date, teams can make faster, data-driven decisions. Integration with other platforms also saves time and reduces the need for manual reporting.
Real-World Examples: How Dashboards and BSCs Power Business Growth
Dashboards and balanced scorecards (BSCs) have become essential tools for many organisations looking to grow and improve performance. They provide a clear and structured way to monitor progress, align strategy, and make informed decisions. Here are some real-world examples of how businesses are benefiting from these tools in practice.
Improving Departmental Alignment
One organisation used a Balanced Scorecard to align its departments with its strategic goals. By creating specific objectives for finance, customer service, internal processes, and learning, each team had a clear role in achieving overall success. The visual dashboard helped highlight areas needing improvement, which allowed managers to take swift action.
Boosting Productivity Through Data Visibility
A growing business integrated live dashboards across its operational teams. With performance data updated in real time, teams could identify delays and act quickly to reduce downtime. The result was faster decision-making, better time management, and measurable gains in output across several departments.
Tracking Growth with KPIs
Another example involved a company using scorecards to track its expansion efforts. Key performance indicators were monitored closely through a central dashboard, allowing leadership to adjust strategy based on real results. This proactive approach helped avoid risks and maintain steady growth throughout the process.
By combining clear strategy with ongoing performance tracking, dashboards and BSCs give businesses the insight they need to grow with confidence.