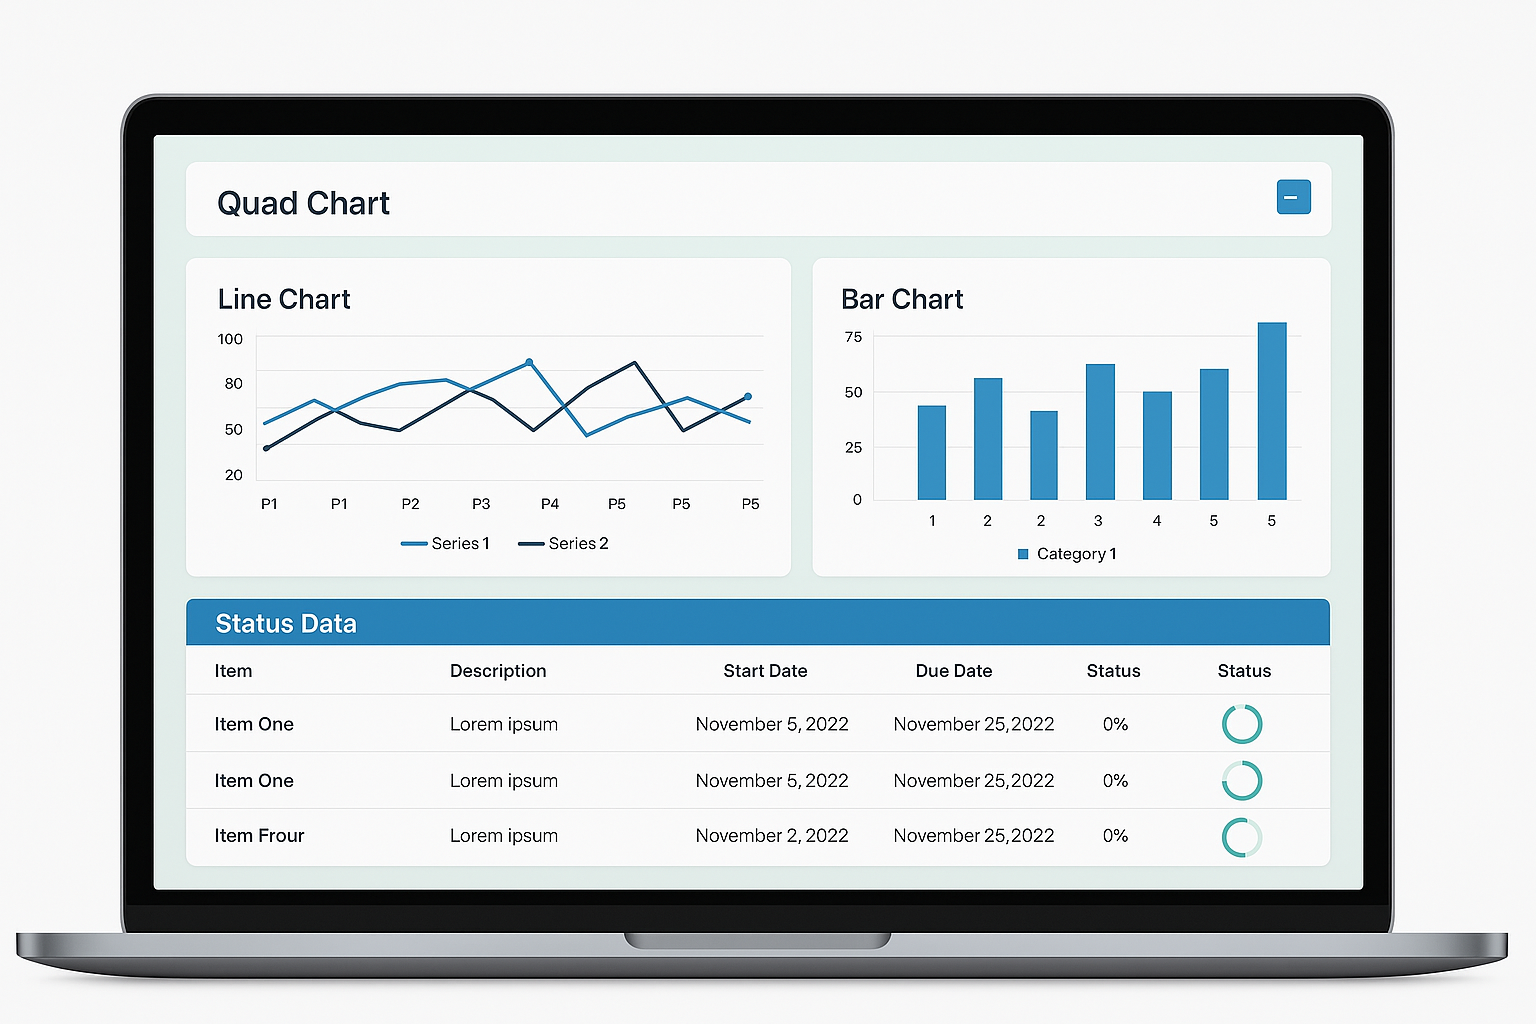
Quad charts are a highly effective visual tool used in strategic planning and project management. They help condense complex information into an easy-to-understand format, facilitating decision-making and communication among stakeholders. A quad chart divides a single page into four quadrants, each focusing on a different aspect of a project, strategy, or concept. This structured format ensures that critical information is presented clearly and concisely.

Structure of a Quad Chart
Overview or Summary: This quadrant provides a high-level summary of the project or strategy. It includes essential details such as the project name, objectives, key milestones, and a brief description. The goal is to give a snapshot of what the project is about and its main goals.
Technical or Detailed Description: Here, more detailed information about the project or strategy is presented. This could include technical specifications, methodologies, or in-depth descriptions of the processes involved. It’s crucial for providing the necessary details that underpin the summary provided in the first quadrant.
Benefits and Justification: This quadrant outlines the expected benefits of the project or strategy. It may include anticipated outcomes, return on investment (ROI), and the overall value proposition. This section justifies why the project or strategy is important and what advantages it offers.
Timeline and Milestones: The final quadrant is dedicated to the project timeline, key milestones, and major deliverables. This helps stakeholders understand the schedule and critical checkpoints, providing a clear roadmap of the project's progress and important dates.
Advantages of Using Quad Charts
Clarity and Conciseness: Quad charts distill complex information into a straightforward format, making it easier for stakeholders to grasp the essential points quickly. This is particularly useful in presentations and reports where time and space are limited.
Enhanced Communication: By organising information into distinct quadrants, quad charts facilitate clearer communication among team members and stakeholders. Each section addresses a specific aspect of the project, reducing misunderstandings and ensuring that everyone is on the same page.
Improved Decision-Making: The structured format of a quad chart aids in better decision-making. By presenting a balanced view of the project's summary, details, benefits, and timeline, stakeholders can make more informed decisions based on a comprehensive understanding of the project.
Flexibility and Adaptability: Quad charts are versatile and can be adapted to various types of projects and strategic planning needs. Whether used for business proposals, research projects, or strategic initiatives, they provide a flexible framework for organising information.
Creating an Effective Quad Chart
Define the Purpose: Clearly understand the purpose of the quad chart and the key message you want to convey. Tailor the content to meet the needs of your audience.
Gather Information: Collect all relevant information for each quadrant. Ensure that the data is accurate, up-to-date, and pertinent to the project or strategy.
Organise Content: Arrange the information logically within each quadrant. Use bullet points, short sentences, and visual aids such as charts or diagrams to enhance clarity.
Design the Chart: Use a clean and professional design. Consistent formatting, readable fonts, and adequate spacing are essential for creating a visually appealing quad chart.
Review and Revise: Before finalising the quad chart, review it for accuracy and completeness. Seek feedback from colleagues or stakeholders to ensure that it effectively communicates the intended message.
Quad charts are a powerful tool for strategic planning and project management. They offer a clear, concise, and structured way to present complex information, enhancing communication and decision-making. By organising key information into four distinct quadrants, quad charts ensure that stakeholders can quickly grasp the essential aspects of a project or strategy, making them an invaluable asset in any strategic planning toolkit.