A SIPOC diagram is an essential tool in process management and improvement methodologies such as Lean, Six Sigma, and Total Quality Management (TQM). It provides a structured framework that helps organizations understand and optimize their processes by focusing on five key components: Suppliers, Inputs, Process, Outputs, and Customers. SIPOC diagrams offer a high-level view of a process, helping teams identify areas for improvement, improve communication, and align internal functions.
What is a SIPOC Diagram?
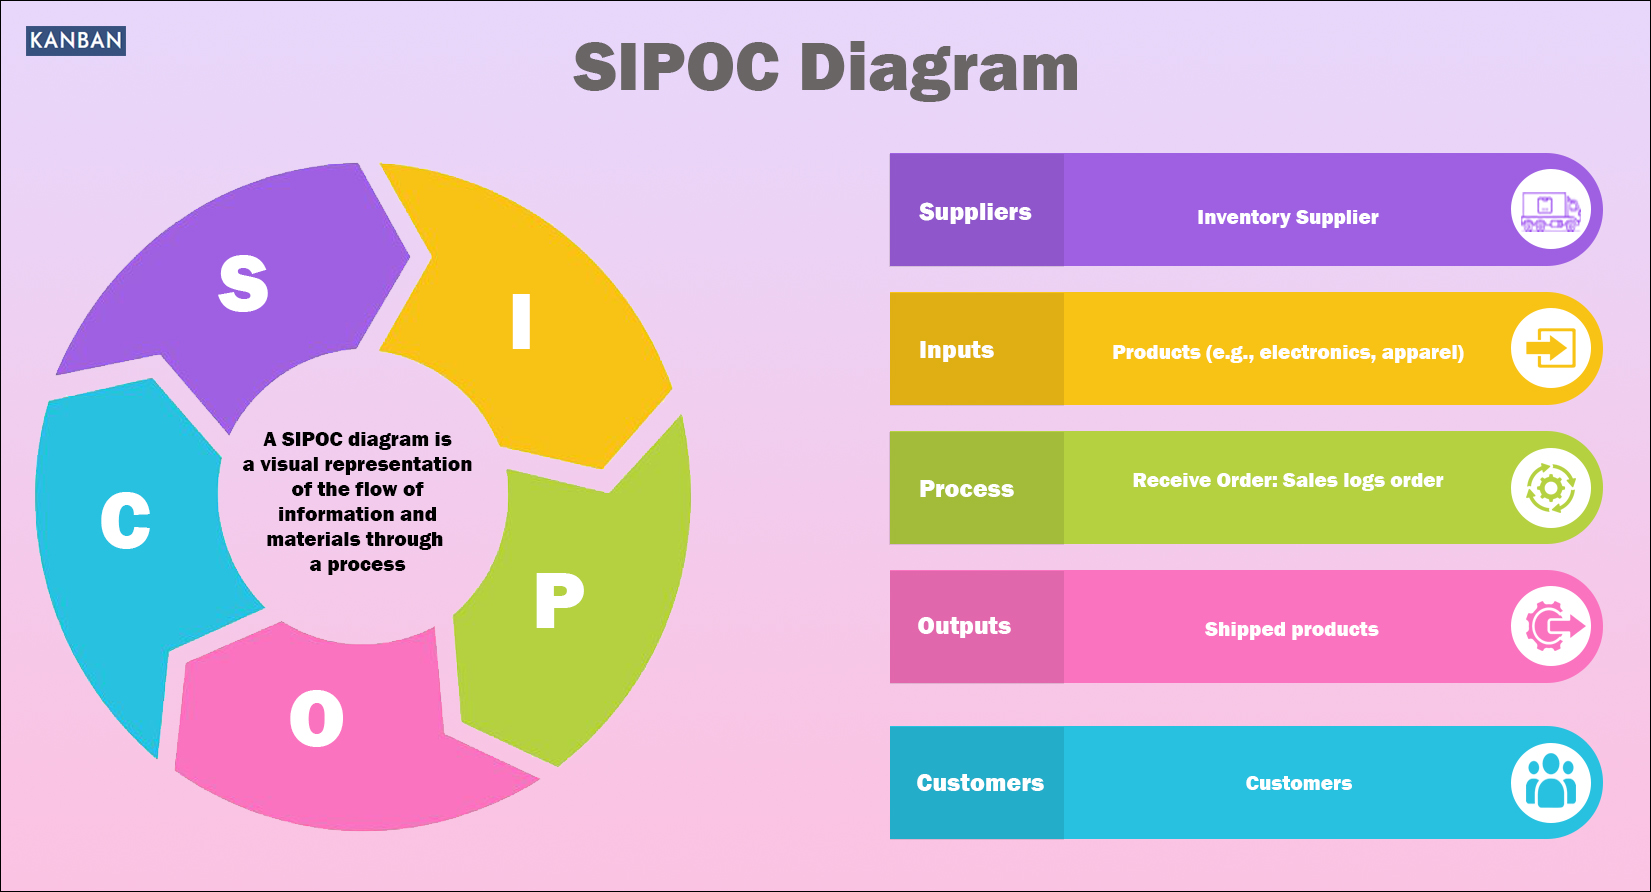
A SIPOC diagram is a visual representation of the flow of information and materials through a process. It captures the critical elements in five steps:
- Suppliers: Individuals or entities (internal or external) that provide the necessary inputs to the process.
- Inputs: Resources, materials, or data required to carry out the process.
- Process: The set of activities or steps that transform inputs into outputs. Usually broken down into three to five steps.
- Outputs: The products, services, or deliverables generated by the process.
- Customers: The end recipients of the outputs, either internal departments or external customers.
Benefits of a SIPOC Diagram
1. Clear Process Overview: SIPOC diagrams provide a bird’s-eye view of a process, making it easier to understand how different components interact.
2. Improved Communication: Mapping processes visually helps bridge communication gaps between departments and ensures everyone understands their role.
3. Focus on Improvement: SIPOC diagrams make it easier to identify inefficiencies, bottlenecks, or areas for improvement.
4. Aligns Teams: SIPOC diagrams align teams by defining roles and responsibilities clearly.
How to Create a SIPOC Diagram
1. Define the Process: Identify the process to be improved and define the beginning, end, and key steps.
2. List Suppliers: Identify the suppliers that provide inputs.
3. Identify Inputs: Determine the necessary resources or materials.
4. Map Process Steps: Break the process into 3-5 core steps.
5. Define Outputs: List the deliverables produced by the process.
6. Identify Customers: Specify the customers (internal or external) who receive the outputs.
SIPOC Diagram: Order Fulfillment Process
| ???? Suppliers | ???? Inputs | ???? Process | ???? Outputs | ???? Customers |
|---|---|---|---|---|
| ???? Inventory Supplier | ???? Products (e.g., electronics, apparel) | 1️⃣ Receive Order: Sales logs order | ???? Shipped products | ???? Customers |
| ???? Sales Department | ???? Customer order details | 2️⃣ Check Inventory: Ensure stock | ???? Order confirmation email | ???? Customers |
| ???? Shipping Department | ????️ Packaging materials | 3️⃣ Process Payment: Payment gateway | ???? Shipment tracking details | ???? Customers |
| ???? Payment Processor | ???? Payment confirmation | 4️⃣ Pick & Pack Items: Prepare order | ???? Invoice | ???? Sales Department |
| ???? Logistics/Shipping | ???? Shipping services | 5️⃣ Ship Order: Handover to logistics | ???? Updated inventory records | ???? Warehouse Team |
| ???? Warehouse Team | ????️ Labor | 6️⃣ Update Inventory: Log item out | ???? Successful delivery | ???? Customers |
This diagram can help identify delays (e.g., inventory shortages or shipping delays) and improve the overall customer experience.
Conclusion
A SIPOC diagram is an effective tool for any organization looking to streamline operations, improve communication, and optimize customer satisfaction. By offering a structured approach to analyzing processes, SIPOC diagrams empower teams to make data-driven decisions, minimize inefficiencies, and focus on continuous improvement.